R E S E A R C H A R T I C L E
Open Access
Varying the item format improved the
range of measurement in patient-reported
outcome measures assessing physical
function
Gregor Liegl
1*, Barbara Gandek
2,3, H. Felix Fischer
1,4, Jakob B. Bjorner
5,6,7, John E. Ware Jr.
2,3, Matthias Rose
1,2,
James F. Fries
8and Sandra Nolte
1,9Abstract
Background:Physical function (PF) is a core patient-reported outcome domain in clinical trials in rheumatic
diseases. Frequently used PF measures have ceiling effects, leading to large sample size requirements and low sensitivity to change. In most of these instruments, the response category that indicates the highest PF level is the statement that one is able to perform a given physical activity without any limitations or difficulty. This study investigates whether using an item format with an extended response scale, allowing respondents to state that the performance of an activity is easy or very easy, increases the range of precise measurement of self-reported PF.
Methods:Three five-item PF short forms were constructed from the Patient-Reported Outcomes Measurement
Information System (PROMIS®) wave 1 data. All forms included the same physical activities but varied in item stem and response scale: format A (“Are you able to…”;“without any difficulty”/“unable to do”); format B (“Does your health now limit you…”;“not at all”/“cannot do”); format C (“How difficult is it for you to…”;“very easy”/
“impossible”). Each short-form item was answered by 2217–2835 subjects. We evaluated unidimensionality and estimated a graded response model for the 15 short-form items and remaining 119 items of the PROMIS PF bank to compare item and test information for the short forms along the PF continuum. We then used simulated data for five groups with different PF levels to illustrate differences in scoring precision between the short forms using different item formats.
Results:Sufficient unidimensionality of all short-form items and the original PF item bank was supported.
Compared to formats A and B, format C increased the range of reliable measurement by about 0.5 standard deviations on the positive side of the PF continuum of the sample, provided more item information, and was more useful in distinguishing known groups with above-average functioning.
Conclusions:Using an item format with an extended response scale is an efficient option to increase the
measurement range of self-reported physical function without changing the content of the measure or affecting the latent construct of the instrument.
Keywords:Physical function, Patient-reported outcomes, Ceiling effects, Measurement range, Item-response theory,
Item information, Response scale, Item format
* Correspondence:[email protected]
1Department of Psychosomatic Medicine, Center for Internal Medicine and
Dermatology, Charité - Universitätsmedizin Berlin, Charitéplatz 1, 10117 Berlin, Germany
Full list of author information is available at the end of the article
Background
Patient-reported outcome (PRO) measures assessing health-related quality of life (HRQoL) have become an essential part of health outcomes research, clinical trials, epidemiological studies, and routine patient monitoring [1–3]. Physical function (PF) is one of the most frequently assessed HRQoL domains [4–6] and has been identified as a core PRO in clinical trials in rheumatic diseases [7]. Thus, efficient assessment of PF is very important. How-ever, traditional PF instruments with a fixed number of items, such as the 10-item Medical Outcome Study Short Form-36 (MOS SF-36®) Health Survey physical function-ing scale (PF-10) [8] and the 20-item Health Assessment Questionnaire Disability Index (HAQ-DI) [9], have to compromise between clinical practicality and measure-ment precision, leading to a limited measuremeasure-ment range on the continuum of physical ability [10].
With the application of item response theory (IRT), any number of items measuring the same latent trait can be calibrated on a common metric. Hence, IRT provides a flexible solution for the challenge of providing practical but still highly precise PRO assessment on a wide range of the latent trait continuum [11–14]. The National Institutes of Health (NIH)-funded Patient-Reported Outcomes Meas-urement Information System (PROMIS®) has been applying this approach for over 10 years, thereby demonstrating the relevance of IRT item calibration.
PROMIS has developed item banks for a large number of HRQoL domains [2, 15–19], including physical func-tion [10, 20–22]. An important advantage of providing a bank of items scaled on a common metric is that scores derived from different item subsets are directly compar-able. This enables the comparison of scores from tai-lored short forms, which are developed by choosing only the most informative items for a pre-specified trait level and individualized scores from computerized adaptive tests (CATs) [12, 23, 24]. Similarly, if items from differ-ent instrumdiffer-ents (e.g., short forms) are scaled on the same metric, the measurement precision of these instru-ments can be directly compared in various populations of interest [25, 26]. This is possible because IRT allows the measurement error of each item (and item subset) to be investigated at each level of the latent trait [27].
Using IRT methods, it has been demonstrated that most PRO instruments measuring PF have satisfactory measurement precision on below average to average functional levels [25, 28]. However, as these instruments have usually been developed for clinical use, they often have ceiling effects in the general population and in samples with higher levels of PF, meaning that a high percentage of these participants achieve the best possible score [29–31]. Thus, individuals with average or above average PF cannot be assessed precisely, leading to low sensitivity to change and larger sample size requirements
in clinical trials [28, 29]. The most frequently proposed solution to respond to this shortcoming is the use of items with more difficult content to increase test information on the upper end of a trait continuum [32]. However, this approach might not always be sufficient, e.g., when aiming at extending the measurement range of a static instrument with a fixed number of items or when ceiling effects are still present even after adding new items with more difficult content [33]. In such cases, the modification of the item format of existing items, e.g., by extending the response scale, may present an efficient way of adjusting for ceiling effects [34–36].
Physical function item formats may vary with regard to the item stem, tense (past or present), recall period, attribu-tion (e.g., attribuattribu-tion to health), or response opattribu-tions [4, 35, 37, 38]. For example, in two of the most widely used scales (PF-10, HAQ-DI), the response category that indicates the highest level of PF is the statement that one is able to per-form a given activity without any limitations or difficulty [8, 9]. However, there are alternative response scales, for ex-ample the one used in the Louisiana State University Health Status Instrument (LSU HSI) [36], that allow respondents to state that the performance of a given activity is easy or even very easy. Such an extended response scale potentially raises the measurement ceiling of PF measures, thus avoid-ing the necessity of writavoid-ing new items to measure the ability to perform more difficult activities.
To date, the effect of the item format on item perform-ance in terms of extending the measurement range of PRO measures of PF has not been investigated systematic-ally. To examine the hypothesis that a response format that asks about the ease of doing an activity improves the measurement range, a modification of the LSU HSI item format was incorporated into a set of experimental items in the PROMIS wave 1 data collection [35]. This study uses PROMIS data and IRT to calibrate three five-item short forms with similar content but different item for-mats on a common metric, to compare the measurement precision and validity of this new item format with two widely used item formats derived from the HAQ-DI and the SF-8™Health Survey [39].
Methods
Development of the PROMIS PF item bank
As detailed elsewhere [35], an initial systematic search for PF instruments resulted in the preliminary retention of 168 unique items, which were rewritten to establish a consistent item structure for the PROMIS item bank. This set of 168 revised items was then field tested in the general population and in clinical samples in the USA (total n = 15,817) and analyzed applying established standard criteria for PROMIS item bank development [39]. To minimize the burden on respondents, items were administered in two different de-signs: (1) a“full bank”design in which separate subsamples answered either 112 (form C) or 56 (form G) PF items and (2) a balanced incomplete“block”design in which subsam-ples answered blocks of 21 PF items and items for other PROMIS domains. As a result, each PF item was answered by 2201 to 2926 participants [19, 22]. After psychometric evaluation, the final PROMIS PF item bank version 1.0 con-sisted of 124 items [22].
Experimental items
Because preparatory analyses showed that the item for-mats derived from the HAQ-DI [9] (format A: prefaced with “Are you able to …?”; this included five response categories ranging from“without any difficulty”to“unable to do”) and the SF-8 [37] (format B: prefaced with“Does your health now limit you…?”; this included five response options ranging from“not at all”to“cannot do”) revealed appropriate psychometric properties [10] and appeared to be the formats most comprehensible to participants in a
pre-test, these two formats were predominantly used for the aforementioned set of 168 items for field testing [35]. However, for experimental reasons, in a small number of items a modified LSU HSI [36] item format was used (format C: prefaced with“How difficult is it for you…”; this included six response options ranging from “very easy”to“impossible”).
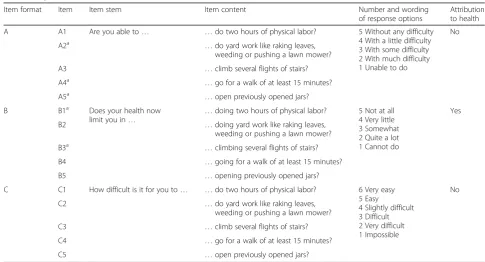
To compare the influence of these item formats on item performance, the set of 168 items included 15 experimen-tal items: 5 instrumenexperimen-tal activities of daily living (IADLs) of different difficulty levels were presented in all three aforementioned item formats. These three sets of five items differed with regard to the number of response options, definition of the highest and lowest response categories, and attribution to health or not (Table 1). As a result, three five-item short forms with similar content (IADLs) but different item formats were constructed. Of the 15 experimental items, 5 were used in the final 124-item PROMIS PF 124-item bank, with 3 presented in format A and 2 presented in format B.
Data analysis
Item bank evaluation and calibration
[image:3.595.53.539.461.723.2]Sufficient unidimensionality of the final 124-item PROMIS PF bank had previously been established [22] and was re-evaluated including the 10 additional experimental items, using confirmatory factor analysis (CFA) of a one-factor model with a weighted least squares means and variance
Table 1Experimental PROMIS PF items for five activities administered in three different item formats
Item format Item Item stem Item content Number and wording
of response options
Attribution to health
A A1 Are you able to… …do two hours of physical labor? 5 Without any difficulty
4 With a little difficulty 3 With some difficulty 2 With much difficulty 1 Unable to do
No
A2a …do yard work like raking leaves,
weeding or pushing a lawn mower?
A3 …climb several flights of stairs?
A4a …go for a walk of at least 15 minutes?
A5a …open previously opened jars?
B B1a Does your health now
limit you in… …
doing two hours of physical labor? 5 Not at all
4 Very little 3 Somewhat 2 Quite a lot 1 Cannot do
Yes
B2 …doing yard work like raking leaves,
weeding or pushing a lawn mower?
B3a …climbing several flights of stairs?
B4 …going for a walk of at least 15 minutes?
B5 …opening previously opened jars?
C C1 How difficult is it for you to… …do two hours of physical labor? 6 Very easy
5 Easy
4 Slightly difficult 3 Difficult 2 Very difficult 1 Impossible
No
C2 …do yard work like raking leaves,
weeding or pushing a lawn mower?
C3 …climb several flights of stairs?
C4 …go for a walk of at least 15 minutes?
C5 …open previously opened jars?
a
adjusted (WLSMV) estimator and a bifactor model, specify-ing local factors for items that shared the same response format. CFA analyses of experimental items in format A used data from “full bank”form C (97 items total), while analysis of formats B and C experimental items used data from“full bank”form G (37 items total); for more informa-tion on study design, see [22]. A potential problem of local independence between similar items in Format B and C being administered to the same group was evaluated by analyzing residual correlations. Residual correlation of 0.25 or more was considered potentially problematic and the impact on IRT item parameters was evaluated, as previ-ously described [22].
A graded response model (GRM) was fitted to the set of 134 items consisting of the 15 experimental items (three format-specific short forms) and the remaining 119 items of the final PROMIS PF item bank. Due to the data collec-tion design used for the initial set of 168 PF items, some participants answered only a few of the 134 items analyzed in this study. As in previous analyses [22], only partici-pants who responded to at least two of the 134 PF items were included in the GRM. Although GRM item parame-ters had already been estimated for the 124 items of the final item bank [22], including 5 of the experimental items, the model was re-estimated to include the 10 additional experimental items. As in previous analyses [22], if a specific response category for an item was answered less than three times, the response option was collapsed with the next higher category to ensure stable item parameter estimates. We estimated item parameters comprising item thresholds and item slopes. Threshold parameters define the range on the latent trait continuum at which a particular response is most likely. The slope parameter specifies the discriminative value of an item. Item fit was evaluated using theS-X2statistic.
For estimating individual PF scores, we used the expected-a-posteriori method to calculate theta scores that were subsequently linearly transformed to a T-metric (mean = 50, SD = 10 in the calibration sample used in this analysis). To determine the precision of a particular item, we calculated item information functions (IIFs), defining the contribution of an item to the overall precision of the item bank at a givenT-score level [27]. Differences between IIFs resulting from varying the item format were visualized using item information curves (IICs). Using natural cubic spline interpolation, we calculated the area under the curve (AUC) for each IIC on the empirically observed T-score range in the calibration sample as a measure of overall item information. To investigate systematic differences in meas-urement precision depending on the item format used, we first calculated test information functions for each of the format-specific short forms by summarizing respective IIFs and then we compared the resulting format-specific test in-formation curves and related AUCs.
Simulation study
Due to the study design, no participant in the calibration sample responded to any of the five IADLs used in the experimental items in all three formats. Therefore, to illustrate the performance of all three formats simultan-eously, we used simulated data, following the approach used by Voshaar et al. to evaluate PROMIS PF CATs [25]. In the first step, we simulated“true”PFT-scores based on the PF score distributions found for five groups in the calibration sample with different self-reported general health; 10,000“true”PFT-scores were simulated for each of the following five general health groups:
(1)Poor general health group: mean PFT-score = 35.6 (SD = 6.5) (2)Fair general health group:
mean PFT-score = 41.9 (SD = 7.6) (3)Good general health group:
mean PFT-score = 48.9 (SD = 7.8) (4)Very good general health group:
mean PFT-score = 54.4 (SD = 7.2) (5)Excellent general health group:
mean PFT-score = 58.8 (SD = 6.5)
In the next step, we simulated responses to the 134 PROMIS PF items for all 50,000 respondents based on their“true”score and the item parameters from the GRM. We scored the three format-specific five-item short forms and the 124-item final PROMIS PF item bank (from now on referred to as the “full bank”) using the simulated re-sponses to the respective items in each of these measures.
To illustrate differences in measurement precision due to item format, we calculated root mean square errors (RMSEs) between simulated true scores and corresponding short form scores, with lower values indicating better agreement in estimating individual PF levels [42].
To illustrate how the differences in item format affect the ability to distinguish groups with different levels of PF, we calculated relative validity (RV) coefficients for each format-specific short form [22, 43]. The RV coefficients were calculated using the analysis of variance (ANOVA)
(1)Full sample (ANOVA between all five general health groups; n = 50,000)
(2)Average PF compilation (ANOVA between groups with fair, good, and very good general health; n = 30,000)
(3)Below-average PF compilation (ANOVA between groups with poor general health and fair general health; n = 20,000)
(4)Above-average PF compilation (ANOVA between groups with very good and excellent general health; n = 20,000)
CFAs were conducted using Mplus 7.4 [45]. All other statistical analyses were conducted using R 3.1.2 [46]. We used the packages mirt [47] for estimating the GRM and simulating response patterns. For calculating AUCs, we used the package MESS [48]. For plotting item and test information curves, we used ggplot2 [49].
Results
Sample
A total of 15,719 subjects responded to at least two of the 134 items analyzed in this study and therefore were included in the GRM. Of these, only 10 subjects (<0.1%) responded to fewer than 6 items; 99.7% responded to at least 12 items. More than half (54%; n = 8568) responded to one or more of the 15 experimental items (sample characteristics in Additional file 1: Table S1). The experi-mental items were answered by 2217–2835 participants. The calibration sample had a wide range of PF, with em-pirically observedT-scores (mean = 50, SD = 10) ranging from 11.1 to 73.6.
Evaluation of unidimensionality
Form C and form G had satisfactory fit for the one-factor solution. Factor loadings for the experimental items ranged between 0.83 and 0.93 (format A), 0.83 and 0.96 (format B), and 0.72 and 0.92 (format C). We found residual correlation above 0.25 in one only pair of items (B5 and C5,r= 0.30). However, excluding item B5 in the GRM calibration did not notably affect the parameters of item C5 and vice versa, so both items were retained. In the bifactor models, loadings on the global PF factor were substantially higher than loadings on local factors defined by the common response format, thus support-ing sufficient unidimensionality of the experimental items and the original PF item bank. For more details, see Additional file 2: Table S2.
Item properties
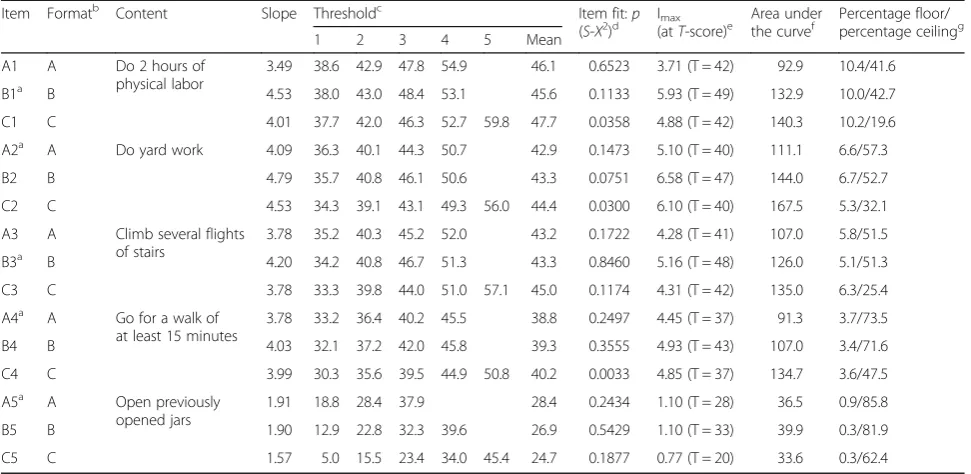
The results of the IRT analyses for the 15 experimental items (5 IADLs presented in three different item for-mats) are summarized in Table 2. When adjusting for multiple testing, no item fit-statistic showed significant
misfit for any experimental item. Except for one IADL (“open previously opened jars”), item slopes were gener-ally high for all formats. Items prefaced with“Does your health now limit you …” (format B) tended to show slightly higher slope parameters compared to formats A and C (see Table 2).
Item thresholds tended to be similar for format A and format B. In contrast, using format C with the item stem
“How difficult is it for you to…”and an extended six-cate-gory response scale (ranging from “impossible” to “very easy”) expanded the range of the thresholds on the latent trait continuum in both directions. This was particularly pronounced at the positive end of the continuum where the last response in format C increased the measurement range by≥0.5 SDs of the PF distribution of the sample for all physical activities. As a consequence, the percentage of participants who responded with the highest possible re-sponse category was systematically lower (by about 20– 25% of the total sample) for items presented in format C compared to the other formats. For two of the more diffi-cult activities (2 hours of physical labor and climbing sev-eral flights of stairs), the ceiling effects were halved when using format C compared to both format A and format B (see Table 2).
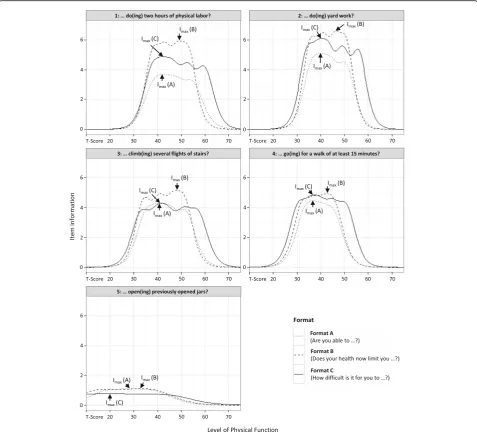
Figure 1 depicts the IICs for all experimental items presented in different item formats. Format B delivered the highest maximum item information for four of the five physical activities. Moreover, the maximum item information of format B was placed on a systematically higher point on the PF continuum compared to the other formats. In contrast, format C had the broadest measurement range on the T-score continuum for each of the five physical activities. The maximum item infor-mation of a given item and corresponding points on the latent trait and the AUCs are presented in Table 2. The highest overall item information as specified by the AUC was found for format C except for items asking about opening previously opened jars.
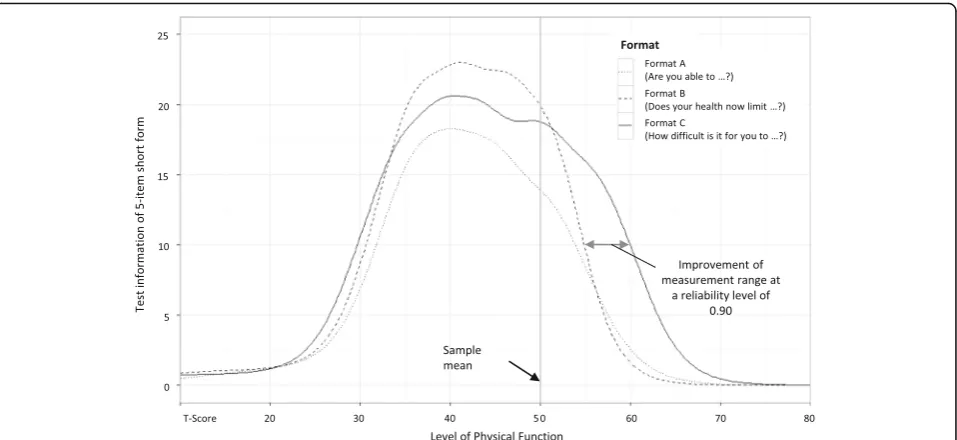
Consequently, the item format affected the total test information provided by the short forms (Fig. 2). The highest maximum test information was found for format B, while items with an extended response format (format C) were highly informative on the widest range on the latent continuum. That is, format C increased the range of highly reliable measurements (defined as marginal reliability ≥0.9≈test information ≥10) by about 0.5 SDs of the PF distribution of the sample on the positive side of the continuum and about 0.1 to 0.2 SDs on the nega-tive side of the continuum.
larger than for format A (AUC = 92) and 81% larger than for format B (AUC = 106).
Agreement between true scores and short forms
The results of the simulation study indicated that the agree-ment between the simulated true scores and the estimated short form scores was generally lower for formats A and B than for format C (Table 3). Using formats A and B, the agreement with the simulated true scores became even lower when analyzing groups with average to high PF levels (up to RMSE of 4.3 for format A and RMSE of 4.4 for for-mat B). In contrast, the agreement between simulated true scores and short form scores remained relatively constant among all groups when using format C, even in individuals with excellent general health (RMSE≤3.3).
The highest possible short formT-score was 61.8 when using format A and 61.0 when using format B. In contrast, format C allowed forT-scores up to 65.5, which reduced ceiling effects by more than half in the full simulated sam-ple. Format C was found to be especially beneficial for groups with high PF levels. For example, in the subgroup with “very good” general health, 45.4% of the simulated sample reached the highest possible short form score when using format B. In contrast, only 16.8% of the sub-group with“very good”health reached the highest possible score when using format C. Moreover, lower floor effects were found when using format C.
Distinguishing known groups
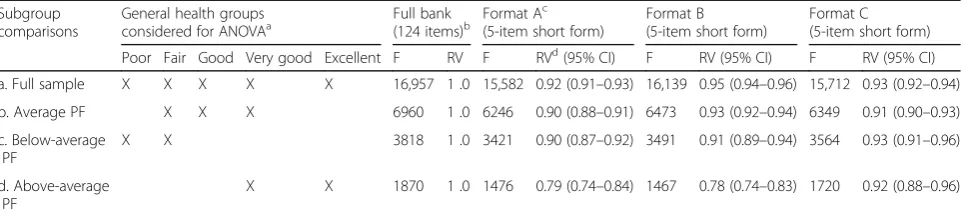
The results of the RV analyses using simulated data are presented in Table 4. In most group comparisons (compari-sons a, b, and c) the RV was 0.90 or above for all item formats. In contrast, when distinguishing between the two groups with “very good” and “excellent” general health (comparison d), the RV coefficients of format A (RV = 0.79; 95% CI = 0.74–0.84) and format B (RV = 0.78; 95% CI = 0.74–0.83) were considerably lower compared to format C (RV = 0.92; 95% CI = 0.88–0.96).
Discussion
In this study we compared the performance of three different item formats for measuring self-reported PF by analyzing item information. Using simulated data, we il-lustrated precision in estimating scores and validity in distinguishing between known groups of three five-item short forms with identical content but different item stems and response scales. The five physical activities included in these short forms covered a broad range of item difficulty. Using IRT methodology for data analysis offered the unique opportunity to investigate and visualize meas-urement precision and range at the item level.
[image:6.595.56.542.99.336.2]We found strong evidence that the item format may affect the measurement properties of patient-reported PF outcomes. These findings are of practical importance both to researchers and clinicians because this is not Table 2Psychometric results for the experimental items presented in three different item formats
Item Formatb Content Slope Thresholdc Item fit:p
(S-X2)d Imax(atT-score)e Area underthe curvef Percentage floor/percentage ceilingg
1 2 3 4 5 Mean
A1 A Do 2 hours of
physical labor
3.49 38.6 42.9 47.8 54.9 46.1 0.6523 3.71 (T = 42) 92.9 10.4/41.6
B1a B 4.53 38.0 43.0 48.4 53.1 45.6 0.1133 5.93 (T = 49) 132.9 10.0/42.7
C1 C 4.01 37.7 42.0 46.3 52.7 59.8 47.7 0.0358 4.88 (T = 42) 140.3 10.2/19.6
A2a A Do yard work 4.09 36.3 40.1 44.3 50.7 42.9 0.1473 5.10 (T = 40) 111.1 6.6/57.3
B2 B 4.79 35.7 40.8 46.1 50.6 43.3 0.0751 6.58 (T = 47) 144.0 6.7/52.7
C2 C 4.53 34.3 39.1 43.1 49.3 56.0 44.4 0.0300 6.10 (T = 40) 167.5 5.3/32.1
A3 A Climb several flights
of stairs
3.78 35.2 40.3 45.2 52.0 43.2 0.1722 4.28 (T = 41) 107.0 5.8/51.5
B3a B 4.20 34.2 40.8 46.7 51.3 43.3 0.8460 5.16 (T = 48) 126.0 5.1/51.3
C3 C 3.78 33.3 39.8 44.0 51.0 57.1 45.0 0.1174 4.31 (T = 42) 135.0 6.3/25.4
A4a A Go for a walk of
at least 15 minutes
3.78 33.2 36.4 40.2 45.5 38.8 0.2497 4.45 (T = 37) 91.3 3.7/73.5
B4 B 4.03 32.1 37.2 42.0 45.8 39.3 0.3555 4.93 (T = 43) 107.0 3.4/71.6
C4 C 3.99 30.3 35.6 39.5 44.9 50.8 40.2 0.0033 4.85 (T = 37) 134.7 3.6/47.5
A5a A Open previously
opened jars
1.91 18.8 28.4 37.9 28.4 0.2434 1.10 (T = 28) 36.5 0.9/85.8
B5 B 1.90 12.9 22.8 32.3 39.6 26.9 0.5429 1.10 (T = 33) 39.9 0.3/81.9
C5 C 1.57 5.0 15.5 23.4 34.0 45.4 24.7 0.1877 0.77 (T = 20) 33.6 0.3/62.4
a
Item is part of the final Patient Reported Outcomes Measurement Information System Physical Function (PROMIS PF) item bank version 1.0.b
Format A:“Are you able to…”(five-category response scale from“Without any difficulty”to“Unable to do”); format B:“Does your health now limit you in…”(five-category response scale from“Not at all”to“Cannot do”); format C:“How difficult is it for you to…”(six-category response scale from“Very easy”to“Impossible”).cThresholds are transformed to aT-score of 50 ± 10, where 50 = mean and 10 = standard deviation of the analytic sample; slopes are reported unchanged.d
X2
statistics (S-X2 ) were evaluated after adjusting for multiple testing (p< 0.0033).e
Imax(atT-score) depicts the maximum of item information (upper number) of a given item at the corresponding point on theT-score continuum.f
only relevant for the development of new instruments but also for the selection of currently available question-naires for assessing PF in a given population of interest. Moreover, these findings deliver useful information for data interpretation, as the distribution of presumably similar samples can be impacted by the way items are phrased, i.e., identical content but different stem and re-sponse format.
In detail, we found that item information differed systematically between the three formats. Format C (“How difficult is it for you to …”), which used an extended
response scale including a sixth response option (“very easy”), improved the measurement range by about half a standard deviation on the positive side of the continuum and by about a tenth to a fifth of a standard deviation at the negative end of the continuum, compared to format A (“Are you able to…”) and format B (“Does your health now limit you …”). This finding was consistent across different item difficulties. The improvement of the measurement range was found to be particularly beneficial for groups with above-average PF levels, reducing the number of subjects demonstrating ceiling effects in a five-item short Fig. 1Comparison of item information functions (IIFs) using different item formats. Format A:“Are you able to…”(five-category response scale from“Without any difficulty”to“Unable to do”); format B:“Does your health now limit you in…”(five-category response scale from“Not at all”to
[image:7.595.59.537.88.520.2]form by half or even more, when using format C instead of the other item formats. As a consequence, format C was the only item format that had relatively constant measure-ment precision for all PF levels investigated in the simula-tion study and had sufficient power to distinguish between groups with above-average functioning. As the improved measurement range of format C was particularly apparent at the positive end of the PF continuum, it seems likely that this improvement was not solely caused by using six instead of five response options but rather by allowing subjects to state that activities were“very easy”.
Moreover, our results support that all included item formats measured the same latent construct of PF. The majority of factor loadings were high and their respective magnitude seemed to depend mainly on item content. Consequently, although the final PROMIS PF item bank includes item formats with five-category response options only [35], this study provides evidence that an extended response scale can be applied without affecting the under-lying PF construct.
These findings have practical implications for the chal-lenge when encountering ceiling effects, for example, when measuring PF in the general population or in other samples with high PF. The usual way to minimize such ceiling effects is to provide new items with item content that is more relevant for individuals with high PF [32, 33]. However, although providing a larger number of items assessing the extremes of a given trait is undoubt-edly useful for the improvement of CATs, this approach
does not seem beneficial for increasing the measurement performance of static measures that use the same items for all respondents. Such static measures may still be preferred by many researchers and clinicians for prac-tical reasons [4]. Our findings suggest that it is possible to reduce ceiling effects by optimizing the item format without changing the content of the measures, which may be especially relevant for the future development of items for static PF measures for use in heterogeneous populations with a broad range of ability. However, such modified items should be evaluated psychometrically before use, and additional qualitative item review may be needed. Doing so was beyond the scope of this study.
Another finding of our study is that compared to item formats that do not use attribution, items prefaced with a health-related item stem, as used in format B, delivered the highest maximum item information on a rather nar-row range on the PF continuum. Therefore, those types of items seem to be particularly interesting for CATs where highly informative items are selected automatic-ally based on the individual patient’s trait level. More-over, using format B resulted in increased power to distinguish between known groups with close-to-average PF levels compared to the other formats. However, it is not entirely clear if these benefits of format B are caused by health attribution; another reason could be that the wording in format B focuses on“limitations” while both format A and format C ask for“difficulty”in performing physical activities. Further, slightly lower floor effects Fig. 2Comparison of test information functions between different item formats. Format A:“Are you able to…”(five-category response scale from“Without any difficulty”to“Unable to do”); format B:“Does your health now limit you in…”(five-category response scale from“Not at all”to
[image:8.595.60.539.87.307.2]Table 3 PROMIS PF full bank and short form scoring characteristics and agreement with simulated “ true ” scores Gener al heal th groups True PF T -sco re a mean (SD) Full bank (124 item s) b Form at A e(5-ite m short form ) Form at B (5-it em short form) Format C (5-ite m short form ) T -sco re mean (SD) RMSE c Perc entage floo r/ percen tage ceil ing d T
-score mean
(SD) RMS E Percent age floor/ percent age ceiling T
-score mean
were found for format B (using“cannot do” as the low-est response option) than for format A (using“unable to do”as the lowest response option).
Our study has some limitations. First, our conclusions are based on only five items. Consequently, we cannot be sure that our results apply to all items in the PRO-MIS PF item bank. However, the format-specific differ-ences were highly consistent among all experimental items. A second limitation concerns the selection of only three item formats. Among PRO instruments for the as-sessment of PF there is a large variety of item formats, which differ in many more aspects than the response scale and item stem [35, 37, 38]. Future studies should clarify whether other formats should be considered for further optimization of measurement precision, and also if the wording of the formats used in this study can be further improved [50]. In particular, modifications might be made to format C, which is based on the LSU HSI (format C: “How difficult is it for you to …”), in which the item stem asked about difficulty but not ease, whereas the corresponding response set included“easy” and“very easy”.
Third, we had to use simulated data for illustrating differences in measurement precision due to the item formats because the study design did not permit direct comparisons using real data. Fourth, it has been shown that PF measures are not only limited by ceiling effects but also by floor effects when assessing highly disabled populations [33]. It seems unlikely that this issue can be solved sufficiently by simply modifying the response scale, as the most extreme response option at the nega-tive end of the trait continuum is usually rated “ impos-sible”. For highly disabled samples, it may therefore be necessary to include items asking about basic activities of daily living (ADLs). Finally, although we found differ-ences in measurement precision between the item for-mats, it remains unclear whether one of the formats used in this study is superior to the others in measuring
what a person is actually able to perform, i.e., as mea-sured by performance-based outcome measures.
Conclusions
This study systematically investigated differences in meas-urement properties resulting from extending the response scale of PRO measures assessing PF. Our findings provide evidence that using an extended six-category response format, including the response options “easy” and “very easy”, is an efficient and valid way to considerably extend the range of precise measurement of PF at the positive end of the trait continuum without changing the content of the measure or affecting the latent construct of the instrument. Optimizing the item format offers an effective opportunity to improve measurement precision and to reduce ceiling effects. This is especially relevant for the application of generic short forms in populations with average and above-average levels of PF and for the selec-tion of global items measuring PF.
Additional files
Additional file 1: Table S1.Summary of sample characteristics. (DOCX 38 kb)
Additional file 2: Table S2.Results of confirmatory factor analyses. (DOCX 38 kb)
Abbreviations
ADL:Basic activities of daily living; ANOVA: Analysis of variance; AUC: Area under the curve; CAT: Computerized adaptive testing; CFA: Confirmatory factor analysis; GRM: Graded response model; HAQ-DI: Health Assessment Questionnaire Disability Index; HRQoL: Health-related quality of life; IADL: Instrumental activities of daily living; IIC: Item information curve; IIF: Item information function; IRT: Item response theory; LSU HSI: Louisiana State University Health Status Instrument; MOS SF-36: Medical Outcome Study Short Form-36; PF: Physical function; PF-10: Medical Outcome Study Short Form-36 Health Survey Physical Function scale; PRO: Patient-reported outcome; PROMIS: Patient-reported outcomes measurement information system; RMSE: Root mean square error; RV: Relative validity
[image:10.595.58.540.99.207.2]Acknowledgements Not applicable. Table 4Analysis of variance (ANOVA) and relative validity (RV)
Subgroup comparisons
General health groups
considered for ANOVAa Full bank(124 items)b Format A
c (5-item short form)
Format B (5-item short form)
Format C (5-item short form)
Poor Fair Good Very good Excellent F RV F RVd(95% CI) F RV (95% CI) F RV (95% CI)
a. Full sample X X X X X 16,957 1 .0 15,582 0.92 (0.91–0.93) 16,139 0.95 (0.94–0.96) 15,712 0.93 (0.92–0.94)
b. Average PF X X X 6960 1 .0 6246 0.90 (0.88–0.91) 6473 0.93 (0.92–0.94) 6349 0.91 (0.90–0.93)
c. Below-average PF
X X 3818 1 .0 3421 0.90 (0.87–0.92) 3491 0.91 (0.89–0.94) 3564 0.93 (0.91–0.96)
d. Above-average PF
X X 1870 1 .0 1476 0.79 (0.74–0.84) 1467 0.78 (0.74–0.83) 1720 0.92 (0.88–0.96)
a
Subgroups marked X were considered for calculatingFvalues (ANOVA); n = 10,000 per subgroup.bFinal Patient Reported Outcomes Measurement Information System Physical Function (PROMIS PF) item bank version 1.0.c
Format A:“Are you able to…”(five-category response scale from“Without any difficulty”to“Unable to do”); format B:“Does your health now limit you in…”(five-category response scale from“Not at all”to“Cannot do”); format C:“How difficult is it for you to…”
(six-category response scale from“Very easy”to“Impossible”).d
Funding
Data analysis and preparation of the article was supported by a Rahel-Hirsch scholarship from the Charité - Universitätsmedizin Berlin to SN. Additional support was provided by University of Massachusetts Medical School from its own research funds. This article uses data collected and developed under the Patient Reported Outcomes Measurement Information System (PROMIS; www.nihpromis.org), which was funded by the National Institutes of Health (NIH) Common Fund Initiative under a number of cooperative agreements, including an agreement with Stanford University (PI: James Fries, MD, U01AR52158) to develop the Wave 1 PF item bank and with Northwestern University (PI: David Cella, PhD, U01AR52177) for the PROMIS Statistical Co-ordinating Center. The content of this article is solely the responsibility of the authors and does not necessarily represent the official views of the National Institutes of Health. The funders did not have any role in study design, in the analysis and interpretation of data, in the writing of the manuscript, or in the decision to submit the article for publication.
Availability of data and materials
The PROMIS wave 1 dataset analyzed during the current study is available in the Harvard Dataverse repository (https://dataverse.harvard.edu). The set of simulated data generated and analyzed during the current study is available from the corresponding author (GL) on reasonable request.
Authors’contributions
GL contributed to study conception and design, analyzed and interpreted the data, wrote the first draft of the manuscript, and had primary responsibility for manuscript revision. BG contributed to study conception and design, data analysis and interpretation, and revised the manuscript. FF conducted statistical analyses, and contributed to interpretation of the data and manuscript revision. JBB contributed to study conception and design, data analysis and interpretation, and manuscript revision. JEW and MR contributed to study conception and design, interpretation of the data, and manuscript revision. JFF contributed to study conception and design and manuscript review. SN contributed to study conception, statistical analyses, interpretation of the data, and manuscript conception and revision. All authors read and approved the final manuscript.
Competing interests
The authors declare that they have no competing interests.
Consent for publication Not applicable.
Ethics approval and consent to participate
The data collection was approved by the Institutional Review Boards at Northwestern University (for the Statistical Coordinating Center) and Stanford University. All participants provided written informed consent.
Author details
1Department of Psychosomatic Medicine, Center for Internal Medicine and
Dermatology, Charité - Universitätsmedizin Berlin, Charitéplatz 1, 10117
Berlin, Germany.2Department of Quantitative Health Sciences, University of
Massachusetts Medical School, Worcester, MA, USA.3John Ware Research
Group, Watertown, MA, USA.4Institute for Social Medicine, Epidemiology and
Health Economics, Charité–Universitätsmedizin Berlin, Berlin, Germany.
5National Research Centre for the Working Environment, Copenhagen,
Denmark.6Optum, Lincoln, RI, USA.7Department of Public Health, University
of Copenhagen, Copenhagen, Denmark.8Department of Immunology and
Rheumatology, Stanford University School of Medicine, Palo Alto, CA, USA.
9Population Health Strategic Research Centre, School of Health and Social
Development, Deakin University, Melbourne, VIC, Australia.
Received: 10 October 2016 Accepted: 27 February 2017
References
1. Ahmed S, Berzon RA, Revicki DA, Lenderking WR, Moinpour CM, Basch E, et al. The use of patient-reported outcomes (PRO) within comparative effectiveness research: implications for clinical practice and health care policy. Med Care. 2012;50:1060–70.
2. Garcia SF, Cella D, Clauser SB, Flynn KE, Lad T, Lai J-S, et al. Standardizing reported outcomes assessment in cancer clinical trials: a patient-reported outcomes measurement information system initiative. J Clin Oncol. 2007;25:5106–12.
3. Calvert M, Thwaites R, Kyte D, Devlin N. Putting patient-reported outcomes on the‘Big Data Road Map’. J R Soc Med. 2015;108:299–303.
4. Schalet BD, Revicki DA, Cook KF, Krishnan E, Fries JF, Cella D. Establishing a common metric for physical function: linking the HAQ-DI and SF-36 PF subscale to PROMIS physical function. J Gen Intern Med. 2015;30:1517–23.
5. Kluetz PG, Slagle A, Papadopoulos EJ, Johnson LL, Donoghue M, Kwitkowski VE, et al. Focusing on core patient-reported outcomes in cancer clinical trials: symptomatic adverse events, physical function, and disease-related symptoms. Clin Cancer Res. 2016;22:1553–8.
6. Oude Voshaar MA, ten Klooster PM, Taal E, Krishnan E, van de Laar MA. Dutch translation and cross-cultural adaptation of the PROMIS® physical function item bank and cognitive pre-test in Dutch arthritis patients. Arthritis Res Ther. 2012;14:1–7.
7. van Tuyl LH, Boers M. Patient-reported outcomes in core domain sets for rheumatic diseases. Nat Rev Rheumatol. 2015;11:705–12.
8. Ware Jr JE, Sherbourne CD. The MOS 36-item short-form health survey (SF-36). I. Conceptual framework and item selection. Med Care. 1992;30(6):473–83.
9. Bruce B, Fries JF. The Stanford Health Assessment Questionnaire: a review of its history, issues, progress, and documentation. J Rheumatol. 2003;30:167–78. 10. Rose M, Bjorner JB, Becker J, Fries JF, Ware JE. Evaluation of a preliminary
physical function item bank supported the expected advantages of the Patient-Reported Outcomes Measurement Information System (PROMIS). J Clin Epidemiol. 2008;61:17–33.
11. Embretson SE, Reise SP. Item response theory. Mahwah (NJ): Psychology Press; 2000.
12. Cella D, Gershon R, Lai J-S, Choi S. The future of outcomes measurement: item banking, tailored short-forms, and computerized adaptive assessment. Qual Life Res. 2007;16:133–41.
13. Liegl G, Wahl I, Berghofer A, Nolte S, Pieh C, Rose M, et al. Using Patient Health Questionnaire-9 item parameters of a common metric resulted in similar depression scores compared to independent item response theory model reestimation. J Clin Epidemiol. 2016;71:25–34.
14. Petersen MA, Aaronson NK, Arraras JI, Chie WC, Conroy T, Costantini A, et al. The EORTC computer-adaptive tests measuring physical functioning and fatigue exhibited high levels of measurement precision and efficiency. J Clin Epidemiol. 2013;66:330–9.
15. Amtmann D, Cook KF, Jensen MP, Chen W-H, Choi S, Revicki D, et al. Development of a PROMIS item bank to measure pain interference. Pain. 2010;150:173–82.
16. Hahn EA, DeVellis RF, Bode RK, Garcia SF, Castel LD, Eisen SV, et al. Measuring social health in the patient-reported outcomes measurement information system (PROMIS): item bank development and testing. Qual Life Res. 2010;19:1035–44.
17. Lai J-S, Cella D, Choi S, Junghaenel DU, Christodoulou C, Gershon R, et al. How item banks and their application can influence measurement practice in rehabilitation medicine: A PROMIS fatigue item bank example. Arch Phys Med Rehabil. 2011;92:20–7.
18. Pilkonis PA, Choi SW, Reise SP, Stover AM, Riley WT, Cella D. Item banks for measuring emotional distress from the Patient-Reported Outcomes Measurement Information System (PROMIS®): depression, anxiety, and anger. Assessment. 2011;18:263–83.
19. Cella D, Riley W, Stone A, Rothrock N, Reeve B, Yount S, et al. The Patient-Reported Outcomes Measurement Information System (PROMIS) developed and tested its first wave of adult self-reported health outcome item banks: 2005-2008. J Clin Epidemiol. 2010;63:1179–94.
20. Fries JF, Witter J, Rose M, Cella D, Khanna D, Morgan-DeWitt E. Item response theory, computerized adaptive testing, and PROMIS: assessment of physical function. J Rheumatol. 2014;41:153–8.
21. Oude Voshaar MA, Ten Klooster PM, Glas CA, Vonkeman HE, Taal E, Krishnan E, et al. Validity and measurement precision of the PROMIS physical function item bank and a content validity-driven 20-item short form in rheumatoid arthritis compared with traditional measures. Rheumatology (Oxford). 2015;54:2221–9. 22. Rose M, Bjorner JB, Gandek B, Bruce B, Fries JF, Ware Jr JE. The PROMIS Physical
23. Fries JF, Bruce B, Cella D. The promise of PROMIS: using item response theory to improve assessment of patient-reported outcomes. Clin Exp Rheumatol. 2005;23:53–7.
24. Ware Jr JE, Kosinski M, Bjorner JB, Bayliss MS, Batenhorst A, Dahlöf CG, et al. Applications of computerized adaptive testing (CAT) to the assessment of headache impact. Qual Life Res. 2003;12:935–52.
25. Oude Voshaar MAH, ten Klooster PM, Glas CAW, Vonkeman HE, Krishnan E, van de Laar MAFJ. Relative performance of commonly used physical function questionnaires in rheumatoid arthritis and a patient-reported outcomes measurement information system computerized adaptive test. Arthritis Rheumatol. 2014;66:2900–8.
26. Wahl I, Lowe B, Bjorner JB, Fischer F, Langs G, Voderholzer U, et al.
Standardization of depression measurement: a common metric was developed for 11 self-report depression measures. J Clin Epidemiol. 2014;67:73–86. 27. Bjorner JB, Chang C-H, Thissen D, Reeve BB. Developing tailored
instruments: item banking and computerized adaptive assessment. Qual Life Res. 2007;16:95–108.
28. Fries JF, Krishnan E, Rose M, Lingala B, Bruce B. Improved responsiveness and reduced sample size requirements of PROMIS physical function scales with item response theory. Arthritis Res Ther. 2011;13:R147.
29. Fries J, Rose M, Krishnan E. The PROMIS of better outcome assessment: responsiveness, floor and ceiling effects, and Internet administration. J Rheumatol. 2011;38:1759–64.
30. Oude Voshaar MA, ten Klooster PM, Taal E, van de Laar MA. Measurement properties of physical function scales validated for use in patients with rheumatoid arthritis: a systematic review of the literature. Health Qual Life Outcomes. 2011;9:99.
31. Stucki G, Stucki S, Bruhlmann P, Michel BA. Ceiling effects of the Health Assessment Questionnaire and its modified version in some ambulatory rheumatoid arthritis patients. Ann Rheum Dis. 1995;54:461–5. 32. Bruce B, Fries J, Lingala B, Hussain YN, Krishnan E. Development and
assessment of floor and ceiling items for the PROMIS physical function item bank. Arthritis Res Ther. 2013;15:R144.
33. Fries JF, Lingala B, Siemons L, Glas CA, Cella D, Hussain YN, et al. Extending the floor and the ceiling for assessment of physical function. Arthritis Rheumatol (Hoboken, NJ). 2014;66:1378–87.
34. Marfeo EE, Ni P, Chan L, Rasch EK, Jette AM. Combining agreement and frequency rating scales to optimize psychometrics in measuring behavioral health functioning. J Clin Epidemiol. 2014;67:781–4.
35. Bruce B, Fries JF, Ambrosini D, Lingala B, Gandek B, Rose M, et al. Better assessment of physical function: item improvement is neglected but essential. Arthritis Res Ther. 2009;11:R191.
36. Fisher Jr WP, Eubanks RL, Marier RL. Equating the MOS SF36 and the LSU HSI physical functioning scales. J Outcome Meas. 1997;1:329–62. 37. Holsbeeke L, Ketelaar M, Schoemaker MM, Gorter JW. Capacity, capability,
and performance: different constructs or three of a kind? Arch Phys Med Rehabil. 2009;90:849–55.
38. Young NL, Williams JI, Yoshida KK, Bombardier C, Wright JG. The context of measuring disability: does it matter whether capability or performance is measured? J Clin Epidemiol. 1996;49:1097–101.
39. Ware J, Kosinski M, Dewey J, Gandek B. How to score and interpret single-item health status measures: a manual for users of the SF-8 health survey. Lincoln: QualityMetric Incorporated; 2001.
40. Reeve BB, Hays RD, Bjorner JB, Cook KF, Crane PK, Teresi JA, et al. Psychometric evaluation and calibration of health-related quality of life item banks: plans for the Patient-Reported Outcomes Measurement Information System (PROMIS). Med Care. 2007;45:S22–31.
41. PROMIS: Dynamic tools to measure health outcomes from the patient perspective. Available at: http://www.nihpromis.com/Measures/ domainframework1. Accessed 7 Mar 2017.
42. Stucky BD, Edelen MO, Sherbourne CD, Eberhart NK, Lara M. Developing an item bank and short forms that assess the impact of asthma on quality of life. Respir Med. 2014;108:252–63.
43. Deng N, Allison JJ, Fang HJ, Ash AS, Ware JE. Using the bootstrap to establish statistical significance for relative validity comparisons among patient-reported outcome measures. Health Qual Life Outcomes. 2013;11:89.
44. Efron B. Better bootstrap confidence intervals. J Am Stat Assoc. 1987;82:171–85. 45. Muthén LK, Muthén BO. Mplus User’s Guide. CA: Muthén & Muthén; 1998-2015
46. R Core Team. R: A language and environment for statistical computing. R Foundation for Statistical Computing, Vienna, Austria, 2012. ISBN 3-900051-07-0; 2014.
47. Chalmers RP. mirt: A multidimensional item response theory package for the R environment. J Stat Softw. 2012;48:1–29.
48. Ekstrom C, Ekstrom MC. Package‘MESS’. 2012.
49. Wickham H. ggplot2: elegant graphics for data analysis. New York: Springer Science & Business Media; 2009.
50. Dillman DA, Smyth JD, Christian LM. Internet, phone, mail, and mixed-mode surveys: the tailored design method. Hoboken (NJ): Wiley; 2014.
• We accept pre-submission inquiries
• Our selector tool helps you to find the most relevant journal
• We provide round the clock customer support
• Convenient online submission
• Thorough peer review
• Inclusion in PubMed and all major indexing services • Maximum visibility for your research
Submit your manuscript at www.biomedcentral.com/submit