An Exploration into the “Over the Wall Handling”
Phenomenon of Aid and Development
Supply Chain Systems
Mark Edwards
*,
Lee Styger
Sydney Business School, University of Wollongong, Australia
Copyright©2018 by authors, all rights reserved. Authors agree that this article remains permanently open access under the terms of the Creative Commons Attribution License 4.0 International License
Abstract
This paper provides some insight regarding the causes and implications of waste within Aid and Development programs and the impact on Aid effectiveness. In order to understand this better, a comparative case study analysis of three Aid and Development programs using a systems mapping process was used to identify major constraints within these supply chain systems. This work identified a complex matrix of nodal links within these systems that correspond to the flow of both funding and value creation. The findings point to Aid and Development supply chain systems being a closed loop system where much of the funding can be retained within the system and not distributed to the recipient to the expected level. Importantly this paper discussed a “law” of diminishing returns in Aid and Development programs, where it is identified that the larger the supply chain systems is, the more funding remains within that system and as such, it demonstrates that there are significant overarching constraints limiting the impact and effectiveness of Aid and Development to the end recipient.Keywords
Aid and Development, Quality Improvement, Supply Chain Constraints, Supply Chain Operations Reference, SCOR1. Introduction
The Aid and Development sector has for many years suffered from an axiom of mistrust regarding efficiency and efficacy of many of the sectors programs. The community at large is typically suffering “Aid fatigue” and as such, governments are limiting and often reducing funding to necessary programs. The core concern is based on the transparency of data regarding how much of the initial aid funding actually reaches the end recipient and
how much is retained in the Aid and Development supply chain system. On face value, this should not be a difficult issue to solve, however, the supply chain systems of Aid and Development agencies are often confusing regarding operational flow and are bound in institutional bureaucracy and do not follow a common standard of design or measurement that would be expected in commercial supply chains for example.
By adopting a forensic audit of Aid and Development supply chain systems, we set out to identify the causes of waste and, understand flow and value creation and in so doing identify possible constraints that restrict efficacy and efficiency within these systems. Our research has identified some significant indicators insofar as ten key constraints were identified within Aid and Development supply chain systems that could be eliminated if a common standard such as ISO 9001:2015 or the Supply Chain Operations Reference (SCOR) model were adopted.
1.1. Background and Definition of Aid and Development
Development Assistance (ODA) definition:
“Grants and Loans to countries or territories on the DAC list of ODA recipients and multilateral agencies that are undertaken by the official sector at concessional terms (i.e. with a grant element of at least 25%) and that have the promotion of the economic development and welfare of developing countries as their main objectives in the recipient country as the main objective…” (3) The concept of Aid and Development is not new, formal systematic programs date back to as early as 1812 where the US Congress passed legislation to provide funding and other support for their colonised subjects (4). Early history suggests that few policies or importantly processes were established in early programs. This led to fragmentation within operational terms and also the emergence of, often, conflicting agendas and outcomes (5).
Fragmentation and conflicting objectives appear to have become the norm within the Aid and Development context. This has in turn led to a common belief set that many Aid and Development programs are rife with fraud, corruption and enable “dipping” (i.e. theft) along the way (6, 7 and 8). Indeed studies by Petitt and Beresford (9) for example have suggested that some programs have as high as 30% wastage, thus supporting the accusation of corrupt systems management and all too often calling into question the validity of Aid and Development programs as a means of improving the quality of life for the citizens of developing nations.
There are many different reasons why many Aid and Development programs lack the efficiency that would be generally expected of, for example, more commercial supply systems. It is not the intent of this work to investigate all possible risk and failure nodes within Aid and Development supply chain systems, but rather to take a systems approach (10) to establish and map how Aid and Development programs operate and highlight possible constraints within the nodes and links of these systems. The challenge has been that there is much ambiguity regarding how this is done. There are no common standards, or indeed general recognition for what Aid and Development is in fundamental terms, (i.e. a supply chain system), that could be managed by the same operating principles as those used in commercial supply chain systems and with similar expected outputs in terms of efficiency, transparency and governance.
1.2. Mapping Supply Chain Systems
The principles of commercial supply chain management have long been established in both academic literature and business literature at large. A commercial supply chain system is a large system comprising of smaller systems that work within their own boundaries towards a common goal, the end customer. Typically a supply chain is considered to consist of a series of interlinked nodes that, via logistic activities, add value to a raw material of some kind resulting in a final, finished product for the end customer
(11, 12, 13 and 14). In the context of this work, the end customer (Principal) is defined as the person or entity who puts “new money” or original funding into the system (15) (i.e. the Aid and Development funder).
In traditional commercial supply chain systems mapping, the transfer of value from node to node is often easy to establish from either an end-to-end customer point of view, by following a straight forward investigation process of “what happens before” (i.e. retrospective investigation), or from a raw material side by following a process of “what happens next” (i.e. futuristic investigation). In either instance, the line of inquiry can be mapped as either a flow diagram and/or a time and motion type diagram. Additionally, in both instances of mapping, the values and associated linkages can be established and a model or simulation of the supply chain system produced (16).
There is extensive literature from both academic and business sources that document and describe the typical mapping of a system (17). However, the literature contains little information on mapping a system where the payment for the product or service is not undertaken by the end consumer (such as the aid recipient). As such, supply systems demonstrating this characteristic are considered to be “atypical” in nature, where the consumer (i.e. the recipient of the output of the supply chain system) is not the Principal or funder (18). This scenario is typically more often associated with not-for-profit (NFP) and non-government organisation (NGO) activities.
Drucker (19) established long ago that if a system can be measured then it can be improved. Additionally, the system must be mapped if it is to be measured for improvement to occur. Much work has been conducted to establish robust measurement tools for traditional “commercial” type supply chain systems, such as the SCOR standard (20, 21, 22,). The mapping and recording of commercial supply chain systems was first demonstrated within the manufacturing industry in the 1950’s through Deming’s interconnected and continuous improvement process, the Deming’s view of a Production System (23).
Deming’s model (see Figure 1) has provided the basis for improvement tools developed over time to enable the measurement of value, quality and sustainability in commercial supply chain systems (24, 25, 26). Post the identification of the system (i.e. the supply chain system map) other tools existed to improve the system and/or redesign the system and manage it, for example, Quality Management Systems such as ISO 9001:2015, LEAN, Six Sigma and SCOR (27, 24, 28).
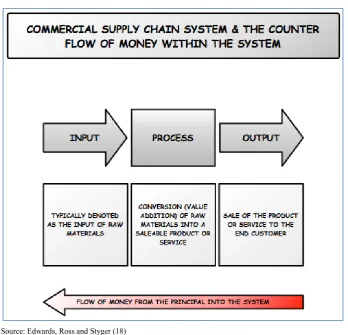
money for the product or service. It is important to note that the new money entering into a commercial supply chain is paid by the recipient of the goods (the end customer) on the provision of the end product (output). Figure 2 illustrates a conceptual commercial supply chain system and the counter flow of money within the System.
Unfortunately, less work has been conducted around the mapping, measuring and improving of humanitarian Aid and Development supply chain systems that are, by their very nature, more complex and containing more variables
due to the plural nature of the products yielded by the system (i.e. the benefit to the Principal and the Recipient). The literature typically outlines the supply from a limited specific point, such as, how many human hours were invested; the measurement of tangible products being shipped between countries; or, the outcome of grant funding, however, the literature does not provide a discussion on the holistic (end-to-end) measurement of the flow of value within the atypical supply chain system (30, 31).
Source: Evans and Lindsay (29)
Figure 1. Deming’s View of a Production System
[image:3.595.72.526.211.372.2]Source: Edwards, Ross and Styger (18)
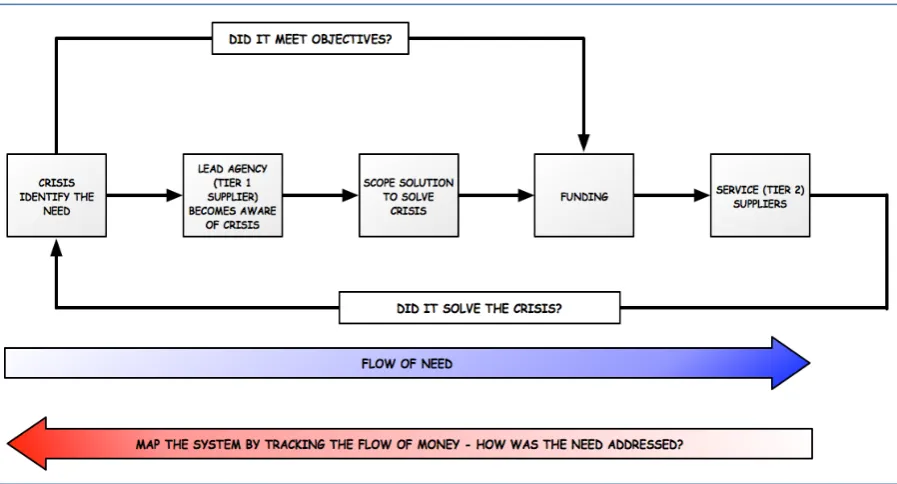
[image:3.595.124.473.397.732.2]Conceptually, the supply chain systems of Aid and Development are typically represented as a linear path from the identification of need or opportunity to an output or deliverable from the system. Although a closed loop of supply is perceived to be present in this supply system, critical interactions and players are not typically identified, because each node represents a destination point within the linear system, rather than a value addition to that system (i.e. from a need/raw material input to finalised output).
Edwards, Ross and Styger (18) provide an illustration of the conceptual linear supply chain system of Aid and Development programs (see Figure 3). The concept of this linear model is that a crisis is identified by the lead agency, who in turn, seek funding from a governing body, when funding is received by the lead agency, second and third tier suppliers are tasked with addressing the crisis (i.e. providing the aid). The measurement of this model typically reports the outcomes of the funding, not the “value for money” attained. The model is reliant on understanding the forward flow of the need, but not systems complexity and the interactions or the hierarchical nature of the nodes within.
2. Methods and Objectives
This research adopted a comparative case study analysis approach because it was necessary to understand the actual networks, nodes and interactions of each case, and map them with the intent of identifying possible constraints within the supply chain systems. Multiple case studies were chosen because it was determined that a single case might demonstrate constraint characteristics through luck not design. Also, by adopting alternative primary
investigation techniques; interviews, documenting investigation from source, documenting investigations historical or third party, triangulation of data would be possible providing gravitas to the findings.
Case study research looks at the dynamics of an organisation, either in its entirety or a portion of it. Veal (32) states that case studies are appropriate for studying one or a limited number of organisations in depth. Case studies are determined to be either geographically or temporarily unique (32). Yin (33), Baxter and Jack (34) and Estrada et al (35) state that if a researcher needs to understand the “how” and the “why” questions of complex events or situations, then the best research method to use is a case study method. A comparative case study method is interested in why the changes recorded in the case occurred (36). Multiple case studies provide strong and reliable data because it is not possible to manipulate the process or events that occur during the life cycle of the case (37).
Case studies are a bounded system that contain interconnected elements that are separated from their environment by a system boundary (38). The boundaries that do exist are typically case related, but within these boundaries are variables (39). Variables could include descriptions of processes, policies or how strategy for example work outside of the boundary. In order to compare cases, good practice could include isolation of a particular variable for analysis, for example the flow of money within a system that are constant across all cases. Due to the nature of this research, non-probabilistic (40) sampling techniques were used. Qualitative research typically exploits judgement sampling techniques where the participants (in this case the case studies) are elected based on the judgemental knowledge of the researcher (41).
[image:4.595.73.522.489.731.2]Source:Edwards, Ross and Styger (18)
Participants were selected based on a demonstrable in depth knowledge, accreditation by proven participation in real world Aid and Development programs. To give the richest possible data set three different lead agencies were selected and three different data sources were used (face-to-face, formal program records, published materials). Sandelowski (42) and Boddy (43) state that saturation is more important than the number of participants in qualitative research. It was therefore not possible to obtain all of the necessary data from a single point of contact or source within the case studies. As such multiple data sources were investigated (as recommended by Voss et al, (44) in each of the lead agencies including, where appropriate, face-to-face interviews, primary and secondary recorded data, third party data such as published commentary and field observation. The programs, key players and rationale for selection are illustrated in Table 1.
Table 1. Sampling of the Programs, Key Players and Rationale for
Selection
Participant
Category Participants No. of Reasons for Selection
Cast Study 1 1 Extensive field work experience Director of a small CSO
Case Study 2 1
To provide any further data that may have been available outside of the secondary data
Case Study 3 1
Provided access to reports from lead agency
Provision of secondary data in the form of a final report
Case Study No.1 was a CSO (Civil Service Organisation) that provide funding and program development for several projects in Vietnam. Case Study 2 was a large water and Sanitation and Hygiene program for UNHDR in Kenya. The project involved installation of latrines, education programs. Case Study 3 was Water, Sanitation and Hygiene program that assisted with the installation of wells and pumps to provide potable drinking water to a large number of villages in two rural areas of Togo.
The first task was to ask the participants to map their supply chain as a benchmark and “stake in the ground”, prior to investigation. This research was not focussed on confirming the axiom of supply within each case study, but to map the actual supply chain system using a constant across all three. A major challenge of this work was establishing a constant within the case studies of supply chain systems that could be tracked, measured and used to identify key nodes within the system. Most mapping methodologies focus on using the product and output of the product in the supply chain system as a constant. As such, within a traditional supply network it is reasonably straight forward to trace the product, even in its raw form, from the point of entry into the system to its point of exit to the end
customer, and therefore making it possible to measure it. This is not, however, often possible within an Aid and Development supply chain system, where the end customer who injects the funding into that system, to initiate the “flow” in that system, is not usually the recipient of the end product produced from that system.
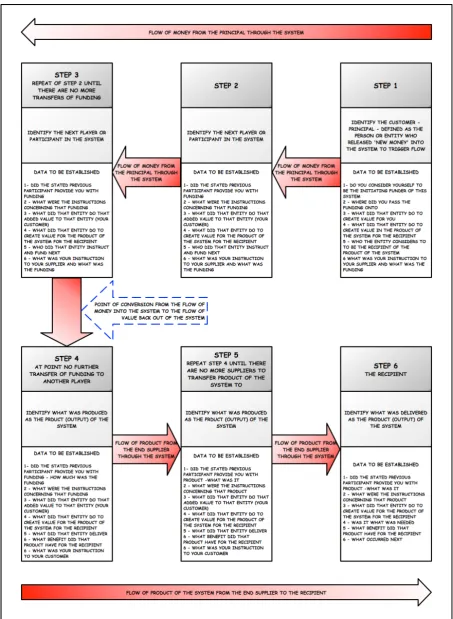
To add more complexity, the constant that is to be mapped to the end customer, is not readily obvious. The duality of the beneficiaries of the supply network, the Principal (funder) and the Recipient of the product or service, do not make obvious the identification of a single constant for the measurement. By adopting Oloruntoba and Gray (15) and Bohme et al (45) and following the principles of forensic accounting (46, 47) and tracking the flow of money and return value creation within the system, from its first point of entry to its final exit, and thereby use the flow of money to identify touch points (nodes) within the supply chain system. Since money triggers supply (15), the lead agencies were considered to be the focal point of the supply chain; however, it was necessary to begin the mapping process with the entry of new money into the system. As a result, lead agencies signposted the researchers to the principal funder of the system. Once this had been established and to elicit these responses from the Principal (i.e. provider of new funding in the system) and consecutive stakeholders in the process, questions were posed regarding:
• Who the Principal passed the funding to next in the system
• What the entity did to add value for the Principal • What the entity did to add value into the product
(output of the system) for the recipient
• Why they, the recipient is considered to be the recipient of the output of the system that the Principal has triggered. This latter point provided a cross reference to establish if there was consistency of purpose between nodes (“players”) in the atypical supply chain system
• What was the instruction to the next in line (i.e. the supplier) and how much of the funding was transferred
Source: Edwards, Ross and Styger (18)
[image:6.595.71.525.76.696.2]The research methods are discussed below:
Interviews - Are clearly associated with qualitative research (48, 49, 50, 51, 52). Individual interviews were conducted with key players at each stage of the supply chain system and in the case of Case Study 1 with key players of the lead agency. Notes were taken during all interviews. Interviews for case study 2 & 3 were difficult as key players either had moved on to other projects and contact details were not available or had left the industry. Documents - Primary and secondary documents were investigated in the case of the Case Study 2 rural water supply and sanitation project (53). This included access to the final program report and several country specific reports. In Case Study 3, Kenya access was given to progress reports. These reports were submitted quarterly, half yearly and annually. In theses reports were financial data and percentage complete reports. In the case of both programs, third party data was examined. In the context of the work, primary data is determined to be the original records relating directly to the program and secondary data is determined to be material such as, newspaper articles related to the case in question, sector or government reports, websites and media reports.
Field observation - For Case Study 1, field observations were conducted throughout the supply chain system. In Case Study 3, Kenya field observations were conducted within the lead agency
The data collection strategy was intended to provide as much variation as possible without unbalancing the data represented in the case studies. Table 2 illustrates the proportion of data collected per case.
Table 2. Illustration of the Proportion of Data Collected per Case Study
Data as a
percentage Case Study 1 Case Study 2 Case Study 3
Interviews 20 0 20
Documents
Primary 5 75 60
Documents
Secondary 0 25 20
Field 75 0 0
2.1. The Creation of a First Generation Theoretical Model of an Aid and Development Supply Chain Systems Map
Once the convention for mapping the supply chain systems of the case studies had been established, the actual final maps generated from the analysis illustrated some similar nodes and players in each of the supply chain systems. The similarity found in the case studies is encouraging because:
• Key nodes are present within the case studies • Key nodal links connect the nodes in similar pattern • It confirms a logical and consistent flow mapped
against theoretical principles of supply chain management
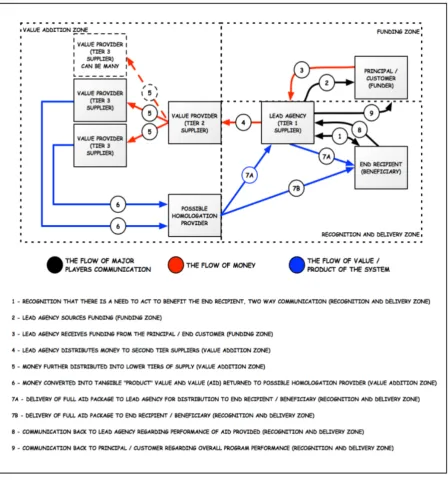
As such, it is possible to establish a conceptual model of an Aid and Development supply chain system based on an aggregation of the case study maps. The conceptual supply chain system map is illustrated in Figure 5.
2.2. Challenges Faced During the Research
Four main challenges were present during the research process, these were:
Common language - The language of commercial supply chain management and principles differ greatly to that of Aid and Development program managers. As such, finding commonality of terms (translation of local enculturated language) was somewhat challenging at times
Accurate record keeping - Whereas it might be reasonably assumed that the record keeping within an Aid and Development project would be thorough and accurate. It was found that different objectives and styles of management reporting generated different records that often did not correspond well to the supply chain system under investigation
Longevity of staff - There appeared to be consistent “churn” in the staff members of each case. The result was that institutional memory and learning was lacking and with it the wise interpretation of the events at the time
Figure 5. The Conceptual Aid and Development Supply Chain Systems Model1
[image:8.595.76.525.77.558.2]
3. Results
3.1. Findings of the Research
During the early stages of the work, it became quickly apparent that the management of the system of Aid and Development programs did not conform to recognised standards such as ISO 9001:2015: or those by APICS2 for
example. Also, collateral data collected during the research indicated that managers involved in Aid and Development systems management were typically more focussed on nebulous measurements in terms of “good works” rather than the efficiency of the system. Those involved in Aid and Development systems management typically focussed their effort and measured their performance in terms of shared value, community impact and benefit to the recipient of the work. This is in direct conflict with more typical performance measures generally quoted in the literature for commercial supply chain systems managers who measure end-to-end collaboration, efficiency, waste/cost reduction and benefit to the corporation or shareholder in terms of retained profit at the focal node (54). One area that was outside of the scope of this study related to measuring the service level of an aid initiative. It should be possible to measure the service level by using SCOR that can deliver a series of of performance metrics that provide an international benchmark of overall performance and service level of and Aid and Development supply chain.
The supply chain system mapping of these three case studies highlighted ten key constraints, these are:
• Linear process thinking • Over the wall handling • Lack of evidential players
• Multi participation - “multiple personalities in the same corporate body”
• Dual funding from a single source - “double bubble funding”
• Limited end-to-end visibility • Limited end-to-end communication • Trust based system
• Funding and tangible value imbalance
• Classical models of supply do not align with Aid and Development supply chain systems
3.1.1. Linear Process Thinking
All three cases studies, when first investigated, either demonstrated or recorded a linear process stream where one action by a player was passed onto the next player for further attention. The linear process mapping did not reflect the complexity of any of the case study supply chain systems, but all of the process maps were used to report
2 APICS (formerly known as the American Production and Inventory Control Society) merged with the Supply Chain Council in 2014
outcomes of the programs. 3.1.2. Over the Wall Handling
All of the case studies demonstrated a system of “passing down the line” or “over the wall handling” whereby a player in the supply chain system would move the funding or value forward with little evidence of quality assurance or governance happening pre or post the handover.
3.1.3. Lack of Evidential Players
All of the case studies demonstrated gaps in the evidence regarding, often significant elements of the supply chain system. The lack of evidence also, in the cases of Case Study 1 and Case Study 2 included no direct feed back to the focal node from the recipients. This once again raises quality assurance and governance issues.
3.1.4. Multi Participation - Multiple Personalities in the Same Corporate Body
Case Study 2 and Case Study 3 demonstrate multi-participation in their supply chain networks. In effect the same players turned up in multiple places within the system. On one hand it may be argued that this muli-participation could improve the efficiency of the system, it does however raise questions regarding the overriding rationale for the system. For example, is the system there to serve the recipient or is it there to serve the key players? Whatever rationale is correct, it does raise questions regarding governance, value and efficacy of the system and as the system gets larger forcing more bureaucracy to manage it, ultimately leading to a ‘self licking ice cream3 where the recipient becomes less and
less central to the system and the system exists to serve itself.
3.1.5. Duel Funding From a Single Source - Double Bubble Funding
The Case Study 2 mapping highlighted that it was likely that a government funding body funded the same project via two different “Principals”. Although there is no direct evidence, secondary sources indicate that there is a possibility that the same funding source could also have funded the third node within this system directly resulting in a triple funding scenario. This double funding raises issues around governance and legitimacy of the supply chain system. Moreover efficacy and value of the Principal must be questionable, because of the number of times the funding changes hands within the system.
3.1.6. Limited End-To-End Visibility
All of the focal nodes, from each of the cases studies, demonstrated limited end-to-end visibility within their supply chain systems. Typically visibility was limited to the next player in the “flow” or chain. This low level of visibility is contrary to best supply chain management principles (55) and of itself involves risk within the system. 3.1.7. Limited End-to-End Communication
There was no evidence that any of the focal nodes demonstrated end-to-end communication within their supply chain systems. Typically communication was based on point-to-point with the next player in the flow. This principal of communication is contrary to best supply chain management principles (56) and of itself represents a risk propagator in the supply chain system.
3.1.8. Trust Based System
All of the case studies appeared to rely on trust or faith that the next player in the system was present, legitimate, operational and capable of delivering. There was no evidence of auditing, or quality assurance within these supply chain systems and this is once again contrary to the APICS standard for example.
3.1.9. Funding and Tangible Value Imbalance
Each of the systems demonstrated an imbalance within the number of players forwarding funds and those forwarding tangible value. The larger the supply chain system the more imbalance there appeared to be, as the focal node became further removed from the Recipient. This calls into question the optimum design or planning of the supply chain system, its efficiency and latent risk profile.
3.1.10. Classical Models of the Supply Chain Do Not Align with Aid and Development Supply Cain Systems As originally described and documented during the research process, all of the case studies demonstrated a mix of suppliers and customers along the value flow. This is contrary to supply chain theory that places customers on the customer side of the supply chain map and suppliers on the supply side of the supply chain map. Since Aid and Development maps do not appear to follow this convention, it might well be argued that they are indeed not supply chains at all and as such commercial supply chain operating standards would not apply. However, by reconfiguring the maps to conform to the fundamental principles of supply chain mapping and to have both suppliers and customers positioned on their “correct sides” of the focal node, it was still possible to follow the flow of funding and return flow of tangible value within each program. Furthermore, the “U” shaped map also illustrated clearly duplication of players, lack of evidential players, lack of feedback etc. as discussed above. As such the exercise has demonstrated positively that Aid and
Development supply chain systems do indeed follow similar characteristics as commercial supply chain systems, especially in the critical area of customer and supplier concepts around a focal node.
3.2. Validity and Implication of the System
The validity questions concerning Aid and Development programs in general are further exacerbated by suggestions that many Aid and Development agencies are inefficient in their management and distribution of funding and/or self-serving in terms of the amount of funding retained within the Aid agency and its program partners. Walker (57) attempts to illustrate the overhead and retained costs for organisations involved in Aid and Development programs, but admits that is difficult to gain an accurate picture of these costs. Published overhead and retained costs include: • Retained costs between 3% - 15% of program value
per supply chain system node (57)
• Administration costs between 5.7 and 6.1% (58). The Australian Federal Government cap the administration costs at 10% per program (59)
• Evaluation costs 5% (60)
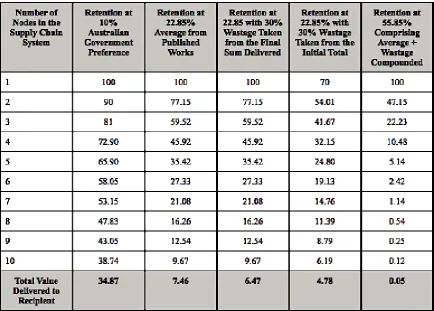
Assuming that the values noted above are representative of the sector, the average percentage of the overhead and retained costs is 22.85% 4 of the total Aid and
Development program value. Importantly, this figure could represent the extraction value at each node in the supply chain system (57) suggesting that:
A law of diminishing impact exists regarding actual recipient value as a percentage of program value, compared to the size of the Aid and Development supply chain system that exists to serve the program (Authors) This observation has profound implications regarding the effectiveness, efficacy and governance of Aid and Development programs, and of itself warrants further research. It is important to consider what the result of this law of diminishing impact could be to the recipient of an Aid and Development program. Table 3 provides a calculation and comparison of retained funding in Aid and Development programs based on 100 units of input at Node 1.
Table 3. Calculation and Comparison of Retained Funding in Aid and Development Programs Based on 100 units of Input at Node 1
4. Discussion
4.1. Implications and the Development of Further Hypothesis
Three key observations are made from this data, these are:
• The smaller the number of nodes in an Aid and Development supply chain system, the more output is available to the recipient. For example, if a five node supply chain system is assumed then approximately double the amount of output is indicated if a 10% (best case and as preferred by the Australian government) retention is present in the supply chain system. If the worst case option is taken, then an order of magnitude improvement is made to the output to the recipient based on a five node supply chain system compared to a 10 node supply chain system.
• Aid and Development supply chain systems can be configured to best serve themselves by extending the number of nodes within the supply chain system and ensuring that as many nodes as possible are under the ownership of the focal node. In other words, it can be financially beneficial for an Aid agency to have a supply chain system that is indeed designed as a “self-licking ice cream” or closed loop system
requiring only an input of funding and a minimal output of Aid to ensure sustainability of the system. • More efficient, transparent and standard operating
[image:11.595.81.516.101.412.2]community) that of itself drives “Aid fatigue” (6) resulting in less giving in real terms and the need to increase the price of Aid and Development programs. In other words, a paradox exists where Aid agencies are in terminal decline and cannot survive without an increase in price (i.e. retention of funding), but any increase in the price (i.e. retention of funding) would trigger the terminal decline of the Aid agency.
Jaggi (63) further expands the concept of Cost Stickiness in terms of suggesting that frequent price adjustments can alienate customers. This poses a second intriguing hypothesis suggesting that it would be better to maintain a continuous flow of funding into Aid agencies rather than continuing to have competitive funding rounds commonly associated with NGO programs. In so doing, an equilibrium of “fairness” in the eyes of the funders could be maintained, because continuity of funding should lead to less money being retained within the Aid and Development supply chain system as a buffer or reserve fund. For example, Aid agencies in the United States can by law set aside up to a minimum of 3 months of reserve funds, or 25% of a nonprofit’s operating cost, that they can draw on for operational expenses up to a maximum of 2 years (64, 65).
Kun, Guoxin and Chen (66), Montazemi, Pittaway, Saremi and Wei (67) and Szulanski (68), open a further hypothesis by discussing knowledge stickiness and the barriers and costs of sharing and transferring knowledge within a working or social environment. This concept has significant implications in the context of the cyclic nature of funding of Aid and Development programs, the staff associated with such programs and therefore knowledge retention in the supply chain systems. As such, a hypothesis emerges that the retention of money in Aid and Development supply chain systems could be in part attributed to the cost of re-learning old, lost, knowledge as new supply chain systems team players and new orgaisations are introduced into the supply chain system for the next program of work from the next round of funding.
4.2. The Need for an Encompassing International Standard for Aid and Development Programs There is still much conjecture regarding Aid and Development efficiency, efficacy and transparency and as such, there is a need for convergence of operating processes of Aid agencies under one common standard. An argument could be made for a bespoke quality standard to be developed specifically for Aid and Development, however, ISO 9001:2015 and associated "family of standards”, certainly covers all of the necessary nominative clauses for managing and continually improving Aid and Development supply chain systems. Perhaps more specifically, the SCOR standard (56) as the recognised “gold standard” for commercial supply chain systems management and improvement could represent a strong
contender because of its focus on end-to-end configuration and value creation within a supply chain context (i.e. a more outward facing standard).
5. Conclusions
Based on the current body of evidence, it is not surprising that waste and operational inefficiency are at epidemic proportions in some Aid and Development supply chain systems, but it is difficult to determine because the supply chain systems of Aid agencies are often wrapped up in a myriad of individual and enculturated operating systems, confusing and often contradictory mission and vision statements, multiple international accounting standards and replication of a single aid agency in multiple controlling positions within the supply chain system. If the operation of aid and development supply chains are chaotic in their overall performance, then it is possible that this is a reflection of managerial competences that affect the efficiency in the performance and output of a project because of issues such as transparency, trust, reporting and the way risk along the supply chain is managed.
We identified ten constraints and the impact of constraints and waste in Aid and Development supply chain systems and offered some hypothesis around the implications. It leads us to conclude that there is a need for a common International standard, but think it’s madness to develop something from the ground up when robust standards already exist in the form of ISO 9001:2015 and SCOR. We would adopt SCOR due to the focus on end-to-end supply chain configuration and improvement and its imbedded openness to a common and transparent audit process throughout the entire, holistic, supply chain system.
REFERENCES
[1] Sen, A. (2001). Development as Freedom, Oxford University Press, Oxford, UK.
[2] Commonwealth of Australia. (2012). Helping the World’s Poor Through Effective Aid: Australia’s Comprehensive Aid Policy Framework to 2015-16, <http://dfat.gov.au/abou t-us/publications/Documents/capf.pdf>.
[3] OECD. (2011). The OECD at 50: Development co-operation past present and future. OECD Publishing, <http://www.oecd-ilibrary.org/development/development-c o-operation-report-2011_dcr-2011-en>.
_and_Allocation/links/004635214853f2d2a7000000/Surve y-of-Foreign-Aid-History-Trends-and-Allocation.pdf>. [5] Picciotto, R. (2007). Development Effectiveness at the
Country Level, UNU-Wider, Research Paper No. 2007/81, <https://www.wider.unu.edu/sites/default/files/rp2007-81.p df>.
[6] White, H. (2007). Evaluating Aid Impact. UNU-Wider, Helsinki, Finland. Research Paper 2007/75, <https://www. wider.unu.edu/sites/default/files/rp2007-75.pdf>.
[7] Overstreet, R.E., Hall D,, Hanna, J.B., and Rainer Jr, R.K. (2011). Research in humanitarian logistics, Journal of Humanitarian Logistics and Supply Chain Management. 1, 2, 114–131.
[8] Burnley, J. (2010). 21st Century Aid: Recognising Success and tackling failure. Oxfam International. 137 Oxfam briefing paper. 20th May, <https://www.oxfam.org/sites/w ww.oxfam.org/files/bp137-21st-century-aid.pdf>.
[9] Pettit, S and Beresford, A (2009). Critical success factors in the context of humanitarian aid and supply chains,
International Journal of Physical Distribution & Logistics Management, 39, 6, 450-468.
[10]Caddy, I.N., and Helou, M.M. (2007). Supply chains and their management: application of general systems theory. Journal and Retailing and Consumer Services, 14, 5, 319– 327.
[11]Plenert G.J., (2014). Supply chain optimization through segmentation and analytics, CRC Press Taylor & Francis Group, Florida, U.S.A.
[12]Christopher M. (2016). Logistics and Supply Chain Management, Pearson, UK.
[13]Barber, E. (2008). How to measure the “value” in value chains. International Journal of Physical Distribution & Logistics Management, 38, 9, 685–698.
[14]Hines, T. (2006). Supply chain strategies: customer-driven and customer-focused. Butterworth-Heinemann, Oxford, U.S.A.
[15]Oloruntoba, R., and Gray, R. (2009). Customer service in emergency relief chains. International Journal of Physical Distribution & Logistics Management, 39, 6, 496–505. [16]Gardner J.T., and Cooper M.C. (2003). Strategic supply
chain mapping approaches. Journal of Business Logistics, 24, 2, 37–64.
[17]Touboulic, A., and Walker, H. (2015) Theories in sustainable supply chain management: a structured literature review. International Journal of Physical Distribution & Logistics Management, 45, 1/2, 16–42.
[18]Edwards, M., Ross P.J., and Styger, L.E.J. (2018). A pilot study into mapping atypical supply networks. Universal Journal of Educational Research, 6, 10, 2217-2226.
[19]Drucker P.F. (1959) Long-range planning - challenge to management science. Management Science, 5, 3, 238–249. [20]Akyuz, G.A., and Erkan T.E. (2010). Supply chain
performance measurement: a literature review. International Journal of Production Research, 48, 17, 5137–5155.
[21]Thunberg, M., and Persson, F. (2014). Using the SCOR model performance measurements to improve construction logistics. Production Planning & Control, 25, 13-14, 1065– 1078.
[22]Balfaqih, H., Nopiah, M.Z., Saibani, N., and Al-Nory, M.T. (2016). Review of supply chain performance measurement systems: 1998-2015. Computers in Industry, 82, 135–150. [23]Deming, W.E. (1986). Out of the Crisis. Massachusetts
Institute of Technology, Centre for Advanced Engineering Study, Cambridge, Massachusetts.
[24]Bolstorff, P., and Rosenbaum, R. (2003). Supply chain excellence: A handbook for dramatic improvement using the SCOR model, 2nd edn., AMACOM American Management Association, New York.
[25]Knouse, S.B,, Carson, P.P,, Carson, K.D., and Heady R. (2009). Improve constantly and forever: the influence of W.Edwards Deming into the 21st century. The TQM Journal, 21, 5, 449–461.
[26]Habib, M., and Jungthirapanich, C. (2010). An empirical Study of Educational Supply Chain Management for the Universities, In INFORMS International Conference on Industrial Engineering and Operations Management, Dhaka, Bangladesh, January 9 – 10, 2010, <http://www.iieom.org/ paper/Final%20Paper%20for%20PDF/185%20Mamun%20 Habib.pdf>.
[27]Goldratt, E., Cox, J. (2013). The Goal, Ashgate Publishing Limited, Surrey, England.
[28]Abuhav, I. (2017). ISO 9001 : 2015 - A Complete Guide to Quality Management Systems, CRC Press, Boca Raton. [29]Evans J .R., Lindsay, W. M. (2011). The Management and
Control of Quality, South-Western, Cengage Learning, Ohio.
[30]Australian Research Council, Excellence in Research for Australia 2012, National Report, Australian Government. <http://archive.arc.gov.au/archive_files/ERA/2012/National %20Report/ERA-2012-National-Report_Accessible-pdf_IS BNupdateJan13.pdf>.
[31]USAID. (2008) External Program Evaluation Water, Sanitation and Hygiene (WASH) Program In Ethiopia - Final Report. USAID, <http://pdf.usaid.gov/pdf_docs/Pdac p437.pdf >.
[32]Veal, A.J., (2005) Business Research Methods, 2nd edn. Pearson Addison Wesley, Frenchs Forest, Australia. [33]Yin, R.K., (2009) Case study research: design and methods.
Sage publications, Thousand Oaks, California.
[34]Baxter, P., and Jack, S. (2008). Qualitative case study methodology: study design and implementation for novice researchers. The Qualitative Report, 13, 4, 544–559. [35]Estrada, I., Faems, D., Cruz, N.M., and Santana, P.P. (2016).
The role of interpartner dissimilarities in industry-university alliances: insights from a comparative study. Research Policy, 45, 2008–2022.
[37]Quinlan, K.M., Male, S., Baillie, C., Stamboulis, A., Fill, J., and Jaffer, Z. (2013). Methodological challenges in researching threshold concepts: a comparative analysis of three projects, Higher Education, 66, 585–601.
[38]Barth, M., and Thomas, I. (2012). Synthesising case-study research - ready for the next step?. Environmental Education Research, 18, 6, 751–764.
[39]Goodrich, D. (2014). Comparative Case Studies, Methodological Briefs: Impact Evaluation 9, UNICEF Office of Research, Florence, Italy.
[40]Baker, R., Brick, J.M., Bates, N., Battaglia, M., Couper, M., Dever, J.A., Gille, K.J., and Tourangeau, R. (2013). Summary report of the AAPOR task force on non-probability sampling. Journal of Survey Statistics and Methodology, 1, 90–143.
[41]Sekaran, U., and Sekaran, U. (1992). Research methods for business: a skill-building approach, Wiley, New York, NY. [42]Sandelowski, M. (1995). Focus on qualitative methods:
sample size in qualitative research. Research in Nursing & Health, 18, 179-183.
[43]Boddy, C.L. (2016). Sample size for qualitative research. Qualitative Market Research: An International Journal, 19, 4, 426–432.
[44]Voss, C., Tsikriktsis, N., and Fröhlich, M. (2002). Case research in operations management. International journal of Operations & Production Management, 22, 2, 195–219. [45]Bohme, T., Williams, S.J., Childerhouse, P., Deakins, E.,
and Towill, D. (2013). Methodology challenges associated with benchmarking healthcare supply chains’, Production, Planning & Control: The Management of Operations, 24, 10/11, 1002–1014.
[46]Pedneault, S., Sheets, M., and Rudewicz, F. (2012). Forensic accounting and fraud investigation for non-experts, John Wiley and Sons Incorporated, Hoboken, New Jersey. [47]Dorrell, D.D., and Gadawski, G.A. (2012). Financial
Forensics Body of Knowledge, John Wiley & Sons Incorporated, Hoboken, New Jersey.
[48]Basch, C.E. (1987) Focus group interview: An underutilized research technique for improving theory and practice in health education. Health Education Quarterly, 14, 4, 411– 448.
[49]Lechuga, V.M. (2012). Exploring culture from a distance: the utility of telephone interviews in qualitative research. International Journal of Qualitative Research in Education, 25, 3, 251–268.
[50]Carter, N., Bryant-Lukosius, D., DiCenso, A., Blythe, J., and Neville, A.J. (2014). The use of triangulation in qualitative research. Oncology Nursing Forum, 41, 5, 545–547. [51]Cleary, M., Horsfall, J., and Hayter, M. (2014). Data
collection and sampling in qualitative research: does size matter?. Journal of Advanced Nursing, 70, 3, 473–475. [52]Blandford, A. (2013) Semi-structured qualitative studies. In:
Soegaard, Mads and Dam, Rikke Friis (eds.), The Encyclopedia of Human-Computer Interaction, 2nd edn.,
Aarhus, Denmark: The Interaction Design Foundation, <http://www.interactiondesign.org/encyclopedia/semi-struc
tured_qualitative_studies.html>.
[53]Roark P., Aubel J., Hodin K., Kankarti O., and Mafra, T. (1988). Final Evaluation of the USAID/Togo Rural Water Supply and Sanitation Program. Water and Sanitation for Health Project. Office of Health, Bureau for Science and Technology, US Agency for International Development, Washington DC, <http://pdf.usaid.gov/pdf_docs/PDAAX8 01.pdf>.
[54]Georgise, F.B., Thoben, K-D., and Seifort, M. (2012). Adapting the SCOR model to suit the different scenarios: a literature review & research agenda. International Journal of Business and Management. 7, 6, 2–17.
[55]Busse, C., Schlepper, M.C., Weilmann, J., and Wagner, S.M. (2017). Extending the supply chain visibility boundary: utilizing stakeholders for identifying supply chain sustainability risks. International Journal of Physical Distribution & Logistics Management, 47, 1, 18–40. [56]APICS. (2017). SCOR - Supply Chain Operations Reference
Model Version 12.0, APICS. <http://www.apics.org/docs/d efault-source/scc/scor-v12-0-digital-download.pdf?sfvrsn= 6>.
[57]Walker, P., and Pepper, K. (2007). Follow the money: a review and analysis of the state of humanitarian funding. Tufts University Feinstein International Center, 2017, <https://pdfs.semanticscholar.org/1d83/04ebd8909ec39d80 8058c40a7ddcf4e6ac3c.pdf>.
[58]Nunnenkamp, P., and Ohler, H. (2012). Funding, competition and the efficiency of NGO’s: an empirical analysis of non-charitable expenditure of US NGOs engaged in foreign aid. Kyklos, 65, 1, 81–110.
[59]Department of Foreign Affairs and Trade (2016). Australian NGO Cooperation Program Manual. Commonwealth of Australia, Australian Government Department of Foreign Affairs and Trade,http://dfat.gov.au/about-us/publications/Pages /australian-ngo-cooperation-program-manual.aspx;'
[60]Werker, E., and Ahmed, F.Z. (2007). What do nongovernmental organizations do?. The Journal of Economic Perspectives, 22, 2, 73–92
[61]Anderson, A., Jaimovich, N., and Simester, D. (2015). Price stickiness: empirical evidence of the menu cost channel. The Review of Economics and Statistics, 97, 4, 813–826. [62]Dutta.S., Taprak, A., and Grewal, D. (2017). Fairness
perceptions of retail price increases by foreign and domestic brands: The roles of ethnocentric beliefs, profit stickiness, and contextual information, Journal of Business Research, 75, 37–45.
[63]Jaggi, A. (1994). Five sources of price stickiness: an empirical investigation. Eastern Economic Journal, 20, 2, 187–199.
[64]Sloan, M.F., Charles, C., and Kim, M. (2016). Nonprofit leader perceptions of operating reserves and their substitutes. Nonprofit Management and Leadership, 26, 4, 417–433. [65]The Urban Institute. (2016). The nonprofit operating reserve
framework of the knowledge stickiness of distributed innovation. Proceedings of the 10th International Conference on Innovation & Management/ Wang Yingming, Assoc. Ed. Ye Jianmu—Wuhan: Wuhan University of Technology Press,http://www.pucsp.br/icim/ingles/downlo ads/Proceedings-China-of-ICIM2013.pdf.
[67]Montazemi, A.R., Pittaway, J.J., Saremi, H.Q., and Wei, Y. (2012) Factors of stickiness in transfers of know-how between MNC units. Journal of Strategic Information Systems,21, 31–57.