Supporting Visual Diagnosis of
Performance Problems in Multi-Core and
Parallel Software
Roman Atachiants
Thesis submitted for the Degree of Doctor of Philosophy
School of Computer Science & Statistics
Trinity College
University of Dublin
Declaration
I declare that this thesis has not been submitted as
an exercise for a degree at this or any other
uni-versity and it is entirely my own work. Wherever
there is published or unpublished work included,
it is duly acknowledged in the text.
I agree to deposit this thesis in the University’s open
access institutional repository or allow the library
to do so on my behalf, subject to Irish Copyright
Legislation and Trinity College Library conditions
Abstract
The shift towards multicore processing has led to a much wider population of
de-velopers being faced with the challenge of exploiting parallel cores to improve
soft-ware performance. Debugging and optimising parallel programs is a complex and
demanding task. Tools which support development of parallel programs should
pro-vide salient information to allow programmers of multicore systems to diagnose and
distinguish performance problems. Appropriate design of such tools requires a
sys-tematic analysis of the problems which might be identified, and the information used
to diagnose them.
In this dissertation we present a general framework aimed to support designers of
parallel performance analysis tools. The framework consists of several major
compo-nents including: general advice for tool developers, a parallel performance problem
taxonomy, an observational model for “data-to-problem” mapping, a deeper analysis
of a data locality problem identification and a visualisation tool which we have used
to evaluate the effectiveness of the approach.
First, with the aim of identifying issues, emerging practices and design
oppor-tunities for support, we present in this dissertation a qualitative study in which we
interviewed a range of software developers, in both industry and academia. We then
perform a systematic analysis of the data and identify several cross-cutting themes.
These analysis themes include the practical relevance of the probe effect, the
signif-icance of orchestration models in development and the mismatch between currently
available tools and developers’ needs. We also identify an important characteristic of
parallel programming, where the process of optimisation goes hand in hand with the
process of debugging, as opposed to clearer distinctions which may be made in
tra-ditional programming. We conclude with reflection on how the study can inform the
program-ming.
Next, building on the literature, we put forward a potential taxonomy of parallel
performance problems, and an observational model which links measurable
perfor-mance data to these problems. We present a validation of this model carried out with
parallel programming experts, identifying areas of agreement and disagreement. This
is accompanied with a survey of the prevalence of these problems in software
devel-opment. From this we can identify contentious areas worthy of further exploration,
as well as those with high prevalence and strong agreement, which are natural
candi-dates for initial moves towards better tool support.
Finally, in order to explore the design space and how the framework can be used
in the design of visualisations to support performance optimisation, the specific case
of data locality is examined in more detail, and a prototype visualisation to support
the diagnosis of data locality problems is introduced. Furthermore, an empirical
eval-uation of the visualisation was performed and the results are discussed as we reflect
Dedication
Dedicated to the memory of my teacher, advisor,
col-league and dear friend, Bernard Tollet (1973-2015) who
inspired, supported and encouraged me to pursue the
Acknowledgements
Immeasurable appreciation and deepest gratitude for the help and support are
ex-tended to the following persons, who in one way or another have contributed in
mak-ing this study possible.
First and foremost I would like express my sincere gratitude to my research
ad-visor and HCI specialist, Dr. Gavin Doherty for the continuous support throughout
my Ph.D study as well as his patience, motivation, and enthusiasm. His continuous
support and guidance helped me not only complete this dissertation but also deepen
my knowledge of Human Computer Interaction. I could not have asked for a better
research advisor.
Besides my research advisor, I would like to thank Dr. David Gregg whose domain
expertise in Computer Architecture has proven to be an invaluable asset and made this
study possible. He has always been there to listen and give advice.
I would like to thank LERO, IBM Research and Science Foundation Ireland for
pro-viding me with an opportunity to pursue my Ph.D. I extend thanks to my fellow lab
mates, especially to my dear friend Oscar Cassetti and Drs. Erwan Moreau, Stephan
Schl ¨ogl, B´erenger Arnaud, Kim Jarvis, Liliana Mamani Sanchez for their help and
en-couragement.
This study would not be possible without over one hundred participants who took
part in multiple experiments. Their time and insights were indispensable for
complet-ing the study.
I extend my gratitude to Dr. Marco La Civita, Prof. Mikhail Kosov and Prof.
Ed-uard Hoenkamp for their letters of recommendation which allowed me to enrol in the
Ph.D in the first place, and who also inspired me and encouraged me to continue my
studies.
reassurance, her proof reading skills and excellent cooking ability. Her support helped
me to stay sane and focused.
In addition, I would like to thank my family: Tatiana, Ruslan and my young
Related Publications
• Roman Atachiants, David Gregg, Kim Jarvis, and Gavin Doherty. 2014. Design
considerations for parallel performance tools. In Proceedings of the SIGCHI
Con-ference on Human Factors in Computing Systems (CHI ’14). ACM, New York, NY,
USA, 2501-2510. DOI:10.1145/2556288.2557350.Honorable Mention Award.
• Roman Atachiants, David Gregg and Gavin Doherty. 2015. An Observational
Model for Identifying Parallel Performance Problems. IEEE Transactions on
Soft-ware Engineering (TSE).Under Revision.
• Roman Atachiants, David Gregg and Gavin Doherty. Visualising Data Locality
Contents
1 Introduction 1
1.1 Microprocessor Evolution . . . 1
1.2 Parallel Programming . . . 3
1.3 Addressing the Challenges . . . 6
2 Related Work 10 2.1 Empirical Software Engineering . . . 10
2.2 Parallel Performance Analysis Tools . . . 14
2.3 Software Visualisation . . . 17
2.4 Existing Tools . . . 23
2.4.1 Tools from Hardware Manufacturers . . . 23
2.4.2 Generic Operating System Tools . . . 25
2.4.3 Concurrency Visualisation Tools . . . 27
2.4.4 Platform-Specific Profilers . . . 28
2.4.5 Hybrid CPU/GPU Profilers . . . 30
2.5 Concluding Remarks . . . 32
3 Research Overview 34 3.1 Research Questions . . . 36
3.2 Understanding the Programmer . . . 37
3.3 Modelling the Diagnosis . . . 39
3.4 Visualising the Performance . . . 41
4 Understanding the Programmer 43 4.1 Methodology . . . 43
CONTENTS
4.3 Themes, Categories and Codes . . . 48
4.4 Developing parallel software . . . 57
4.4.1 Context for development . . . 57
4.4.2 Understanding . . . 58
4.4.3 Orchestration . . . 63
4.5 Discussion . . . 68
4.6 Concluding Remarks . . . 72
5 Modelling the Diagnosis 74 5.1 Problem Taxonomy . . . 75
5.1.1 Scope of taxonomy . . . 77
5.1.2 A Taxonomy of Parallel Performance Problems . . . 80
5.1.3 Problem Importance . . . 92
5.2 Problems in the Wild . . . 93
5.2.1 Methodology . . . 94
5.2.2 Results . . . 95
5.3 Observational Model . . . 98
5.3.1 Cross-Validation . . . 99
5.4 Discussion . . . 102
5.4.1 Familiar and Frequent Problems . . . 105
5.4.2 Less-Known but Frequent . . . 108
5.4.3 Less-known and Infrequent . . . 112
5.4.4 Threats to Validity . . . 113
5.4.5 Model Applications . . . 114
5.5 Concluding Remarks . . . 116
6 Analysing Data Locality 118 6.1 CPU, Memory and Caches . . . 118
6.2 Applying the Observational Model . . . 122
6.3 Diagnosis Process . . . 125
6.4 Data Collection . . . 128
6.5 Measuring the Performance Impact . . . 129
CONTENTS
6.5.2 Lost Cycles . . . 133
6.6 Data Modelling . . . 136
6.7 Data Processing System . . . 139
6.8 Concluding Remarks . . . 142
7 Visualising the Performance 144 7.1 visualisations to Support Data Locality Analysis . . . 144
7.1.1 Greenlight View . . . 146
7.1.2 Timeline View . . . 146
7.1.3 Thread View . . . 147
7.2 Experimental Design . . . 148
7.2.1 Research Questions and Potential Formats . . . 148
7.2.2 Methodology . . . 151
7.2.3 Tasks . . . 155
7.3 Results . . . 163
7.4 Qualitative Analysis and Discussion . . . 166
7.4.1 Limitations . . . 169
7.5 Concluding Remarks . . . 170
List of Tables
1.1 The evolution of Intel processors in the past 35 years. . . 3
4.1 A table of participants with their years of experience, main activity and
the type of organisation. . . 44
4.2 A non-exhaustive set of techniques for understanding and the
percent-age of interviewees who were talking about the subject. . . 59
4.3 A non-exhaustive set of orchestration models and the percentage of
in-terviewees who were talking about the subject. . . 64
5.1 Taxonomy of parallel performance problems. . . 80
5.2 Familiarity and frequency for performance problems. Participants who
stated that they encountered ‘never’, ‘once’, ‘occasionally’ or ‘regularly’
also stated that they are familiar with the problem. . . 97
6.1 Example Time Scale of System Latencies [59] . . . 121
7.1 Participants, with years of experience in the domain (Junior/Senior or
Veteran), self-assessed expertise levels in parallel programming and
List of Figures
1.1 Historical evolution of the clock speed, amount of transistors and
num-ber of cores per CPU. . . 2
1.2 Abstract representation of serial computing, where a problem is broken up into smaller pieces that are executed serially. . . 4
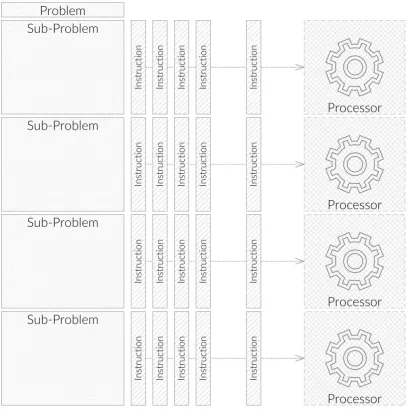
1.3 Abstract representation of parallel computing, where a problem is bro-ken up in smaller pieces that are executed in parallel by several process-ing units. . . 5
2.1 The hierarchy of cognitive design elements for software exploration by Storey et al. [156] . . . 21
2.2 Illustration of CodeCity, an integrated environment for software anal-ysis. This tool represents various packages as city blocks and classes as city buildings and allows the user to map and visualise various soft-ware metrics such as complexity or length. . . 22
2.3 Intel VTune Amplifier 2015 . . . 23
2.4 AMD CodeXL . . . 24
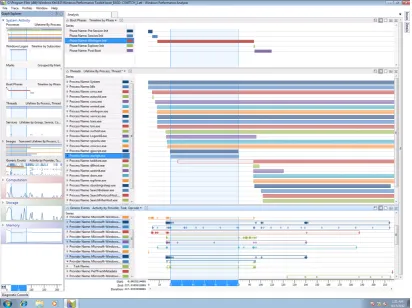
2.5 Microsoft Windows Performance Analyzer . . . 26
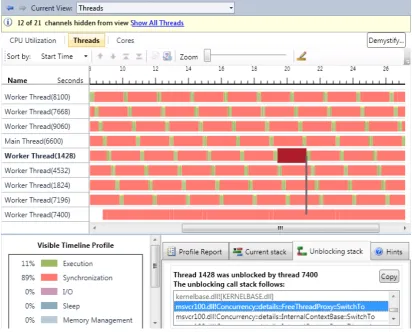
2.6 Microsoft Visual Studio Concurrency Visualizer . . . 28
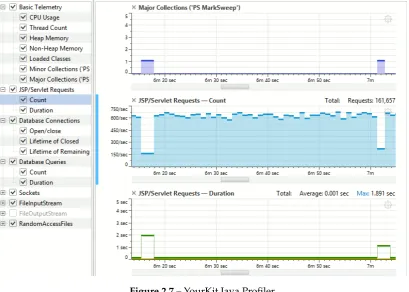
2.7 YourKit Java Profiler . . . 29
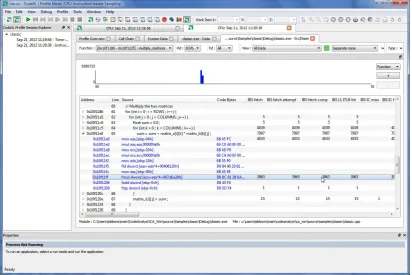
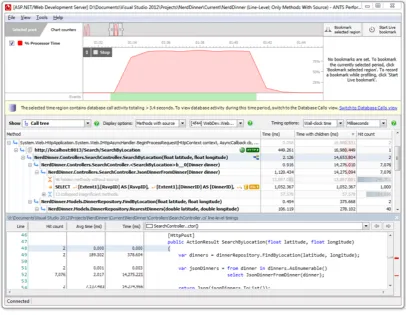
2.8 Redgate ANTS Performance Profiler . . . 30
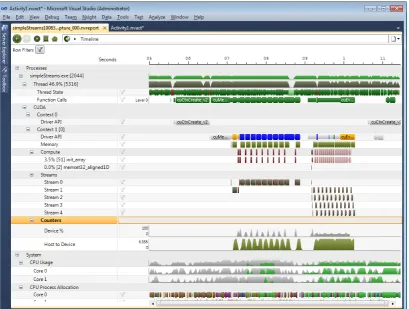
2.9 NVIDIA Nsight . . . 31
3.1 An overview of the research process. . . 35
LIST OF FIGURES
3.3 An example of the levels of agreement between experts on various
“mea-surable observations” of two performance problems. . . 41
4.1 The interview data collection and interview analysis process. . . 46
4.2 Open and Axial coding dataset, used during the procedure of applying labels and seeking relationships between codes. . . 47
4.3 A snippet of the summarised analysis, showing various statistics about each sub-category along with major category and an open code. . . 48
4.4 Categories and Codes related to the”environment“theme. . . 49
4.5 Categories and Codes related to the”people“theme. . . 50
4.6 Categories and Codes related to the”understanding“theme. . . 51
4.7 Categories and Codes related to the”orchestrating“theme. . . 52
4.8 Categories and Codes related to the”resources“theme. . . 53
4.9 Categories and Codes related to the”goal/problem“theme. . . 54
4.10 Categories and Codes related to the”techniques“theme. . . 55
4.11 Categories and Codes related to the”tools“theme. . . 56
4.12 Sample graph for measuring scalability of the same algorithm for dif-ferent workloads [72]. . . 71
5.1 The professional (years of) experience distribution of the developers who participated in the problem frequency/familiarity study. . . 95
5.2 The distribution of self-assessed expertise of the developers who par-ticipated in the problem frequency/familiarity study. . . 96
5.3 Levels of experts’ agreement on observations related to the “Lock con-tention” problem. . . 102
5.4 Quadrant plot of parallel performance problems mapped against Fa-miliarity and Frequency. . . 103
5.5 Levels of experts’ agreement on observations related to the “Cache Lo-cality” problem. . . 106
5.6 Levels of experts’ agreement on observations related to the “Alternating sequential/parallel execution” problem. . . 107
LIST OF FIGURES
5.8 Levels of experts’ agreement on observations related to the “True
shar-ing of updated data” problem. . . 109
5.9 Levels of agreement on observations related to the “Undersubscription”
problem. . . 110
5.10 Levels of agreement on observations related to the “Oversubscription”
problem. . . 111
5.11 Levels of agreement on observations related to the “Badly-behaved
spinlocks” problem. . . 112
5.12 Levels of agreement on observations related to the “False data sharing”
problem. . . 113
5.13 Levels of agreement on observations related to the “TLB Locality”
prob-lem. . . 114
6.1 Conceptual representation of a generic dual-core processor. . . 120
6.2 Conceptual representation of the NUMA interconnect architecture. . . . 122
6.3 Data locality problem diagnosis tree. . . 127
6.4 Function performing matrix multiplication, parallelized with an outer
parallelfor loop, a common construct that can be found in many
paral-lel programming libraries such as Microsoft Paralparal-lel Programming
Li-brary or Intel Threading Building Blocks. . . 130
6.5 Data representations of cache misses over time that occurred due to an
experimental run of a parallel matrix multiplication program. . . 130
6.6 The average number of instructions executed for each clock cycle. . . 131
6.7 The clock cycles wasted due to L2 and L3 cache misses. . . 131
6.8 Function performing matrix multiplication, parallelized with an outer
parallelfor loop, a common construct that can be found in many
paral-lel programming libraries such as Microsoft Paralparal-lel Programming
Li-brary or Intel Threading Building Blocks. . . 132
6.9 Data representations of cache misses over time that occurred due an
experimental run of a parallel matrix multiplication program. . . 133
6.10 Five facets of the SWARM data model used to store the performance
data for the delivery to the client applications and post-processing
LIST OF FIGURES
6.11 Horizons, a basic performance analytics system that leverages SWARM
model as its underlying data provider. . . 139
6.12 The architectural schema presenting the cloud-based data processing
system we built as a common foundation for data storage and delivery. . 140
6.13 A single horizon timeline, representing a rendered time series of CPU
usage events for a single program on the process scale. . . 141
7.1 Greenlight Viewfor global performance assessment. . . 146
7.2 Timeline View supports identification of time intervals where a data
locality issue might be present . . . 147
7.3 Thread Viewfor identifying threads exhibiting poor data locality
symp-toms. . . 148
7.4 Data PALtimeline representation of performance of two matrix
multi-plication implementations used for the experiment. . . 155
7.5 Simple program to perform large matrix multiplication used to generate
visualisation data - this version has poor data locality. . . 156
7.6 Simple program to perform large matrix multiplication used to generate
visualisation data - this version has good data locality. . . 156
7.7 Data PAL timeline representation of performance of parallel and
se-quential particle system implementations . . . 157
7.8 Simple program to process several million particles used to generate
visualisation data - this version is parallelised. . . 158
7.9 Simple program to process several million particles used to generate
visualisation data - this is a serial version. . . 159
7.10 Data PAL timeline representation of performance of two in-memory
database schemas . . . 159
7.11 Simple program to process several million user accounts used to
gener-ate visualisation data - this version has poor data locality. . . 160
7.12 Simple program to process several million user accounts used to
gener-ate visualisation data - this version has better data locality . . . 161
7.13 Data PALtimeline representation of performance of a pair of programs
LIST OF FIGURES
7.14 Simple program to illustrate different program phases - this version
uses floating-point numbers. . . 162
7.15 Simple program to illustrate different program phases - this version
uses integers. . . 163
7.16 Independent Factorial ANOVA for 2-way interaction of treatment type
and experience on correctness . . . 164
7.17 Independent Factorial ANOVA for 2-way interaction of treatment type
and participants’ experience on the self-assessed confidence level of the
Chapter 1
Introduction
1.1
Microprocessor Evolution
As computers become more prevalent in modern society, the tasks that computers may
perform have also become increasingly complicated. In order to cope with this
com-plexity, programmers develop ever more computationally demanding algorithms and
applications. Likewise the volume of data processed by computers has also increased
enormously. These factors together have led to ever expanding demands on
micro-processor performance. In order to cope with this growing demand for computational
power, hardware manufacturers continually increased the clock frequency of their
central processing units (CPUs). However, this approach meant that the power
con-sumption of each CPU also trended upwards. This strategy of increasing frequency
eventually became less viable, as the power required to improve performance
intro-duced a range of difficulties, such as excessive heat generation and leakage current.
An alternative strategy for increasing the number of instructions per second that a
CPU can process is to put multiple processors (cores) on the same chip. Many modern
personal computers now have two or more cores that enable multiple tasks (threads)
to be executed simultaneously. This concerns not only servers and supercomputers,
but also concerns any possible variety of computers: from smart-phones and game
consoles to laptops and tablets.
Figure 1.1 depicts the historical evolution of the commodity CPUs. While the clock
speed per core has stabilised around 3 GHz, the number of cores increases steadily,
thus the total number of transistors on each CPU is effectively followingMoore’s law,
the observation by Gordon Moore, co-founder of Intel, who predicted back in 1965
CHAPTER 1. INTRODUCTION
every year for the foreseeable future.
1 10 100 1000 10000
1995 1997 1999 2001 2003 2005 2007 2009 2011
Transistors (in millions) Clock Speed (in MHz) Cores
Figure 1.1– Historical evolution of the clock speed, amount of transistors and number of cores per CPU.
On modern servers it is already very common to have more than 10 cores per CPU.
For example, Intel Xeon E5 has 18 cores per socket with hyper-threading technology
that effectively doubles the amount of cores for the operating system and applications.
The table 1.1 shows the evolution of Intel processors for the past three decades. It is
interesting to note that the cache and memory evolution seems to evolve slower than
the total number of the transistors.
While the sheer number of transistors keeps increasing and doubling roughly
ev-ery three years, as Moore’s law predicts, the speed of the main memory while growing,
is growing significantly slower than the computational capability of the CPUs. This
rising disparity between the speed of the main memory and the CPU is commonly
known as thememory wall[172]. While back in the 1980’s a simple access to memory
would be equivalent to a single CPU cycle, today the same access would cost between
50-300 cycles depending on the architecture, and this number is rising. This problem
has been acknowledged and has been addressed over the past 20 years through
vari-ous strategies, including the design of more data-aware processors and optimisation
of the compilers that we use [29].
In the near future, computers are expected to have even more cores - the trend
towards “many-core” computing. A many-core processor is a multi-core processor in
CHAPTER 1. INTRODUCTION
Processor Date Clock Threads Level 1 Level 2 Level 3
8086 1978 8 MHz 1
Intel 286 1982 12.5 MHz 1 Intel 386 DX 1985 20 MHz 1
Intel 486 DX 1989 25 MHz 1 8 KB
Pentium 1993 60 MHz 1 16 KB
Pentium Pro 1995 200 MHz 1 16 KB 256/512 KB
Pentium 2 1997 266 MHz 1 32 KB 256/512 KB
Pentium 3 1999 500 MHz 1 32 KB 512 KB
Xeon 2001 1.7 GHz 1 8 KB 512 KB
Pentium M 2003 1.6 GHz 1 64 KB 1 MB
Xeon X5355 2006 2.67 GHz 4 4 x 32 KB 2 x 4 MB
Xeon X7460 2008 2.67 GHz 6 6 x 32 KB 3 x 3 MB 16 MB
Xeon X7560 2010 2.26 GHz 16 8 x 64 KB 8 x 256 KB 24 MB Xeon E7-8870 2011 2.4 GHz 20 10 x 64 KB 10 x 256 KB 30 MB Xeon E7-8870 v2 2013 2.3 GHZ 30 15 x 32 KB 15 x 256 KB 30 MB Xeon E7-8870 v3 2015 2.1 GHz 36 18 x 32 KB 18 x 256 KB 45 MB
Table 1.1– The evolution of Intel processors in the past 35 years.
are no longer efficient. While with a small number of cores, performance gains can
be achieved simply by running different programs simultaneously; with many cores,
performance gains will only be achieved through the use of parallel programming.
One of the technologies that could lead us to the thousands of cores per CPU are
known asthree dimensional integrated circuits(3D IC) where the cores are no longer
simply located next to each other on a horizontal pane, but stacked vertically, which
significantly reduces the electric power requirements along with heat and increased
efficiency.
1.2
Parallel Programming
In order to take advantage of the multi-core and many-core hardware of today and
tomorrow, programmers are faced with a need to parallelise their code and distribute
work across multiple processors. This process of parallelisation is complex and
re-quires application programmers to think about many possible outcomes and
situa-tions that may occur.
Traditionally, software has been written forserialcomputation, where a problem is
CHAPTER 1. INTRODUCTION
sequentially, one after another by a single processor. This leads to a single instruction
being executed at a time and the programmer can safely assume that the previous
instruction has completed before the new instruction begins execution. This process
is illustrated in the Figure 1.2.
Problem
Problem
Sub-Problem
Sub-Problem
Sub-Problem
Sub-Problem
In st ru ct io nProcessor
In st ru ct io n In st ru ct io n In st ru ct io n In st ru ct io n In st ru ct io n In st ru ct io n In st ru ct io n In st ru ct io nProcessor
In st ru ct io n In st ru ct io n In st ru ct io n In st ru ct io n In st ru ct io nProcessor
In st ru ct io n In st ru ct io n In st ru ct io n In st ru ct io n In st ru ct io nProcessor
In st ru ct io n In st ru ct io n In st ru ct io n In st ru ct io n In st ru ct io n In st ru ct io n In st ru ct io n In st ru ct io n In st ru ct io n In st ru ct io nFigure 1.2– Abstract representation of serial computing, where a problem is broken up into smaller pieces that are executed serially.
On the other hand,parallel computingis the simultaneous use of multiple
compu-tational units (processors) to solve a compucompu-tational problem. In order to be effectively
parallelised, the computational problem should be able to:
• Be broken apart into discrete sub-tasks, pieces of work that can be computed simultaneously.
• Execute multiple program instructions at any moment in time, as depicted in the Figure 1.3.
• Be solved in less time with multiple compute resources than with a single com-pute resource.
The compute resources can vary, but usually are a single computer with multiple
processors (CPUs), a single processor with multiple cores or an arbitrary number of
such computers connected by some kind of network to be able to communicate
to-gether for coordination purposes.
As the programmers seek to develop parallel applications, they encounter several
CHAPTER 1. INTRODUCTION
Problem
Problem
Sub-Problem
Sub-Problem
Sub-Problem
Sub-Problem
In st ru ct io nProcessor
In st ru ct io n In st ru ct io n In st ru ct io n In st ru ct io n In st ru ct io n In st ru ct io n In st ru ct io n In st ru ct io nProcessor
In st ru ct io n In st ru ct io n In st ru ct io n In st ru ct io n In st ru ct io nProcessor
In st ru ct io n In st ru ct io n In st ru ct io n In st ru ct io n In st ru ct io nProcessor
In st ru ct io n In st ru ct io n In st ru ct io n In st ru ct io n In st ru ct io nProcessor
In st ru ct io n In st ru ct io n In st ru ct io n In st ru ct io n In st ru ct io nFigure 1.3– Abstract representation of parallel computing, where a problem is broken up in smaller pieces that are executed in parallel by several processing units.
and the programmers themselves must address them in their applications. Such
chal-lenges are the reasons why compiler-based solutions from vendors will have limited
success in creating a scalable parallel code base for many applications, as argued by
Wen-mei Hwu, Parallel Computing Institute Chief Scientist of the University of
Illi-nois. He contends that one of the main challenges in parallel programming is the high
engineering effort required in the implementation of efficient parallel algorithms with
high levels of parallelism and good data locality.
A sparse matrix-vector multiplication kernel is a good example of such a problem
CHAPTER 1. INTRODUCTION
vector set being simply too large to be stored in the memory, resulting in computation
limited by the memory accesses.
This example is widely used in research on parallel performance tuning, while
having a very simple implementation consisting of just a few lines of code.
How-ever, the reality is that even ordinary programmers have to deal with parallel systems
with orders of magnitude of larger complexity than this matrix multiplication
exam-ple. Numerous levels of indirection in the real systems while hiding the complexity
might also obfuscate in-memory data layouts that are crucial for designing efficient
and highly parallel algorithms.
Currently, the parallel programmer needs to determine layout arrangements of
data, allocate memory and temporary storage, arrange pointers, perform index
calcu-lation, and orchestrate data movement in order to make use of the on-chip memory
resources to support data re-use.
The programmer also has to decompose work into tasks, organise threads to
per-form the tasks, perper-form thread index calculations to access data in different levels of
the memory hierarchy, determine data sharing patterns, and check data bounds. Many
parameters of these arrangements need to be determined for each hardware platform.
All such tasks are complicated and error prone, moreover the implementation also
depends greatly on the target hardware platform and unfortunately there is not much
compiler technology available today to address these challenges.
In this thesis, we aim to provide insights that will lower the engineering effort
required for understanding the vast complexity of information involved in the process
of parallel programming and identifying performance problems. We hope to provide
insights to allow ordinary developers to effectively identify potential problems and
support the processes of parallelisation and further performance tuning.
1.3
Addressing the Challenges
A programmer seeking to parallelise a program has to overcome the challenges of
synchronisation, non-determinism and orchestration that a programmer writing an
equivalent sequential program would not face. Additionally, the very process of
CHAPTER 1. INTRODUCTION
top of that, when looking at a program it is not necessarily obvious what its parallel
performance will be.
For over two decades, a great deal of research effort has been directed at tools
for improving the performance of parallel applications and over 200 now defunct,
parallel-programming languages saw the light in the 1990s [112]. However, twenty
years later, concurrency bugs are still extremely common and theoretical performance
is often very difficult to achieve [145]. According to the 2011 UBM TechWeb Survey of
275 software engineers or managers of development teams, 32% of participants spend
6+ hours in a month finding data races or deadlock conditions and 69% spend 6+
hours in a month tuning the performance of their applications1.
In this thesis, we aim to address the challenges in parallel programming by
in-vestigating how tools for parallel programmers can be designed in order to support
programmers more effectively. In particular, we aim to ease the engineering effort
required for the implementation of efficient parallel algorithms by providing
visuali-sation tools to support both expert and ordinary programmers in the task of designing
and optimising parallel programs. In order to even consider building effective tools
to support and ease the engineering effort, we must first understand the needs of
pro-grammers in the field, how they currently cope with the problems and the tools they
use. Hence, we present a field study of the challenges faced by parallel programmers.
In addition to the fieldwork, this thesis also presents a taxonomy of parallel
per-formance problems constructed during our investigation of the problem space, as to
our surprise, no extensive taxonomy existed, while there are a multitude of
perfor-mance tools. This raises questions on the validity of existing perforperfor-mance tools and
how effectively they can support the performance problem diagnosis without a
(semi-)comprehensive analysis of the problem space to base the design upon.
One of the problems we will explore in the following chapters of this thesis is
the so-called ‘data locality’ problem. This problem, induced by the ‘memory wall’,
is intimately intertwined with parallelism [84] and is one of the key issues in
paral-lel programming with modern and widespread architectures [119]. When developers
build parallel software, performance is usually one of the key goals, yet data
local-ity is often just as important as parallelism for performance. For example, accessing
CHAPTER 1. INTRODUCTION
data in main memory can take hundreds of times longer than accessing the same data
from the first level cache [70]. Thus, the programmer needs to be able to identify data
locality problems when they arise in parallel programs. In addition, parallel threads
executing on different cores often share the same data in one or more levels of cache
which can improve locality. Equally, the threads may end up competing to keep their
own data within the cache. The result can be complex interactions which cause subtle
locality problems that may be difficult for the developer to identify.
Taking the parallel sparse matrix-vector multiplication implementations as a
base-line for our data locality investigation, we examine the necessary information for the
construction of effective displays that allow diagnosis of data locality problems. This
comes with its own set of challenges, as we will need to look into low-level hardware
performance counters and find a way of extracting useful metrics which we can later
display. We present a model that brings together both analytical and technical aspects
and allows us to identify interesting metrics, among thousands we can potentially
collect, for each of the performance problems in our taxonomy.
Finally, we present an interactive visualisation tool for data locality identification,
having performed a significant amount of fieldwork and analytical work in order to
simply answer the question ofwhat to show on the screen?, along with an evaluation of
the tool using a set of parallel programs exhibiting performance issues with regard to
data locality.
In this thesis we will be building towards a general framework for tool designers
and consider many different aspects related to this - from understanding field
prac-tices to effective visualisation metaphors and ways of collecting and analysing
rele-vant hardware performance data.
While the research aspirations are challenging, it is incumbent on us to distil the
process into three major research questions. In this thesis, each chapter goes into more
detail on each research question, but we use them to fundamentally guide the process
of the research. The questions can be summarised in three words:understand,model
andvisualise.
• RQ 1: How do people conceptualise parallel programs?
• RQ 2: Can we perform a comprehensive and systematic analysis of the
CHAPTER 1. INTRODUCTION
programs?
• RQ 3: To what extent can a visualisation effectively support programmers in
the task of optimising parallel programs?
In the Chapter 3 we give further details on each research question and present an
overview of how we have addressed each question. Answering to these three research
questions allowed us to create a general framework that can be used to design various
support tools for ordinary developers and aid them in the process of parallel
perfor-mance problem diagnosis. Understanding how programmers conceptualise parallel
programming, knowing the problems that can occur and the information important
to diagnose those problems were crucial questions that required an answer prior to
Chapter 2
Related Work
The work presented in this thesis is situated at the intersection ofprogram
compre-hension,software visualisation,software optimisationandempirical software
en-gineering. Software visualisation is often used in research to aid program
compre-hension, thus those issues go in pair. However, research in software optimisation, and
in particular for concurrent programs, is primarily focused on low-level engineering
issues and is an area that has been under-explored from the human-computer
interac-tion perspective.
In this chapter we selected, what we consider seminal and relevant papers which
have allowed us to build towards a general framework that can be used to design
various support tools for ordinary developers and aid them in the process of parallel
performance problem diagnosis. The selection of the work presented in this chapter is
relatively narrow and aligned closely with our research questions.
We first examine the domain of empirical software engineering which aims to
un-derstand and model the way programmers work; this includes the way they make
sense of their code and software architecture, the metaphors, the way they test and
debug the code or the differences between novices and experts. Understanding these
things is important, as in our research we aim to support ordinary developers.
Next, we will look at the tools that programmers have at their disposal already.
This includes algorithmic skeletons, taxonomies, performance prediction tools and a
variety of visual analysis tools. Understanding how the existing tools function and
how they can be used or improved is crucial for building effective support tools of
any kind.
Finally, as we aim to create visual support tools, we need to understand the field
CHAPTER 2. RELATED WORK
2.1
Empirical Software Engineering
While the practice of parallel programming for ordinary developers has not been
widely studied from a HCI perspective, the scientific computing and software
engi-neering communities have grappled with the problems associated with parallel
pro-gramming for some time.
Much work has been carried out within the Software Engineering community with
the aim of understanding and modelling the way programmers work and how their
work-flows can be improved. One of the methodologies applied is to look at how
complex strategies can be modelled in a series of simple observations, giving a
bet-ter understanding of the daily practices of software developers and the architectural
choices they face [87, 52, 14].
The practice of software engineering has been examined in various contexts, as the
organisational environment can vary drastically. If one considers crowd-sourced
soft-ware development, where a program is developed by a potentially unknown number
of developers, in a distributed fashion, it presents challenges of task decomposition,
coordination and planning [155], while video game development, typically conducted
by a team of seasoned veterans under one roof presents another set of challenges and
pipeline-like organisation [28]. Likewise, in multi-core software development, both
the characteristics of the software being developed, and the development context will
have an impact.
Over the past twenty years many studies have been carried out on novice
pro-grammers and identified the positive and negative aspects of today’s programming
systems [128]. Some of the research was closely related to program maintenance and
can potentially be applied to performance analysis tools. While testing and
debug-ging are two very complex areas for novice programmers, some researchers claim that
programming tools should support source-level debugging with data visualisation to
be more effective [22].
Using an appropriate concrete metaphor, a familiar analogy explaining how the
programming system works, can have a positive effect on the usability [107] and also
maximises transfer of knowledge if the metaphor is close to a real-world system [150].
CHAPTER 2. RELATED WORK
some research indicates that expert programmers use intricate plans and strategies
in order to schedule and prioritise their activities [13]. Planning is common among
novice programmers and the absence of good planning strategies results in wrong
assumptions and more bugs [21]. Programming tools should also consider locality;
related components should be physically close [20, 153] and hidden dependencies
re-duce understanding [58].
For both novice and expert programmers, the ability to test partial solutions is an
important feature [128]. Incremental running and testing, a programming strategy
where the code is iteratively tested while new code is being written, has been found
to be an effective debugging strategy [60], and it has been observed that developers
perform better when such a strategy is adopted [56, 58, 131].
In addition, there have been attempts to understand how programmers work from
a sense-making perspective, applying information foraging [133] to understand how
developers debug [94, 132]. Various empirical studies and models have attempted to
understand and help answer questions posed by developers [87, 52]. These studies
have employed a variety of methodologies, including observations of pairs of
pro-grammers given sample tasks [148], and questionnaire-based studies [93, 122].
Prabhu et al. [134] present an extensive survey of software practices in
compu-tational science. They conclude that current programming systems and tools do not
meet the requirements for scientific computing. They indicate that most tools assume
that programmers would invest time and energy to learn and master a particular
sys-tem, which turned out not to be the case with programmers wanting results
immedi-ately. They found that most scientists understand the importance of parallel
program-ming in the context of scientific computing and many scientists spend a significant
amount of time and energy programming. Despite this effort, most scientists seem to
be unsatisfied with the performance of their programs and believe that the
improve-ment of performance will significantly improve their research and, in some cases,
al-low larger experiments or enable fundamentally new research avenues. The survey
concluded that overall the needs of computational scientists were under-served and
new tools and techniques were needed to unlock the potential of high-performance
computing.
CHAPTER 2. RELATED WORK
thousand scientists in order to study software engineering practices in the scientific
community [64]. Their study found that for “software testing” and “software
verifica-tion” scientists assign on average a higher level of importance compared to the level of
their own understanding of these concepts. Scientists seem to care a great deal about
the correctness of their code, but feel they lack knowledge of software engineering
practices to verify it. Additionally, their findings suggest that informal learning from
peers was more important to scientists than formal education in an academic
institu-tion or formal training at the work place, they postulate that this may be due to the
lack of appropriate formal training. Their study also confirmed the hypothesis that
the majority of scientists use desktop computers most of the time for developing and
use scientific software as opposed to supercomputers or clusters.
A classroom study conducted across a number of universities compared different
programming models across a variety of representative applications [74]. It is worth
noting that most of these studies use novices as the study participants rather than
experienced programmers. The study compared shared memory (multi-core) and
message passing (distributed) implementations of two problems, written by novice
programmers. They found that the message passing development effort, measured in
lines of code, was statistically greater but resulted in more correct programs. On the
other hand, shared memory programs were smaller and easier to write but were more
error-prone.
Luff conducted an experiment comparing developers’ performance using
vari-ous parallel programming models (actor model, transactional memory and standard
shared memory threading with locks ) while keeping the programming language and
environment (IDE) the same [102]. The results were inconclusive and showed no
sig-nificant difference in any objective measurement between those models.
A study conducted by Eccles et al. [45] had novice and expert programmers both
categorising different parallel algorithms, using a card sorting method. They found
that novices and experts used a different classification scheme: novice programmers
organised problems around the problem domain while expert programmers
organ-ised problems around communication granularity and overhead. This difference in
classification could identify a set of concepts which delineate novices from experts
CHAPTER 2. RELATED WORK
and libraries is around the expert classification scheme, and postulate that it would
result in a more usable parallel software.
A wide variety of prior literature related to program maintenance focuses on
de-bugging, with a particular emphasis on novice versus expert differences [110]. Most
research agrees that reading and understanding code is the most common debugging
method [43, 165], although this is not always feasible for very large programs [88]. Fix
et al. [49] found that experts had more sophisticated mental models than novices, and
so were able to use them more effectively to debug programs.
A study by Pancake [127] attempted to determine a correlation between mental
models and the effectiveness of visualisations for parallel debuggers. It demonstrated
that it is possible to implement various conceptual models using any programming
language, however program development becomes significantly easier and more
re-liable when the language has support for expressing the desired model. The same
correlation applies to the debugger visualisation models.
Fleming [144] conducted an exploratory think-aloud study in which he observed
15 programmers debugging a multi-threaded server application which was seeded
with a defect. He claimed that the programmers who succeeded used a previously
un-documented failure-trace strategy while debugging, and using such a strategy made
the programmers more likely to succeed. The strategy involved modelling
interac-tions between various threads in the program in order to find a failure trace (i.e. the
interaction that led to a failure). He also postulated that cognitive strain may have
been an important barrier as the failure-trace strategy was modelled internally. In
addition, it is claimed that the inherent concurrency of parallel programming makes
managing hypotheses regarding the cause of a bug more difficult.
2.2
Parallel Performance Analysis Tools
As will be argued later in the thesis, within parallel program development, the
dis-tinction between performance problems and bugs is much less clear than in traditional
software development. However, the vast majority of parallel performance problems
would receive only the broadest categorisation under existing taxonomies. Within
CHAPTER 2. RELATED WORK
categories of problem, the Performance category contains onlythroughput inadequate,
insufficient users, response time delay and performance parasites, with the first three of
these being more phenotype rather than genotype classifications.
When developers and researchers talk about parallel performance, they talk about
it in the context of a particular algorithm, system or model. A multitude of effective
design patterns have been recorded and studied in the literature, such as parallel for
loops, concurrent containers, pipelines or map-reduce. These can be thought of as
“algorithmic skeletons” [35, 162, 39, 6]. Such algorithmic skeletons can help reduce
parallel programming errors as part of a “concurrency toolbox” with which
program-mers can construct the abstraction required to solve their problems and simplify the
process of application development [25].
Recent years have seen widely accessible libraries providing various
implemen-tations of such skeletons becoming available, such as OpenMP, Microsoft Parallel
Patterns Library (PPL),java.util.concurrentlibrary or Intel Threading Building Blocks
(TBB) [138, 143].
Those algorithmic skeletons represent general reusable solutions to commonly
oc-curring problems within a particular context in software design - such solutions are
known asdesign patterns. Design patterns are formalised best practices that the
pro-grammers use to solve common problems during the design phase. While the term
algorithmic skeletonsis in fact used for design patterns related to parallel programming,
design patterns are widely used in other areas of computer science. Particularly, they
have gained popularity in the field after the work of Gamma et al. [54] where some
of the design patterns related to object-oriented programming were catalogued and
explained.
In the Chapter 5 of this thesis, we present a model for parallel performance
prob-lem diagnosis, with the aim of supporting the design of effective performance analysis
tools for parallel programming. Such tools can be seen as providing two types of
ca-pability - automation or performance prediction, intended to process the raw data and
provide the developer with useful cues for action, and visual displays to be presented
to the developer to support their own diagnosis and decision making.
A number of approaches to automatic performance prediction of parallel programs
CHAPTER 2. RELATED WORK
approaches to estimate various parameters that are critical for a well-performing
par-allel program, such as work distribution, computation time or cache misses [47].
An-other example is combining user-selectable features for automated performance
de-tection. This can be accomplished by using a hybrid system that allows a user to select
a non-functional property (e.g. performance) and its features. For example, the
per-formance of a database depends on whether a search index or encryption is used and
how both features operate together, as the interaction of both features may lead to
an unexpected behaviour while their individual presence may not [147]. Many other
approaches exist and automatic performance prediction is an active field of research.
However, accurately modelling and predicting performance becomes increasingly
dif-ficult for large-scale applications, since system complexity increases as well with its
size [79, 173, 101].
Most bug/performance prediction algorithms have been developed, tested and
verified in an academic setting. However, a recent case study by Lewis et al. [98]
of a deployment of prediction algorithms within Google, concluded that while many
developers are excited about having a new tool to help them in achieving better code
performance, barriers remain in making them useful for developers. One of the main
critiques of prediction algorithms is the lack of actionable messages, the presence of
which might support wider adoption of automatic prediction tools. In addition, many
performance problems occur only under specific input conditions, and automated
profiled inputs do not generally cover all possible code paths [121, 81, 63, 177].
An important aspect of tool support for multi-core programming is
understand-ing performance data. Given the volume and complexity of this data, visualisation is
an important design direction as it leverages capacities and bandwidth of the visual
system to quickly assess and understand large volumes of data. Visualising the
be-haviour of parallel programs is a very complex task, as the bebe-haviour of the programs
themselves is often complex. The area of effective visualisation techniques for parallel
programs is still relatively unexplored within parallel programming research and has
usability implications [145]. However, the need to form a scientific body of research,
develop human-centered models, and target production level applications and their
developers has been recognised [106].
CHAPTER 2. RELATED WORK
and optimisation of parallel programs have been created, starting as early as the 1980’s
with the Poker environment [151, 152], allowing programmers to write and debug the
first portable (cross-compiled) parallel programs.
Other tools, such as ParaGraph and ParaDyn have been developed to visualise
be-haviour of parallel software [65, 114]; most of the tools have been developed for the
High-Performance Computing domain, and target distributed systems such as HPC
clusters. While previous work has identified a number of broad issues and goals for
tools to support programmers in understanding the performance of their programs,
only a relatively small proportion of the literature deals specifically with the
perfor-mance problems of multi-threaded programs.
With regard to tools, existing systems can be seen as providing answers to two
main issues: between the ’topology’ of software (e.g.: source-code hierarchy,
mem-ory layout, etc) and the mapping of such topology into the visualisation, as well as
the issue of synchronisation. The topology issue requires that spatial relationships in
programs be understood. The synchronisation issue requires various events occurring
within the processor to be correlated [30]. While some existing visualisations are
po-tentially useful, there is a need for analysis of how such tools can aid in the diagnosis
of problems [12].
Many commercial tools, such as IntelR VTune, AMDR CodeAnalyst, Windows
Performance Analyzer, GProf, IBM Rational PurifyPlus and others [5, 3, 7, 113] have
incorporated performance analysis approaches that combine performance prediction
metrics used in automated prediction and many different visual displays that present
the information to end-user developers. However, according to a recent survey, a
sig-nificant number of developers do not use any software tool at all: at least 25% for each
type of tool surveyed, including memory and performance tuning tools. Significantly,
66% of the developers surveyed do not use any concurrency tool1.
2.3
Software Visualisation
It is important to understand the information visualisation field prior to designing
a tool or advising information visualisation designers as we intended to do during
CHAPTER 2. RELATED WORK
the project. This section is intended as a brief and general literature overview of the
information visualisation field, since it is not possible to provide a comprehensive
ac-count of the field in merely a few pages. Below we describe the origins of the field
and point out the most prominent collection of resources and continue with a few
selected resources that relate to visualisations of performance of algorithms and
pro-grams within traditional and multi-core computing, including high performance and
distributed computing.
In the data visualisation domain, there are two commonly accepted types of
visu-alisations, namely explanatory visualisation and exploratory visualisation [99]:
• Explanatory visualisation consists of data visualisations that are used to transmit information or a point of view from the visualisation designer to its reader, they
have a specific “story” that they intend to transmit.
• Exploratory visualisation is used by the designer for self-informative purposes to discover patterns, trends or sub-problems within the dataset.
We examine the field of information visualisation (InfoVis) and data analytics, as
related to our research in parallel performance visualisation. InfoVis is an
interdis-ciplinary field that has emerged from computing and graph-making, motivated by
the need to visually represent increasingly large data-sets found in the sciences, as
well as digital communications and records, to enhance how humans can analyse and
learn from this information [100]. The field of data visualisation is relatively new and
rapidly growing, driven by the latest developments in information and
communica-tions technologies, but tracing its origins to early mapping and graphing techniques
[51, 163].
There are a number of books which aim to provide an overview of the new field
of information visualisation and data analytics (e.g. [33, 83, 108, 154, 175]), along with
numerous books for practitioners and designers (e.g. [99, 109, 116, 139]) and university
courses around the world.
While there are numerous definitions of information visualisation, one of the most
prominent is by Card et al. who state that InfoVis is “The use of computer-supported,
interactive, visual representations of abstract data to amplify cognition” and also
CHAPTER 2. RELATED WORK
several streams of overlapping interest which concurrently contributed to the growth
of the domain:
• Data graphics, which focused on the usage of graphs and maps to visually rep-resent data, including setting guidelines and examples of good design [163, 164]
• Statistics and visualisation, which focused on the distilling and analysing multi-variate and large datasets [34].
• Scientific visualisation, a research agenda on visualisation and computer graph-icsinvolving computational scientists and engineers, visualisation scientists and
engineers, systems support personnel, artists, and cognitive scientists [111].
• User-interface research, which explored ways to help users to analyse large amounts of data, with a focus on usability and its cognitive amplification [27].
• Computer graphics and artificial intelligence, where researchers, informed by principles like those developed by Bertin and Tufte, sought to automate data
transformation processes, as well as creating graphical and other visual
repre-sentations [90].
Over the last decade and a half, numerous researchers have tried to apply some
of the InfoVis concepts in order to visualise performance of various algorithms and
systems. Early in 1993, Waheed and Rover described several issues that needed to be
addressed to make performance visualisation of parallel systems possible and
effec-tive, namely: development of techniques into a concrete methodology for evaluating,
optimising and predicting performance; rendering paradigms to display logical
struc-ture and behaviour; and integration methods in a performance analysis environment
[167].
Unfortunately to date, most of the issues have been researched separately and are
rarely brought together and evaluated as a whole. Performance prediction, for
exam-ple, has made tremendous progress during the recent years, energised by a widespread
adoption of multi-core processors [101, 173] and the performance, measured in cycles
per instruction (CPI) can be predicted relatively accurately, even on complex server
workloads [11] and different approaches to predicting are being proposed and
im-proved [79]. Such research, however, has not been brought into commercial tools and
CHAPTER 2. RELATED WORK
Some performance visualisation designs and considerations have been informed
by the insights from research carried out on human factors, as mentioned earlier (e.g.
[126, 65, 67, 66]).
Understanding software architecture is a crucial step towards building and
main-taining software. However, software architecture is a conceptual and intangible entity,
which can be difficult to comprehend and reason about; visual mappings can help to
reduce the cognitive effort involved. The need of visualising the structure of a
soft-ware system becomes particularly evident when the softsoft-ware system grows to entail
a huge number of modules and procedures related in a complex fashion [55].
Research in software visualisation attempts to answer a multitude of questions
posed by various stakeholders. In a world where most of the successful companies
rely heavily on software, visualising software systems is important not only for
soft-ware architects and engineers involved in its development but also testers, project
managers and even customers.
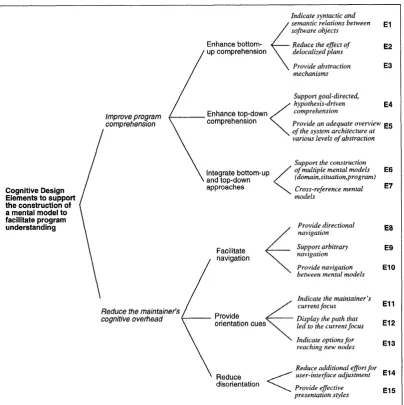
Storey et al. [156] conducted a comprehensive analysis of cognitive models
in-volved in the program comprehension process and describe a hierarchy of cognitive
issues and their implications for design that should be considered during the design
of software exploration tools, including software visualisation systems. Figure 2.1
illustrates the categorisation of cognitive design elements for software exploration.
Amongst the different cognitive models, Storey et al. present two fundamental ones:
• Bottom-up comprehension modelwhere the program understanding involves
reading the program statements and constructing higher level abstractions.
• Top-down comprehension modelrequiring the domain knowledge of the
pro-gram or previous exposure to the structure of the propro-gram. The maintainer
(reader) of the program formulates a series of hypotheses and validates or rejects
them by reading the source code or visualising the structure of the program.
In her paper Storey states that it is essential to determine which comprehension
model (top-down, bottom-up or hybrid) is best supported by the tool, while some
research also suggests that people are using either model depending on certain cues.
The implications of this work have been extremely influential on the state of the recent
CHAPTER 2. RELATED WORK
Figure 2.1– The hierarchy of cognitive design elements for software exploration by Storey et al. [156]
Software itself is created, complex, abstract, and difficult to observe, to help
pro-grammers understand it, software visualisation uses various visual representations to
make software more visible [32]. Roman and Cox [141] defined program visualisation
as a mapping from programs to graphical representations. Advocates of visualisation
point to the important role visual communication plays in our lives, to the very high
bandwidth of the human visual system and our ability to detect visual patterns.
Several research surveys have been conducted in order to understand the current
trends and the state of research related to software visualisation.
CHAPTER 2. RELATED WORK
synthesised the work performed by 82 researchers. Koschke’s survey showed
that the vast majority of researchers believe that visualisation is very important
to their domain. The survey also raises several concerns, including an improved
understanding of the needs of viewers (programmers). Koschke calls for more
modelling of visual understanding and experimentation with different kinds of
visualisations. He also highlight that the most significant challenges in software
visualisation arise in maintenance (debugging and optimisation), reverse
engi-neering and re-engiengi-neering.
• A research survey of software software architecture visualisation conducted by Ghanam and Carpendale [55] highlights some of the trends in the research
com-munity. Such trends include the use of the third dimension in order to reduce
the visual complexity. Another trend consists of exploring and using real-world
metaphors (e.g. “cities”) as means to amplify cognition. However, the authors
call for experimental validation of various metaphors as there is little or no
em-pirical evidence for the added benefits of metaphors in software architecture
[image:39.595.101.508.434.664.2]visualisation.
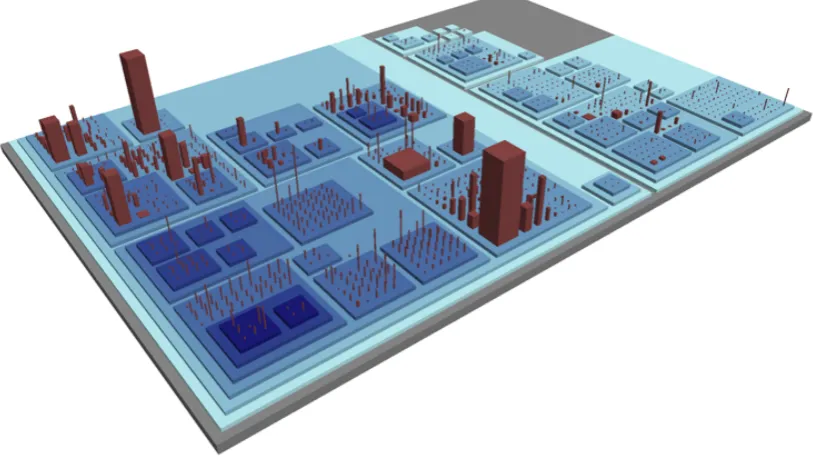
Figure 2.2 – Illustration of CodeCity, an integrated environment for software analysis. This tool represents various packages as city blocks and classes as city buildings and al-lows the user to map and visualise various software metrics such as complexity or length.
evo-CHAPTER 2. RELATED WORK
lution of software architecture summarises the state of the research and various
visual techniques used to display the software architecture hierarchies. It also
highlights the importance of software metrics as an ideal abstraction as they
en-capsulate, summarise and provide essential quality information about the source
code [92]. The survey highlights an essential aspect of software visualisation
be-ing the evolution of the software and some important works ([168], Figure 2.2) in
the domain which combine software metrics, hierarchical structure, metaphors
and effective temporal visualisation to gain a better understanding of the
archi-tecture and its evolution. Khan calls for forward collaboration between the
re-searchers, experts and the industry, tailoring tools to meet specific requirements
and conduct comprehensive evaluations of software visualisation systems.
2.4
Existing Tools
In this section we analyse some of the most widely used tools in the industry and
review some of the advantages and disadvantages of each tool based on its
capabil-ities or design language used. The analysis of the tools below is not intended to be
comprehensive, but to be focused on on the subject of this thesis and the pros and
contras of various tools represent advantages and disadvantages from the standpoint
of ordinary programmers.
2.4.1
Tools from Hardware Manufacturers
Hardware manufacturers such as Intel or AMD provide performance analysis tools
that are closely-tied to their respective microprocessors. The tools make use of
hard-ware performance counters, also known as hardware counters, which are a set of
special-purpose registers built directly into the CPUs. They store hardware-related
activities such as cache misses or power information. Some of the tools that fit into the
category include:
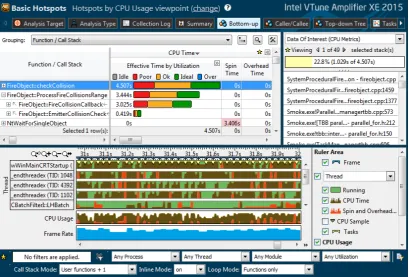
• Intel VTune Amplifier (Figure 2.3), a commercial application for software
per-formance analysis created by Intel. This tool contains many advanced features
CHAPTER 2. RELATED WORK
Figure 2.3– Intel VTune Amplifier 2015
low-level information from the hardware performance counters present on the
CPU itself.
• AMD CodeXL (Figure 2.4), a software development tool suite created by AMD.
The suite features a CPU profiler, both GPU debugger and a GPU profiler, along
with a static OpenCL kernel analyser. The CPU profiler can be used to
iden-tify and improve performance of applications or drivers for AMD-manufactured
CPUs. The profiler features instruction-based sampling and CPU hardware
per-formance counters.
Advantages of
Tools from Hardware Manufacturers
• Features hardware event sampling and allows to find specific tuning opportuni-ties such as cache misses, branch mispredictions or even power measurement.
• Integrates expert knowledge of the engineers who have designed microproces-sors. For example, VTune features various metrics based on low-level
CHAPTER 2. RELATED WORK
Figure 2.4– AMD CodeXL
performance impact of cache misses at a particular level, as measured by an
ap-proximate number of the CPU cycles wasted due to the cache misses.
• Often have simple timeline visualisations that allow identification of load bal-ancing and synchronisation issues.
Disadvantages of
Tools from Hardware Manufacturers
• At least some of the advanced features are not present on other platforms due to hardware incompatibilities and the support of such hardware is limited.
• Expert-oriented tools which require extensive training and manufacturer-specific vocabulary (eg: Intel QPI, AMD ISB).
CHAPTER 2. RELATED WORK
2.4.2
Generic Operating System Tools
Operating system vendors such as Microsoft or various third parties provide generic
trace analysis tools which take operating system events or various log files and
al-low interactive analysis or querying of the information contained in the log files. One
[image:43.595.99.512.322.630.2]of the tools that fits into this category isMicrosoft Windows Performance Analyzer
(Figure 2.5), a tool that creates graphs and interactive data tables based on the data
provided by the underlying Windows subsystem, namely Event Tracing for Windows
(ETW). This tool is generic in design and can plot any time-series of precise or
sam-pled events provided by the subsystem. It features deep integration with Windows
platform, querying and comparative analysis visualisations.
Figure 2.5– Microsoft Windows Performance Analyzer