Elementary School Preservice Teachers’ Competencies in
the Field of Patterns under the Process of Scientific
Skills Development
Cemil Inan
Department of Primary Education, Faculty of Ziya Gokalp Education, Dicle University, Turkey
Copyright © 2015 by authors, all rights reserved. Authors agree that this article remains permanently open access under the terms of the Creative Commons Attribution License 4.0 International License
Abstract
P Probably the simplest and most comprehensive definition to be made regarding the question of "what is mathematics?" will be that "mathematics is a science of patterns and relationships". It is possible to examine patterns in different levels of difficulty and importance from preschool period to advanced levels. In fact, the robust foundations of advanced algebraic and functional thinking could be established at early ages with the help of patterns. In such an important field of study, investigation of preserves teachers' competencies is thought to contribute to teacher training studies to be conducted in future. The present study was carried out using statistical methods with third-grade preserves teachers from four different programs of the Elementary School Teaching Department at Ziya Gökalp Education Faculty of Dicle University. The research data were collected via pattern activities developed by Olkun
and Tanişli (2009). In order to analyze the data collected,
t-test, one-way analysis of variance, frequency distributions and Pearson correlation-determination analysis were used. The results of the analysis of the research data revealed that in general, in the field of simple-to-complex patterns, the preserves teachers participating in the study had a high level
of competency in the phases of recognition, visualization and verbalization and that they had a medium level of competency in the phases of symbolization and analysis. In
the study, no significant differences were found between the preservice teachers' competencies in the acquisition of thinking skills regarding the simple-to-complex patterns with respect to their gender and their programs in the department. When the pattern activities were examined considering the class levels, the preserves teachers reported difficulties due to lack of knowledge at most about the sub-dimensions of "Let's continue the pattern to a far step" for the elementary school 1<sup>st</sup> and 2<sup>nd</sup> grades; "Let's determine the relationship" for the elementary school 3<sup>rd</sup> and
5<sup>st</sup> grades; and "Let's generalize" and "Let's
find a relation" for the elementary school 6<sup>st</sup>
and 8<sup>st</sup> grades. Regarding the sub-dimensions, no significant difference was revealed in terms of the program and gender. Only for two of the programs, for the purpose of overcoming the lack of knowledge, background information was given about "arithmetic and geometric sequences" prior to the application (Elementary School Teaching and Pre-School Teaching). The pretest posttest study was carried out to investigate the impact of the practical experimental work. The increase in the experimental group was statistically significant (t = 2.05, p <.05). The addition of application directed research lab to the front and end debate in the laboratory has been shown achievement tests to be effective in the development of science process skills. The findings obtained in the study demonstrated that the preserves teachers involved in the research sample met certain subjects regarding certain sub-dimensions in the field of simple-to-complex patterns as the elementary school level increased and that they did not take any courses covering these subjects. In order to fill the students' knowledge gap, it is believed that it would be useful if comprehensive courses related to "patterns and relationships" are included in the curricula of teacher training institutions.
Keywords
Mathematics-patterns and Relationships, Elementary School Teaching, Competencies1. Introduction
mathematics incorporates (Hargreaves et al., 1999). Pattern studies are one of the efficiencies realized in the whole of mathematics. These efficiencies are the foundation of seeing mathematical relations and generalizations (Burns, 2000; Tanişli and Olkun, 2009). Patterns result in the development of skills such as recognizing a mathematical structure,
visualization, verbalization, symbolization and analysis, respectively (Cathcart, Pothier, Vance and Bezuk, 2003). Determination, definition and generalization of the relationship in pattern is significant for the concept of function and algebraic development (NCTM, 2000). Thus, students need to experience to recognize, analyze and
generalize existing relations between variables in a pattern in youth. These experiences result in students being able to form relationships between various thoughts and develop different strategies in mathematics (Reys, Suydam, Lindquist and Smith, 1998). As per the noted significance, as a result of the renewal in mathematics instruction programs, the concept of pattern found its place in the curriculum. Students in the first five grades of the primary school gain experience with repetitive patterns, and continue their studies with expanding patterns in the following years. In this context, studies such as completing a missing pattern, its sustenance and forming a new pattern, its representation in different forms, recovery of relations in a pattern and discovery of the rule in the pattern are performed (MEB, 2009a). From 6th through 8th grades in primary education, students’ generalization of the rule in the pattern and expressing it using letters are considered as basic skills. In activities presented in the instruction program towards the
generalization of the pattern rule, patterns are modeled using various materials or figures and the students discover the relation between the ordinal and the elements of the pattern via tables (MEB, 2009b p. 206). These generalizations are later related to equations with two unknowns where a variable changes dependent on another and help learning of concepts more significantly. Furthermore, skills that would provide the background for the concept of function that will be instructed in further levels (MEB, 2009b p. 98). Students face hardships related to the patterns concept that forms the basis of various mathematical concepts in the literature. Stacey (1989) stated that students are inclined to find the next term by using the previous term. Students can guess the following term by examining the relationship between concurrent numbers; however they have trouble in defining this in terms of an algebraic rule. Stacey found that students make the mistake of assuming that the common difference is the rule in patterns that share a constant common difference. Lee (1996) pointed out that the students do not have trouble in seeing the pattern, but in expressing it in algebraic terms. Further studies show that students are more successful in expressing the relation in a pattern verbally than defining it in algebraic terms (English and Warren, 1009; Lannin, 2002; McGregor and Stacey, 1995). Present study aims to exhibit the state of pre-service teachers’ in the field of patterns, which is the founding stone in observing mathematical relations and in generalization. For this purpose, answers for
the following questions were scrutinized:
1. How efficient are the pre-service teachers in the field of patterns?
2. Is there a significant difference between the efficiencies of pre-service teachers in the field of patterns based on the programs they attend?
3. Is there a significant difference between the knowledge of pre-service teachers in the field of patterns based on gender?
4. An experimental study with the control and experimental group "Pattern From Simple to Complex" Is there any impact on the success of candidate teachers
2. Methodology
Study Model
The present study is a descriptive study using survey method aiming to scrutinize the levels of knowledge of pre-service teachers in simple-to-complex patterns with reference to certain variables and to investigate the effect of the success of the patterns from simple to complex issues with an experimental study. Survey method is a research approach that aims to describe a case that existed in the past or still in existence. The subject event, individual or the article is attempted to be described as is and under present state of affairs. No efforts are spent to change or influence the subject whatsoever (Karasar, 2005).
Study Participant Pre-service Teachers
A total of 120 pre-service teachers attending four different programs in Dicle University Ziya Gökalp Faculty of Education in 2014-2015 fall semester (30 per program: Classroom Teaching 12 girls/18 boys; Pre-school Teaching 11 girls/19 boys; Sciences Teaching 12 girls/18 boys; Elementary School Mathematics Teaching 11 girls/18 boys) participated in the study. The experimental study of the sampling methods selected in accordance with the group and 64 experimental and 62 control groups of teacher candidates. In the experimental group of four hours a month, a total of 16 hours per week from simple to complex pattern was studied in a mathematics laboratory applications. The control group did not receive any other work of public disclosure.
Data Collection Tools
by researchers; recognition (recognize), animation Bearing in mind (Visualize), oral expression (verbalize), symbolization (symbolize) and analysis (analyzer) was applied to measure skills test consisting of 40 questions. Test the reliability coefficient (K-20) was realized as 0.75.
Analysis of Data
To analyze the data, initially the frequency distribution and means of the data were considered to determine their concentration or dispersal on variables and changes in means based on subjects.
The data file was divided into four sub-files using Split-File, and each was prepared for statistical processing. The measures of central tendency of the data were approximate and test of normality analysis demonstrated that the data displayed normal distribution (p<1). In addition, when the result of the test of homogeneity of variances was examined based on the items, twelve efficiencies were
analyzed using Levene Statistics test bearing in mind the fact that the variances were not equal (p<0.05). One-way ANOVA test was preferred in testing the significant difference between zero and two or more unrelated sample means. Cronbach’s Alpha reliability coefficient for 28 items was found as 8.26. In experimental studies, descriptive and
inferential statistical techniques were applied. T independent of the pre-test and post-test comparison of the experimental and control group test, dependent t tests to compare both groups in their development up to the final test of the pre-test was applied.
3. Findings
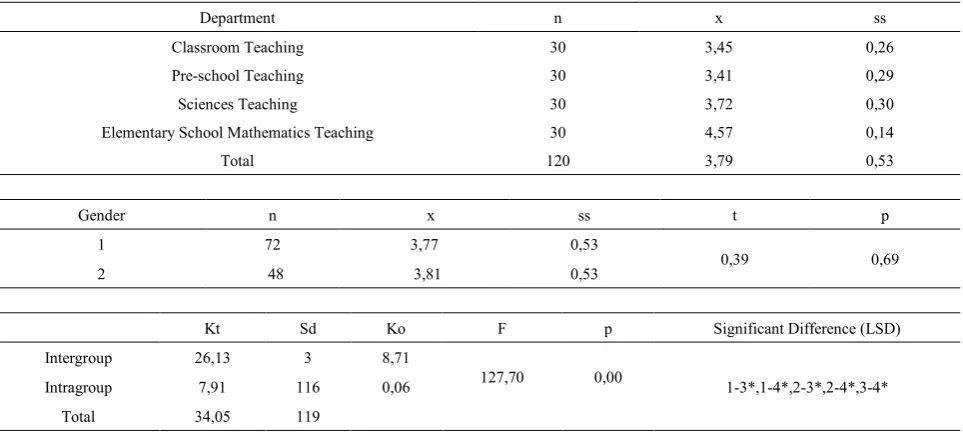
Table 1 demonstrates that Elementary School Mathematics Teaching pre-service teachers were more successful as compared to the average (Elementary School Mathematics X =4,47; Sciences Teaching X=3,72; Classroom Teaching X=3,45; Pre-school Teaching x=3,41), there was no significant difference based on gender (p>0.05), and there were intergroup and intragroup significant differences (p<0.05).
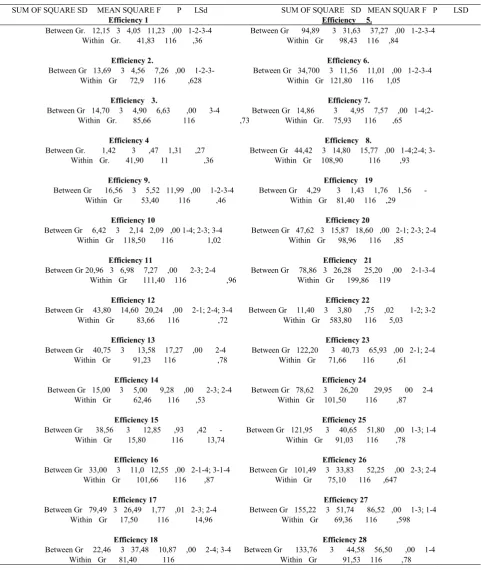
[image:3.595.65.547.386.603.2]Table 2 shows that there were significant differences in findings for 28 pattern efficiencies based on four departments (For example; for Efficiency 28 [ F(3-116)=56,507, P<.01]) and as displayed in the significant differences column in the table, there was a significant difference in dual groups favoring the second group.
Table 1. Distribution of the means of twenty-eight efficiencies related to programs attended and gender variables
Department n x ss
Classroom Teaching 30 3,45 0,26 Pre-school Teaching 30 3,41 0,29 Sciences Teaching 30 3,72 0,30 Elementary School Mathematics Teaching 30 4,57 0,14
Total 120 3,79 0,53
Gender n x ss t p
1 72 3,77 0,53
0,39 0,69 2 48 3,81 0,53
Kt Sd Ko F p Significant Difference (LSD) Intergroup 26,13 3 8,71
127,70 0,00 1-3*,1-4*,2-3*,2-4*,3-4* Intragroup 7,91 116 0,06
Table 2. One-Way Variance Analysis (Anova) Of the Application Of 28 Efficiencies In Four Departments Based On Efficiencies
SUM OF SQUARE SD MEAN SQUARE F P LSd SUM OF SQUARE SD MEAN SQUAR F P LSD
Efficiency 1 Efficiency 5.
Between Gr. 12,15 3 4,05 11,23 ,00 1-2-3-4 Between Gr 94,89 3 31,63 37,27 ,00 1-2-3-4
Within Gr. 41,83 116 ,36 Within Gr 98,43 116 ,84
Efficiency 2. Efficiency 6.
Between Gr 13,69 3 4,56 7,26 ,00 1-2-3- Between Gr 34,700 3 11,56 11,01 ,00 1-2-3-4 Within Gr 72,9 116 ,628 Within Gr 121,80 116 1,05
Efficiency 3. Efficiency 7.
Between Gr 14,70 3 4,90 6,63 ,00 3-4 Between Gr 14,86 3 4,95 7,57 ,00 1-4;2- Within Gr. 85,66 116 ,73 Within Gr. 75,93 116 ,65
Efficiency 4 Efficiency 8.
Between Gr. 1,42 3 ,47 1,31 ,27 Between Gr 44,42 3 14,80 15,77 ,00 1-4;2-4; 3- Within Gr. 41,90 11 ,36 Within Gr 108,90 116 ,93
Efficiency 9. Efficiency 19
Between Gr 16,56 3 5,52 11,99 ,00 1-2-3-4 Between Gr 4,29 3 1,43 1,76 1,56 - Within Gr 53,40 116 ,46 Within Gr 81,40 116 ,29
Efficiency 10 Efficiency 20
Between Gr 6,42 3 2,14 2,09 ,00 1-4; 2-3; 3-4 Between Gr 47,62 3 15,87 18,60 ,00 2-1; 2-3; 2-4 Within Gr 118,50 116 1,02 Within Gr 98,96 116 ,85
Efficiency 11 Efficiency 21
Between Gr 20,96 3 6,98 7,27 ,00 2-3; 2-4 Between Gr 78,86 3 26,28 25,20 ,00 2-1-3-4 Within Gr 111,40 116 ,96 Within Gr 199,86 119
Efficiency 12 Efficiency 22
Between Gr 43,80 14,60 20,24 ,00 2-1; 2-4; 3-4 Between Gr 11,40 3 3,80 ,75 ,02 1-2; 3-2 Within Gr 83,66 116 ,72 Within Gr 583,80 116 5,03
Efficiency 13 Efficiency 23
Between Gr 40,75 3 13,58 17,27 ,00 2-4 Between Gr 122,20 3 40,73 65,93 ,00 2-1; 2-4
Within Gr 91,23 116 ,78 Within Gr 71,66 116 ,61
Efficiency 14 Efficiency 24
Between Gr 15,00 3 5,00 9,28 ,00 2-3; 2-4 Between Gr 78,62 3 26,20 29,95 00 2-4 Within Gr 62,46 116 ,53 Within Gr 101,50 116 ,87
Efficiency 15 Efficiency 25
Between Gr 38,56 3 12,85 ,93 ,42 - Between Gr 121,95 3 40,65 51,80 ,00 1-3; 1-4 Within Gr 15,80 116 13,74 Within Gr 91,03 116 ,78
Efficiency 16 Efficiency 26
Between Gr 33,00 3 11,0 12,55 ,00 2-1-4; 3-1-4 Between Gr 101,49 3 33,83 52,25 ,00 2-3; 2-4
Within Gr 101,66 116 ,87 Within Gr 75,10 116 ,647
Efficiency 17 Efficiency 27
Between Gr 79,49 3 26,49 1,77 ,01 2-3; 2-4 Between Gr 155,22 3 51,74 86,52 ,00 1-3; 1-4 Within Gr 17,50 116 14,96 Within Gr 69,36 116 ,598
Efficiency 18 Efficiency 28
Table 3. Comparison Of Experiment And The Control Group Pre And Post Tests
N X SS t P
Experiment 64 6,53 1,54
pretest 1,48 0,12
control 62 6,82 1,24
Experiment 64 7,42 1,58
Posttest 1,01 0,29
control 62 7,10 1,53
Table 3 when analyzed; The average pre-test of the experimental group (6.53), from the pre-test average of the control group (6.82), although the difference between the two groups was not statistically significant low. This case is considered to be identical in preliminary tests the experimental and control groups. Referring to the average obtained in the last test group; The average of the mean of the experimental group and a control group of 7.42 seems to be 7.10. This difference was not statistically significant.
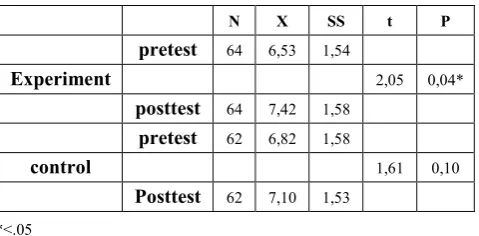
[image:5.595.59.299.402.520.2]Increase in pre-test and post-test experimental and control group average is low. The findings are dependent t-test was applied separately for each group and get to understand that these groups is statistically significant increase in its table 4 are presented.
Table 4. Comparison Of Experiment And The Control Group Change From Pre-Test To Post-Test
N X SS t P
pretest 64 6,53 1,54
Experiment 2,05 0,04*
posttest 64 7,42 1,58 pretest 62 6,82 1,58
control 1,61 0,10
Posttest 62 7,10 1,53 *<.05
Table 4 when analyzed; The average grade of 6.53 7,42'y the application though the experimental group, the control group increased from an average of 6.82 to 7.10. Although the increase is small, increase in the experimental group was statistically significant. (t = 2.05, p> .05).
4. Discussion
Findings of the study reflected that there were no significant differences between the four departments attended and efficiencies 4-15-18-21 (mean differences, F points, p<0.05). When these efficiencies were examined, it could be observed that the pre-service teachers displayed similar success in “filling the blanks”, “finding the different color”, “numerical” and “finding the general rule” patterns (Table 2). It has been observed that the reason behind this finding is the fact that pre-service teachers generally perceive these subjects when the patterns concept is introduced and these subjects were emphasized in the
elementary education. For the remaining 25 efficiencies, it has been observed that there were intergroup and intragroup significant differences based on efficiencies and gender (p<0.05).
pre-service teachers in sciences teaching and elementary school mathematics teaching were more successful (mean difference -0.70).
For the third to fifth grade efficiencies: in the fifteenth efficiency; “let’s count rhythmic”, there was a significant difference between classroom teaching and pre-school teaching-sciences teaching favoring classroom teaching (mean difference 900); between elementary school mathematics teaching and pre-service teachers in pre-school teaching- sciences teaching favoring elementary school mathematics teaching (mean difference 1.30). In the nineteenth efficiency; “geometrical number patterns”, there was a significant difference between classroom teaching and pre-school teaching-elementary school mathematics teaching favoring pre-school and classroom teaching (mean difference 866) and against pre-service teachers in elementary school mathematics teaching (mean difference -0.900); between pre-school teaching and pre-service teachers in science teaching-elementary school mathematics teaching against pre-school teaching (mean difference -1.06). In the twentieth efficiency; “figure-number relation”, a significant difference was noted between classroom teaching-pre-school teaching and science teaching-elementary school teaching favoring the latter couple (mean difference -1.26). There was a significant difference in the twenty-second efficiency; “to determine the relation”, between the classroom teaching and other two departments except elementary school teaching (mean difference 1.36), against with pre-service teachers in elementary school mathematics teaching (mean difference -1.33); between pre-school teaching and sciences teaching-elementary school mathematics teaching favoring elementary school mathematics teaching (mean difference -2.10).
In pattern efficiencies for sixth to eighth grades: in the twenty-third efficiency; “to generalize”, there was a significant difference between elementary school mathematics teaching and other three departments favoring pre-service teachers in elementary school mathematics teaching (mean difference 1.60). In the twenty-fourth efficiency; “to maintain”, there was a significant difference between classroom teaching and other departments against classroom teaching (mean difference 1.43), and between pre-school teaching and sciences teaching-elementary school mathematics teaching against pre-school teaching (mean difference 1.43). In the twenty-fifth efficiency; “problem solving”, there was a significant difference between classroom teaching and pre-school teaching favoring classroom teaching (mean difference 933), between classroom teaching and elementary school mathematics teaching against classroom teaching (mean difference -1.63); and between sciences teaching and elementary school mathematics teaching against pre-service teachers in sciences teaching (mean difference -1.30). In the twenty-sixth efficiency; “to find the rule”, pre-service teachers in classroom teaching were less successful than those in sciences teaching and elementary school
mathematics teaching (mean difference -3.00) and pre-service teachers in elementary school mathematics teaching were more successful than those in sciences teaching (mean difference -2.50). In the twenty-seventh efficiency; “arithmetic and geometric series”, there was a significant difference between classroom teaching and other departments against classroom teaching (mean difference -2.76); between elementary school mathematics teaching and sciences teaching favoring elementary school mathematics teaching (mean difference -2.33). In the twenty-eighth efficiency; “finding the relation”, there was a significant difference between classroom teaching and pre-service teachers in elementary school mathematics teaching favoring elementary school mathematics teaching (mean difference -2.08) (Table 2). In classroom efficiencies for sixth to eighth grades, it has been determined that usually pre-service teachers in elementary school mathematics teaching and sciences teaching were more successful than other groups. This result is in accordance with the statements that “pattern studies are one of the activities implemented in the whole of mathematics and these activities are basic in observing mathematical relations and generalization” (Burns, 2000; Tanişli, Olkun, 2009). Although the patterns are effective in all fields, it could be deemed natural that, being a fundamentally cognitive skill, it results in more success in mathematics and physical sciences.
The subjects where there was a significant difference for the pattern efficiencies in four different departments based on gender were scrutinized. In classroom teaching: there was a significant difference in eleventh efficiency; “patterns based on rhythmic numbers”, between males and females (t=,20, p=,01) and in twenty-sixth efficiency; “to determine the rule”, between the males and females favoring males(t=1,98 , p=,03); in pre-school teaching; in twenty-first efficiency; “to find the general rule”, between the males and females against males ( t=-2,34 , p=.02); in sciences teaching; in second efficiency; “to determine the relation”, between the males and females favoring females ( t=,219 , p=,02); in elementary school mathematics teaching; in second efficiency; “to determine the relation”, between the males and females favoring males (t=2,36 , p=,025), in twenty-first efficiency; “to find the general rule”, between the males and females against the females ( t=2,62 , p=014), in twenty-sixth efficiency; “to determine the rule”, between the males and females favoring the males (t=2,20 , p=,03).
latter factors between efficiency #1 and efficiency #5 ( r=,35; r2=,12),, and efficiency #1 and efficiency #28 ( r=,26 ; r2 =,06). This finding supports the analyses. When the data obtained from twenty-eight pattern efficiencies formed by three different sections for four departments was examined, it has been observed that the means for pre-service teachers in elementary school mathematics teaching program ranged between 3,90-4,93; sciences teaching between 3,20-4,80; preschool teaching between 1,96- 4,33; classroom teaching between 1,80- 4,40. It was not a coincidence that for pre-service teachers in elementary school mathematics teaching program had the most achievement in the fiend of patterns, because the courses they attend empower their thinking skills more than other groups. This result could help determine that patterns that are the basis for mathematical thinking are also form the infrastructure for mathematical skills. Patterns help develop skills such as recognizing a mathematical structure,
visualization, verbalization and analysis (Cathcart, Pothier, Vance and Bezuk, 2003).
All of the work is a work of applied research oriented approach work is done in the math lab. Effectiveness in developing science process skills pre- and post-lab discussions about the addition of teachers from simple to complex patterns of correct candidates were evaluated with experimental work in the laboratory. The results of the laboratory research applications directed to the discussion of preliminary and final laboratory tests showed that the effective inclusion and achievement in the development of the science process skills. Because the average of the experimental group increased only differ significantly from pre-test to post-test. In the literature, it was found that the research-based learning approach is more effective than traditional learning approaches. (Fried & Repair, 1984; Nakipoglu & Meric, 2000; Tatar & Dry 2006). But this difference of this difference, compared with only research method applied to the control group, indicating that there is no difference deal. The pre and posttest experimental work based on the application is considered not create a significant impact causes; the shortening of working hours may be in the lab. Because time is divided into a total of 16 hours a month to work with experimental laboratory work per week for four hours. Therefore, research should be explored using the same pattern in the laboratory practice longer to get more accurate results. It is stated that the scientific process skills takes time (Tan & Clean, 2003). A second cause of the topics covered is thought to be familiar with some of the teachers. Because the correct pattern from simple to complex issues are the topics covered in various positions since elementary school.
5. Results and Suggestions
Examining the competencies of pre-service teachers in the field of patterns demonstrated that their means varied between 1.86 and 5.00, were in a good level, however as the difficulty of the efficiencies and class level increased,
significant differences occurred between the pre-service teachers based on the departments they attended. It could be stated that there were generally no significant difference based on gender, only in seven efficiencies among the total of twenty-eight significant differences were observed between four departments. Thus, the following propositions could be argued based on the findings utilized to answer our initial questions:
1. It has been observed that, with the introduction of the new program, the elementary school curriculum concentrated more on patterns and subjects based on patterns. To empower pre-service teachers more in these fields, a new course covering simple to complex patterns should be introduced in pre-service teacher syllabus.
2. All teachers serving in elementary education should be given in-service training on patterns as soon as possible and independent of their branch of instruction. Related faculty from the colleges should contribute to these training programs.
3. At least one year in order to obtain better results of experimental studies in experimental studies should be performed.
REFERENCES
[1] Baki, A. (2008). Kuramdan Uygulamaya Matematik Eğitimi.
Ankara: Harf EğitimYayinciliği.
[2] Burns, M. (2000). About teaching mathematics. A-K 8 research (2 nd. Ed.) Sausalito, California. CA: Math Solutions Publication.
[3] Berlinghoff, P. W. & Gouvea, Q. F. (2004). Math through the ages: a gentle history for teachers and others. Farmington: Oxton Publishers.
[4] Bidwell, J. (1993). Humanize your classroom with the history of mathematics. Mathematics Teacher, 86(6), 461-464. [5] Bütüner, S. Ö. (2008). Sekizinci Sinif Denklemler
Konusunun Matematik Tarihi Kullanilarak Öğretimi. İlköğretim Online, 7(3), 6-10.
[6] Cathcart, W. G.,Pothier, V.M.,Vance, T.H. ve
Bezuk,N.S.(2003). Learning mathematics in elementary and middle schools. 3rd ed- upper Saddle River, N.J:Merrill/Prentice Hall.5. Ernest, P. (1998). The history of mathematics in the classroom. Mathematics in School, 27(4), 25-31.
[7] English, L., & Warren, E. (1998). Introducing the variable through patternExploration. Mathematics Teacher, 91(2), 166-170.
[10]Hargreaves, M., Threlfall, J., Frobisher, L., & Shorrocks-Taylor, D. (1999).Children's strategies with linear and quadratic sequences. In A. Orton (ed.), Pattern in the teaching and learning of mathematics (pp. 67-83). London: Cassel.
[11]Jankvist, T. U. (2009). A categorization of the whys and hows of using history in mathematics education. Educational Studies in Mathematics, 71, 235-261.
[12]Karakuş, F. (2009). Matematik Tarihinin Matematik
Öğretiminde Kullanilmasi: Karekök Hesaplamada Babil Metodu. Necatibey Eğitim Fakültesi Elektronik Fen ve Matematik EğitimDergisi, 3(1), 195-206.
[13]Karasar, N. (2005). Bilşimsel Araştirma Yöntemi. Ankara: Nobel Yayin Dağitim
[14]Leng, W. N. (2006). Effects of an ancient Chinese mathematics enrichment programme on secondary school students’ achievement in mathematics. International Journal of Science and Mathematical Education, 4, 485-511. [15]Liu, H. P. (2003). Do teachers need to incorporate the history
of mathematics in their teaching? Mathematics Teacher, 96(6), 416-421.
[16]İlköğretim matematik dersi 1-5. Siniflar öğretim programi, Ankara: Devlet Kitaplari Müdürlüğü Basim Evi.
[17]Milli Eğitim Bakanliği [MEB]. (2009b). İlköğretim
matematik dersi 6-8. Siniflar öğretim programi, Ankara: Devlet Kitaplari Müdürlüğü Basim Evi.
[18]McBride, C. C. & Rollins, H. J. (1977). The effects of history
for mathematics on attitudes toward mathematics of college algebra students. Journal for Research in Mathematics Education, 8(1), 57-61.
[19]Mitchell, M. (1995). Mathematical history, activities, puzzles,
stories and games. Virginia: National Council of Mathematics Teacher.
[20]National CDouncil of Teacher of Mathematics (NTCM) (2000). Curriculum evaluation standarts for school mathematics. Retrieved October 25, 2012, from http://www.ntcm.org/standards
[21]Nakipoglu, C. & Meric, G. ( 2000) Genel Kimya Laboratuvarinda V-Diagram Kullanimi ve uygulamalari BAÜ Fen Bilimleri Enstitüsü Dergisi,2 (1),58-75
[22]Orton, A. (1999). Pattern and the approach to algebra. London: Cassell.
[23]Reimer, W. & Reimer, L. (1992). Historical connections in mathematics Volume I. California: AIMS Educational Foundation. Siu, M. K. (2004). “No, I do not use history of mathematics in my class. Why?”. Paper presented at the HPM Satellite meeting, Uppsala.
[24]Reys,R. E., Suydam, M. N..Lindquist M.M. ve Smith. N. L. (1998) Helping children learn mathematics. 5th ed- Boston: Allyn and Bacon.
[25]Stacey, K. (1989). Finding and using patterns in linear generalising problems. Educational Studies in Mathematics, 20, 147-164.