International Journal of Emerging Technology and Advanced Engineering
Website: www.ijetae.com (ISSN 2250-2459, ISO 9001:2008 Certified Journal, Volume 6, Issue 11, November 2016)
37
Development of Correlation between Unsoaked and Soaked
CBR Values
Sriharsha Baditala
1, M. V. S. Sreedhar
2 1Post Graduate Student, 2Assistant Professor, Department of Civil Engineering, Osmania University, Hyderabad-500007, India
Abstract— In the past decade, in India, development of road network was given significant importance as part of infrastructure development. Development of rural roads was taken up in a large scale under PMGSY scheme. Most of these pavements are designed based on soaked CBR value, which inevitably require four days of soaking before the test is performed. Many a times, the project time schedules may not provide allowance for soaking period. This necessitated the Scope for predicting the soaked CBR value based on its un-soaked CBR value.
In view of this, in the present study, underlining the fact that, plasticity of soil under soaking is one of the most influential parameters in predicting the soaked CBR value. Efforts have been made to determine the unsoaked, soaked CBR values together with all the index properties of about ten (10) different soils and efforts have been made to establish correlation. The plasticity characteristics together with particle size distribution have been represented in terms of Group Index of the soil. Efforts have been made to include cohesive, cohesion less and c-Φ soils to ensure general applicability of the correlation. All the tests were performed according to the relevant provisions of IS: 2720.
The correlation to predict soaked CBR value based on unsoaked CBR value and group index of the soil, have shown encouraging results. The experimental results, their analysis, development of correlation and detailed conclusions are presented in the full paper.
Keywords—Coefficient of determination (R2),Excel model, SPSS model, Soaked CBR value ,Soils, Regression.
I. INTRODUCTION
California Bearing Ratio (CBR) value is an important soil parameter for design of flexible pavements and runway of air fields. California bearing ratio (CBR) is an empirical test and widely applied in design of flexible pavement over the world. This method was developed during 1928-29 by the California Highway Department. Use of CBR test results for design of roads, introduced in USA during 2nd World War and subsequently adopted as a standard method of design in other parts of the world, is recently being discouraged in some advanced countries because of the imperialness of the method (Brown, 1996). It can also be used for determination of sub grade reaction of soil by using correlation.
It is one of the most important engineering properties of soil for design of sub grade of rural roads.
CBR value of soil may depends on many factors like maximum dry density (MDD), optimum moisture content (OMC), liquid limit (LL), plastic limit (PL), plasticity index (PI), type of soil, permeability of soil etc. Besides, soaked or unsoaked condition of soil also affects the value. These tests can easily be performed in the laboratory. Correlation coefficient (r) of each of these properties with CBR is determined and their significance is tested by using statistical t- test. Finally a linear multiple regression model was developed by using SPSS determination of CBR value involving the above mentioned soil parameters.
Several studies have been carried out on the predict CBR by using different methods. Black (1962) [1], correlated CBR with grain size distribution of soil and plasticity index (PI). A graph was developed to estimate CBR value using liquid limit (LL) and PI of a soil. In another study. Agarwal and Ghanekar (1970) [2], developed an equation for CBR estimation from optimum moisture content (OMC) and liquid limit (LL) of soils.
Recently Srinivasa Rao (2004) [6] ,developed a correlation between CBR and Group index based on tests on about 150 soil samples covering a wide range of soil types. Sayanarayana and pavani ( 2006) [7], in the pas developed model for Correlation of CBR Values with Soil Index Guide for Mechanistic and Empirical Design for New and Rehabilitated Pavement Structures. Gregory, G.H. and Cross, S.A. 2007 [9].The model devepling based on Correlation of CBR with Shear Strength Parameters. Ramasubbarao, G.V and Siva sankar, G. (2013) [11], Predicting soaked CBR value of fine grained soils using index and compaction characteristics. Dilip kumar, p. (2014) [12],A study of correlation between CBR values with other properties of soils.
International Journal of Emerging Technology and Advanced Engineering
Website: www.ijetae.com (ISSN 2250-2459, ISO 9001:2008 Certified Journal, Volume 6, Issue 11, November 2016)
38
II. METHODOLOGY
In the present study, ten disturbed soil samples were collected from different sites in and around Hyderabad. The methodology includes characterization of the materials used, determination of compaction characteristics as per IS: 2720(Part-VIII)-1980. The CBR values as per IS: 2720 (Part-XVI)-1987. The Grain size analysis as per IS: 2720 (part IV) - 1985. Determination of liquid and plastic limit IS: 2720 (part V) - 1985.
A.Characterisation of Soils:
In the present study, the soils collected from different sites in and around Hyderabad. The index and engineering properties of the soils used in this project are as given in Tables 1 ad 2.
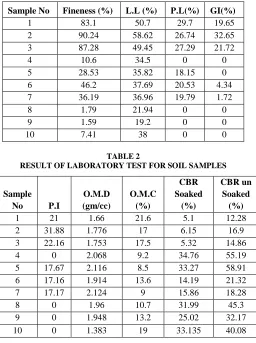
TABLE 1
CONSISTENCY LIMITS AND FINENESS FOR SOIL SAMPLES
Sample No Fineness (%) L.L (%) P.L(%) GI(%) 1 83.1 50.7 29.7 19.65 2 90.24 58.62 26.74 32.65 3 87.28 49.45 27.29 21.72
4 10.6 34.5 0 0
5 28.53 35.82 18.15 0 6 46.2 37.69 20.53 4.34 7 36.19 36.96 19.79 1.72
8 1.79 21.94 0 0
9 1.59 19.2 0 0
[image:2.612.45.301.337.680.2]10 7.41 38 0 0
TABLE 2
RESULT OF LABORATORY TEST FOR SOIL SAMPLES
Sample No P.I
O.M.D (gm/cc)
O.M.C (%)
CBR Soaked
(%)
CBR un Soaked (%) 1 21 1.66 21.6 5.1 12.28 2 31.88 1.776 17 6.15 16.9 3 22.16 1.753 17.5 5.32 14.86 4 0 2.068 9.2 34.76 55.19 5 17.67 2.116 8.5 33.27 58.91 6 17.16 1.914 13.6 14.19 21.32 7 17.17 2.124 9 15.86 18.28 8 0 1.96 10.7 31.99 45.3 9 0 1.948 13.2 25.02 32.17 10 0 1.383 19 33.135 40.08
Where, CBR = California Bearing ratio, LL = Liquid Limit, PL = Plastic Limit, IP = Plasticity Index, OMC = Optimum Moisture Content, MDD = Maximum Dry Density, GI = Group index, F = Fineness.
III. CBRASSESSING MODELS
In the present study, the SPSS and excel programming language used .The correlation is established in the form of an equation of CBR as a function of different soil properties by the method of regression analysis. A study evolved to find the correlation between CBR values with soil index properties that are suitable for Hyderabad city. Comparison is done between the experimental results and calculated results. Statistical Analysis is carried out using SPSS Software version 20.0 and excel programming language.
A. Excel Model Solutions:
In a multi linear regression analysis we study the relationship called the regression function between one variable y called the dependent variable and several others xi.., called the independent variables. Regression function also involves a set of unknown parameters bi. If a regression function is linear in the parameters (but not necessarily in the independent variables) we term it a linear regression model. Otherwise, the model is called non-linear. Linear regression models with more than one independent variable are referred to as multiple linear models, as opposed to simple linear models with one independent variable.
General Formula:
Y = b0+b1X1+b2X2+b3X3+b4X 4 + b5X5 ………….+ biXi
TABLE 3
EXCEL MODEL RESULTS
Model No R2 Adjusted R2 Standard Error
1 0.999 0.999 0.245
2 0.997 0.993 0.977
3 0.987 0.977 1.878
4 0.982 0.967 2.248
5 0.969 0.954 2.687
International Journal of Emerging Technology and Advanced Engineering
Website: www.ijetae.com (ISSN 2250-2459, ISO 9001:2008 Certified Journal, Volume 6, Issue 11, November 2016)
39 Excel Model Equations:
1. CBRS = 46.560 - 0.338 (F) + 0.176 (LL) + 0.457 (PL) -
0.3 (PI) - 14.097 (OMD) - 0.726 (OMC) + 0.243 (GI) + 0.390 CBRUS
2. CBRS = 50.577 0.141 (F) + 0.021 (PI) 15.36 (OMD)
-0.626 (OMC) - 0.044 (GI) + 0.412 CBRUS
3. CBRS = 76.761 - 0.318 (PI) -24 .054 (OMD) - 1.451
(OMC) + 0.411 CBRUS
4. CBRS = 64.985 -0.337 (GI) - 22.795 (OMD) -0.980
(OMC) + 0.459 CBRUS
5. CBRS = 13.271 - 0.075 (LL) - 0.340 (PL) + 0.473 CBRUS
6. CBRS = 13.735 - 0.043 (PI) - 0.153 (F) + 0.422 CBRUS
The given problem can be solved in excel by multiple regression analysis with the help of linest function. After solving in excel we get 6 equations. These equations include the correlation of the all the eight parameters with CBR (soaked) value. All times it is not feasible to get all eight parameters, so we can go for other sets of equation where six, four and three parameters can be considered for obtaining the equations. The eight parameters are Liquid Limit, Plastic Limit, Plasticity Index, Group index, Fines,
Maximum Dry Density, Optimum Moisture Content and CBR (un soaked ) values. The reason behind considering these parameters is CBR value is mainly affected by these parameters as studied in literature and laboratory results. From excel model equations, it is noticed that equations 1, 2, and 3 have give a better performance as it has highest coefficient of the correlation R2 values from the Table:3 is 0.999, 0.997 and 0.997 and least standard errors of 0.245, 0.997 and 1.878. All models the correlation and standard errors are not the same because of correlation quantifies the degree to which dependent and independent variables are related.
B. SPSS Model Solution
SPSS stands for Multiple regressions are an extension of simple linear regression. It is used when we want to predict the value of a variable based on the value of two or more other variables. The variable we want to predict is called the dependent variable (or sometimes, the outcome, target or criterion variable). The variables we are using to predict the value of the dependent variable are called the independent variables (or sometimes, the predictor, explanatory regress or variables). Multiple regressions also allows you to determine the overall fit (variance explained) of the model and the relative contribution of each of the predictors to the total variance explained.
TABLE 4 SPSS MODEL RESULTS
Model No R2 Adjusted R2 Standard Error
1 1.0 1.0 0.245
2 0.999 0.997 0.725
3 0.998 0.994 0.977
4 0.988 0.978 1.878
5 0.998 0.968 2.248
6 0.969 0.954 2.687
7 0.986 0.979 1.802
SPSS Model Equations:
1. CBRS = 46.561 - 0.339 (F) + 0.177 (LL) + 0.458 (PL) -
0.3(PI) - 14.097 (OMD) - 0.727 (OMC) +0.244 (GI) + 0.390 CBRUS
2. CBRS = 35.180 - 0.222 (F) + 0.134 (LL) + 0.06 (PL) -
10.164 (OMD) - 0.387 (OMC) - 0.01 (GI) + 0.397 CBRUS
3. CBRS = 50.577 + 0.021 (PI) 0.045 (GI) 0.142 (F)
-15.366 (0MD) - 0.626 (OMC) + 0.413 CBRUS
4. CBRS = 76.762 - 0.318 (PI) - 24.054 (OMD) - 1.452
(OMC) + 0.411 CBRUS
5. CBRS = 64.986 -22.795 (OMD) -0.98 (OMC) -
0.337(GI) + 0.459 CBRUS
6. CBRS = 13.272 - 0.075 (LL) - 0.34 (PL) + 0.473 CBRUS
7. CBRS = 13.735 - 0.044 (PI) - 0.153 (F) + 0.422 CBRUS
Regression analysis gives the different equations by correlating CBR soaked values with different groups of soil properties. Equations for soaked CBR analyzed give 7 equations which is correlated with Liquid Limit, Plastic Limit, Plasticity Index, Group index, Fines, Maximum Dry Density, Optimum Moisture Content and CBR (un soaked) values.
International Journal of Emerging Technology and Advanced Engineering
Website: www.ijetae.com (ISSN 2250-2459, ISO 9001:2008 Certified Journal, Volume 6, Issue 11, November 2016)
40
IV. MODEL TESTING
The present model testing, the Four soils collected from different sites in and around Hyderabad. The index and engineering properties of the soils used in this project are as given in Tables 5.
TABLE 5
INDEX AND ENGINEERING PROPERTIES OF THE SOILS
Test Data Sample1 Sample2 Sample3 Samle4
Fines (%) 28 13.56 48 87
L.L 34 38.22 35 58
P.L 14.5 20.53 25 18.09
P.I 19.5 17.69 10 39.91
O.M.D(gm/cc) 2.15 2.08 2.185 1.8
O.M.C(%) 8.2 8.8 11.4 17
GI 0.045 0 2.275 45.26
CBR UnSoaked(%) 40.5 48.05 28 13.78
[image:4.612.324.554.155.483.2] [image:4.612.37.300.224.685.2]CBR soaked(%) 22.58 32.87 16.589 4.18
TABLE 6 EXCEL MODEL CHEEK
S/N CBR Soaked Difference (%)
Predicted(X) Accepted(Y) X - Y X -Y/Y
1 22.4 22.88 -0.48 -2.097
2 34.807 32.87 1.937 5.89
3 16.31 15.89 0.42 2.64
4 1.311 4.18 -2.86 -68.42
Finger 1 Excel Correlation Between Acepected CBR Soaked & Predicted CBR Soaked
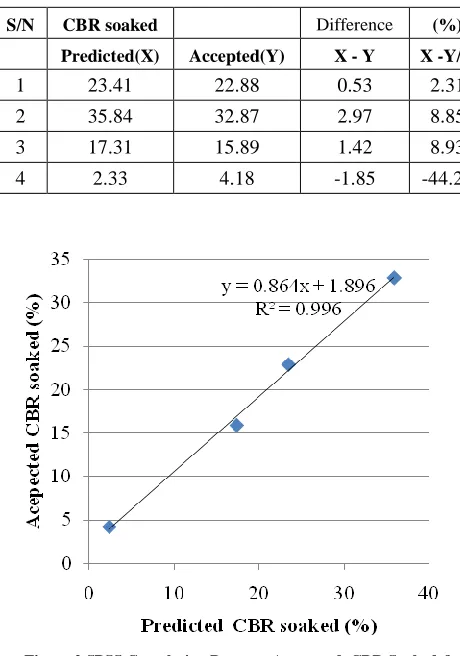
TABLE 6 SPSS MODEL CHEEK
S/N CBR soaked Difference (%)
Predicted(X) Accepted(Y) X - Y X -Y/Y
1 23.41 22.88 0.53 2.31
2 35.84 32.87 2.97 8.85
3 17.31 15.89 1.42 8.93
4 2.33 4.18 -1.85 -44.25
Finger 2 SPSS Correlation Between Acepected CBR Soaked & Predicted CBR Soaked
V. CONCLUSIONS
1. The statistical parameters indicate that the model developed by Multiple Regression Analysis for correlating soaked CBR value with Eight parameters
has shown better performance
2. The other models developed by Multiple regression Analysis for correlating soaked CBR value with CBRUS = California Bearing ratio unsoaked, LL =
Liquid Limit, PL = Plastic Limit, IP = Plasticity Index, OMC = Optimum Moisture Content, MDD = Maximum Dry Density, GI = Group index, have shown relatively good performances.
International Journal of Emerging Technology and Advanced Engineering
Website: www.ijetae.com (ISSN 2250-2459, ISO 9001:2008 Certified Journal, Volume 6, Issue 11, November 2016)
41 4.The statistical parameters indicate that better
performance can be obtained from the SPSS model developed using Multiple Linear Regression Analysis (MLRA) by showing the highest R2 value of 1 and the lowest error of 0 .245
5.After comparing the excel solution and SPSS solution it is observed that the R2 value SPSS model is god in comparison to Excel model. Hence it is preferable to use SPSS solution than excel solution.
REFERENCES
[1] Black, W.P.M. (1962). A Method of Estimating the CBR of
Cohesive Soils from Plasticity Data. Geotechnique. Vol.12, 271 – 272.
[2] Agarwal, K.B. and Ghanekar, K.D. (1970). Prediction of CBR from
Plasticity Characteristics of Soil. Proceeding of 2nd South-east Asian Conference on Soil Engineering, Singapore. June 11-15, Bangkok: Asian Institute of Technology, 571-576.
[3] Carter, M. and Bentley, S. P. (1991). Correlations of Soil Properties.
London: Pentech Press.
[4] National Cooperative Highway Research Program (NCHRP). 2001.
Guide for Mechanistic and Empirical–Design for New and Rehabilitated Pavement Structures, Final Document, Appendix CC-1: Correlation of CBR Values with Soil Index Properties, West University Avenue Champaign, Illinois, USA.
[5] Shukla, S. K. and Kukalyekar, M. P., (2004). Development of CBR
Correlations for the Compacted Fly Ash. Proceedings of the Indian Geotechnical Conference. Warangal, 53-56.
[6] Srinivasa Rao, K. (2004). Correlation between C.B.R. And Group
Index. Proceedings of the Indian Geotechnical Conference. Warangal, 477-480.
[7] Satyanarayana Reddy, C.N.V. and Pavani, K. 2006. Mechanically
Stabilised Soils-Regression Equation for CBR Evaluation, Dec. 14-16, 731-734, Proceedings of Indian Geotechnical Conference-2006, Chennai, India
[8] Roy T.K., Chattopadhyay B.C. and Roy S.K., (2006). Prediction of
CBR for Subgrade of Different Materials from Simple Test., Proc. International Conference on ‗Civil Engineering in the New Millennium – Opportunities and Challenges, BESUS, West Bengal,Vol.-III :2091-2098.
[9] Gregory, G.H. and Cross, S.A. 2007. Correlation of CBR with Shear
Strength Parameters, June 24-27, 1-14, Proceedings of 9th International Conference on Low Volume Roads, Austin, Texas.
[10] Patel, S.R. and Desai, M.D. 2010. CBR Predicted by Index
Properties for Alluvial Soils of South Gujarat, Dec. 1618, 79-82, Proceedings of Indian Geotechnical Conference–2010, India.
[11] Ramasubbarao, G.V., and Siva sankar, G., 2013). ―Predicting soaked
CBR value of fine grained soils using index and compaction characteristics‖, Jordan Journal of Civil Engineering, Volume 7, No. 3, pp-354-360.
[12] Dilip kumar, p,. 2014. ―A study of correlation between CBR values