International Journal of Emerging Technology and Advanced Engineering
Website: www.ijetae.com (ISSN 2250-2459, ISO 9001:2008 Certified Journal, Volume 5, Issue 6, June 2015)
135
Surface Roughness Prediction Model for CNC Turning of
EN-8 Steel Using Response Surface Methodology
Ranganath M S
1, Vipin
2, Harshit
31
Associate Professor, 2Professor, 3Student,
1, 2Production and Industrial Engineering, 3Mechanical Engineering, Delhi Technological University, Delhi, India
Abstract— Due to the widespread use of highly automated machine tools in the metal cutting industry, Manufacturing requires highly reliable models and methods for the prediction of output performance (surface roughness) in the machining process. In this study prediction model of surface roughness has been developed for turning EN-8 steel with uncoated carbide inserts using Response surface methodology (RSM). The model was developed in the form of multiple regression equations correlating dependent parameter surface roughness, with cutting speed, feed rate and depth of cut, in a turning process. The box behnken design was used to plan the experiment. The second order model was found suitable for present work.Moreover a good agreement between the predicted and experimental surface roughness was observed within reasonable limit.
Keywords— Box Behnken Design, Carbide Inserts, EN-8
Steel, RSM, Surface Roughness.
I. INTRODUCTION
EN-8 is a medium carbon steel generally used for manufacturing of crank shafts, automobile axle beams, bolts, studs, connecting rod, lightly stressed gears, various parts of machine tools such as spindle gears, power transmission gears. Physical and mechanical properties of En8 steel are: hardness, 201-255 BHN; yeild strength, 460 N/mm2; melting point, 1500°C; density, 7840 kg/m3; thermal conductivity, 24.7 W/m-°k; and Young’s Modulus, 200x109 N/m2. Some Properties of EN-8 steel like low specific heat, tendency to get strain hardened and diffusion between tool and work material results poor surface finish and built-up-edge formation, thereby making material difficult to machine.
The aim of the present study is to develop a theoretical model for surface roughness using the main cutting parameters such as cutting speed, feed rate, and depth of cut on EN-8 steels using response surface methodology.
A.Response Surface Methodology
International Journal of Emerging Technology and Advanced Engineering
Website: www.ijetae.com (ISSN 2250-2459, ISO 9001:2008 Certified Journal, Volume 5, Issue 6, June 2015)
136
Fig.1: Steps in Response Surface Methodology (RSM). [13](1) To determine the factor levels that will simultaneously satisfy a set of desired specifications,
(2) To determine the optimum combination of factors that yields a desired response and describes the response near the optimum,
(3) To determine how a specific response is affected by changes in the level of the factors over the Specified levels of interest,
(4) To achieve a quantitative understanding of the system behavior over the region tested,
(5) To predict product properties throughout the region, even for a factor combinations not actually run,
(6) To find the conditions necessary for process stability (insensitive spot).
B.To generate contour surface [5]
Response surface methodology, or RSM, is a collection of mathematical and statistical techniques in which a response of interest is influenced by several variables and the objective is to optimize this response. For example, suppose that a chemical engineer wishes to find the levels of temperature (x1) and pressure (x2) that maximize the
yield (y) of a process. The process yield is a function of the levels of temperature and pressure, y = f (x1, x2) +e
Where e represents the noise or error observed in the response y. Then the surface represented by h= f (x1, x2),
which is called a Response surface. We usually represent the response surface graphically, where h is plotted versus the levels of x1 and x2. To help visualize the shape of a
response surface, we often plot the contours of the response surface as well. In the contour plot, lines of constant response are drawn in the x1, x2 planes. Each contour
corresponds to a particular height of the response surface. Objective is to optimize the response
32
Fig.2: To generate contour surface [5]
International Journal of Emerging Technology and Advanced Engineering
Website: www.ijetae.com (ISSN 2250-2459, ISO 9001:2008 Certified Journal, Volume 5, Issue 6, June 2015)
137
The factorial portion is a full factorial design with all factors at three levels, the star points are at the face of the cube portion on the design which correspond to value of -1. This is commonly referred to as a face centered CCD. The center points, as implied by the name, are points with all levels set to coded level 0, the midpoint of each factor range, and this is repeated six times. Twenty experiments to be performed. For each experimental trial, a new cutting edge to be used. The latest version of the Minitab or Design Expert may be used to develop the experimental plan for response surface methodology. The same software can also be used to analyze the data collected.
C.Box-Behnken Design
The Box-Behnken design is an independent quadratic design in that it does not contain an embedded factorial or fractional factorial design. In this design the treatment combinations are at the midpoints of edges of the process space and at the center. These designs are rotatable (or near rotatable) and require 3 levels of each factor. Each design can be thought of as a combination of a two-level (full or fractional) factorial design with an incomplete block design. In each block, a certain number of factors are put through all combinations for the factorial design, while the other factors are kept at the central values. For instance, the Box–Behnken design for 3 factors involves three blocks, in each of which 2 factors are varied through the 4 possible combinations of high and low. It is necessary to include centre points as well.In present work, 4points per block will result in 12 experiments and A few more pointsadded at the centre to give roughly equal precision forresponse. For threeparameters, five additional experiments need to beconducted at the origin.The total number of experiments in the presentwork is 12+5=17 (Fig. 3). Entire experimentationneed not be replicated to find the error mean square,since this can be found out by replicating the centrepoint
Fig.3: Cube [13]
D.Turning Process Parameters[20]
The identified process parameters affecting characteristics of turned parts are: i) Cutting tool parameters–tool geometry and tool material; ii) Work piece related parameters- metallography, hardness, etc.; iii)Cutting parameters- cutting speed, feed rate and depth of cut.
II. METHODOLOGY
E.Experimental Details
1)Work Piece Material:
EN-8 steel was used as work material and its chemical composition is given in table [1]
TABLE1
Chemical Composition of EN-8
2)Cutting Tool:
Uncoated Carbide Insert (CNMG120408 TTR)
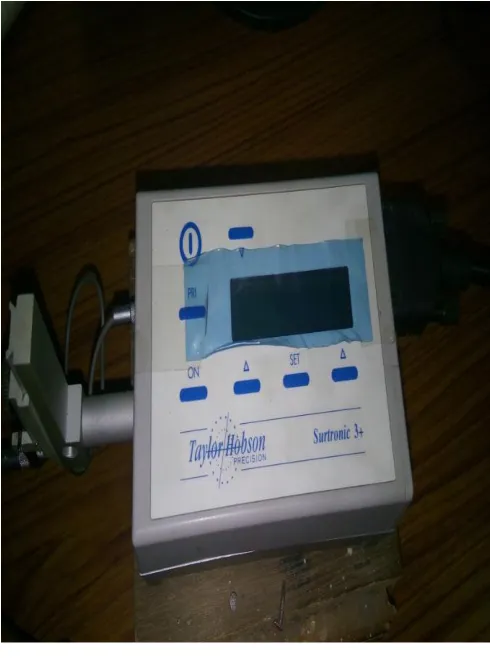
3)Surface Roughness Testing Machine:
The Surface roughness testing machine used for measuring
Surface roughness (Ra) in this experimental analysis was Talysurf Meter (Taylor/Hobson Surtronic 3+) fig.[4].
4)Experimental Set Up:
Turning was carried out on CNC lathe. The various cutting parameters choosed were cutting speed, depth of cut, feed rate. The measurements of average surface roughness (Ra) were taken on talysurf meter (Taylor/Hobson Surtronic 3+).
Three measurements of surface roughness were taken at distance of 100mm per measurement of machined work piece and their average value was used for the further analysis.
EN NO.
E.S.C.
SYMB OL
CHEMICAL COMPOSITION
C% Si% Mn% S
% P%
8 HTC
.35/.45
International Journal of Emerging Technology and Advanced Engineering
Website: www.ijetae.com (ISSN 2250-2459, ISO 9001:2008 Certified Journal, Volume 5, Issue 6, June 2015)
[image:4.612.49.294.135.464.2]138
Fig.4:Surface roughness tester5)Cnc Machine:
The cnc machine used for machining Purpose is of laxmi machine works model number (LL20TL3) .the specification are given in table [2].
6)Factors and Response [4]:
1) Factors taken
A-cutting speed (rpm)
B-Feed rate (mm/min)
C-Depth of cut (mm)
2) Response taken
Y -surface roughness Ra (μm)
TABLE 2
Specification Of Cnc Machine
Title Description Unit LL20T
L3
Capacity Swing over bed mm 510
Chuck dia, max. mm 200
Max turning diameter
mm 320
Max. turning length mm 310
Admit between centres
mm 420
Spindle Spindle nose type A2 – 6
Hole through spindle
mm 61
Cutting speed rpm 3500
Spindle motor power(cont./15min)
kW 7.5/11
Feed system
Cross travel X-axis mm 185
Longitudinal travel Z-axis
mm 370
Rapid traverse rate X/Z-axes
m/min 30 / 30
Turret No. of stations nos 8
Tool shank size mm 25×25
Maximum boring bar dia
mm 40
Turret indexing type Hydraulic
Tailstock Quill dia mm 75
Quill stroke mm 100
Quill taper – MT-4
CNC system
Controller – Fanuc
Machine size
Front x Side mm 2065 X
1925 Machine weight
(Approx)
[image:4.612.313.572.156.649.2]International Journal of Emerging Technology and Advanced Engineering
Website: www.ijetae.com (ISSN 2250-2459, ISO 9001:2008 Certified Journal, Volume 5, Issue 6, June 2015)
[image:5.612.306.580.143.661.2]139
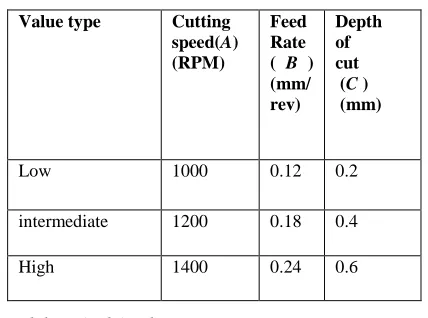
TABLE 3Factors And Their Levels
Value type Cutting
speed(A)
(RPM)
Feed Rate
( B )
(mm/ rev)
Depth of cut
(C )
(mm)
Low 1000 0.12 0.2
intermediate 1200 0.18 0.4
High 1400 0.24 0.6
F.Modeling And Analysis-
Regression and graphical analysis were done using Design Expert 9.0 software (dx9). Goodness of fit test of model was done for analysis of the data. Analysis of variance (ANOVA) was done to test for significance of regression model and on model coefficients, and test for lack of fit i.e.to check model adaquecy.
ANOVA (Analysis of variance)-ANOVA helps us to identify which parameter is important for us after literature review ANOVA table [5] is obtained for Surface roughness. The observations made from the ANOVA table are 1.The Model F-value of 10.58 implies the model is significant 2.There is only a 0.26% chance that an F-value this large could occur due to noise.Values of "Prob> F" less than 0.0500 indicate model terms are significant. 3. In this case A, B, AB, A^2 are significant model terms.4. Values greater than 0.1000 indicate the model terms are not significant.
TABLE 4
Experimental Values Of Surface Roughness
Factor 1 Factor 2 Factor 3 Response Y
Run A:CUTTING
SPEED
B:DEPTH
OF CUT C:FEED RATE ROUGHNESS
RPM mm mm/rev m
1 1200 0.2 0.12 1.59
2 1000 0.2 0.18 2.92
3 1200 0.4 0.18 1.05
4 1200 0.2 0.24 1.81
5 1400 0.4 0.24 0.935
6 1200 0.4 0.18 1.05
7 1000 0.4 0.24 1.69
8 1200 0.4 0.18 1.05
9 1400 0.4 0.12 0.901
10 1200 0.4 0.18 1.05
11 1200 0.4 0.18 1.05
12 1000 0.6 0.18 1.59
13 1200 0.6 0.12 0.6
14 1400 0.2 0.18 0.693
15 1200 0.6 0.24 0.945
16 1400 0.6 0.18 1.01
[image:5.612.61.275.155.314.2]International Journal of Emerging Technology and Advanced Engineering
Website: www.ijetae.com (ISSN 2250-2459, ISO 9001:2008 Certified Journal, Volume 5, Issue 6, June 2015)
[image:6.612.306.564.110.674.2]140
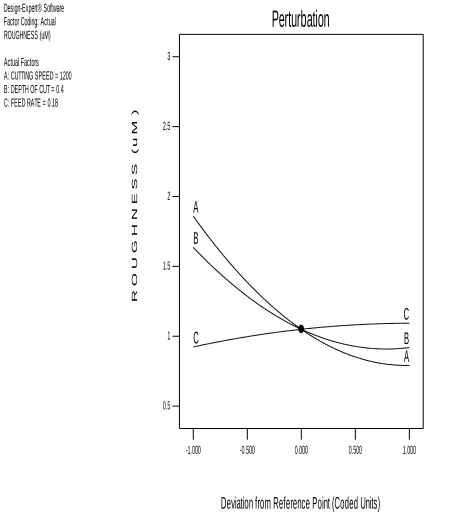
Fig.5: Normal probability plot residuals for surface roughness [image:6.612.59.274.144.341.2]Fig.6: Plot for direct effect of various factors on surface roughness
TABLE 5 Anova Table
ANOVA for Response Surface Quadratic model
Analysis of variance table [Partial sum of squares-Type III]
Sum of Mean F
p-value
Source Squares df Square Value Prob>
F
Model 4.62 9 0.51 10.58 0.0026 Significant
A-CUTTING
SPEED
2.28 1 2.28 47.01 0.0002
B-DEPTH
OF CUT 1.03 1 1.03 21.20 0.0025
C-FEED
RATE 0.058 1 0.058 1.19 0.3118
AB 0.68 1 0.68 13.98 0.0073
AC
5.290E-004 1
5.290E-004 0.011 0.9198
BC
3.906E-003 1
3.906E-003 0.081 0.7848
A^2 0.32 1 0.32 6.59 0.0372
B^2 0.22 1 0.22 4.50 0.0715
C^2
7.252E-003 1
7.252E-003 0.15 0.7105
Residual 0.34 7 0.049
Lack of Fit 0.34 3 0.11
Pure Error 0.000 4 0.000
Cor Total 4.96 16
TABLE 6 R-Squared Test
Std. Dev. 0.22 R-Squared 0.9315
Mean 1.27 Adj R-Squared 0.8434
C.V. % 17.38 Pred R-Squared -0.0960
PRESS 5.43 Adeq Precision 12.910
Design-Expert® Software ROUGHNESS
Color points by value of ROUGHNESS:
2.92
0.6
Externally Studentized Residuals
N
o
r
m
a
l
%
P
r
o
b
a
b
il
it
y
Normal Plot of Residuals
-8.00 -6.00 -4.00 -2.00 0.00 2.00 4.00 6.00 8.00
1 5 10 20 30 50 70 80 90 95 99
Design-Expert® Software Factor Coding: Actual ROUGHNESS (uM)
Actual Factors A: CUTTING SPEED = 1200 B: DEPTH OF CUT = 0.4 C: FEED RATE = 0.18
-1.000 -0.500 0.000 0.500 1.000 0.5
1 1.5 2 2.5 3
A
A B
B C
C
Perturbation
Deviation from Reference Point (Coded Units)
R
O
U
G
H
N
E
S
S
(
u
M
[image:6.612.52.284.383.645.2]International Journal of Emerging Technology and Advanced Engineering
Website: www.ijetae.com (ISSN 2250-2459, ISO 9001:2008 Certified Journal, Volume 5, Issue 6, June 2015)
141
A negative "Pred R-Squared" implies that the overall mean is a better predictor of our response than the current model."AdeqPrecision"measures the signal to noise ratio. A ratio greater than 4 is desirable.Our ratio of 12.910 indicates an adequate signal. This model can be used to navigate the design space. Normal probability plot of the residuals for SR (Fig. 4) indicates that residuals are falling on a straight line, indicating that the errors are normally distributed.
G.Regression Equation-
Regression equation obtained using designexpert 9 software for surface roughness Ra (Y) as
R
a= 20.09262-0.023144× s -19.16875×d +5.67292×f
+0.010294× s × d -9.58333E-004 × s × f + 2.60417 × d × f +6.88750E-006× s2 +5.69375 x d2-11.52778 x f2
III. RESULTS AND DISCUSSIONS
The interaction effect of process parameters on the surface roughness is discussed below.
Fig.7: Surface interaction dimensional views and view of cutting speed and depth of cut over surface roughness
Fig7 shows the interaction and direct effect of depth of cut and cutting speed on surface roughness. The above interaction figure evidenced that the cutting speed and depth of cut on the surface roughness of turning process has a significant effect.
From the Fig7it has been concluded that the lower cutting speed(1000 rpm) with the increase in depth of cut(0.2 to 0.6 mm) has a significant effect on surface roughness (2.8-1.25μm) whearesat higher cutting speed (1400rpm) with the increase in depth of cut (0.2 to 0.6 mm) has no significant effect on surface roughness (0.84 to 0.73μm). The conclusion can also be verified fromthe ANOVA table5.
Fig.8: Surface interaction dimensional views and Direct effect views of feed rate and depth of cut Over surface roughness
Fig.8 shows the interaction and direct effect of feed rate and depth of cut on surface roughness. The above interaction figure evidenced that the feed rate and depth of cut on the surface roughness of turning process has a significant effect. From the Fig.8 it has been concluded that at higher feed rate with increase in depth of cut the surface roughness deceases whereas lower feed rate and depth of cut decreases the surface roughness more significantly. To obtain the quality surface of Ra between 0.75 and 0.80 feed rate less than 0.18 and depth of cut less than 0.6 should be preferred.
The interaction fig.9 evidenced that the cutting speed and feed rate on the surface roughness of turning process has a significant effect. As the cutting speed increases from 1000 rpm to 1400 rpm the surface roughness value is reduced from 2.8 to 0.6 μm, where feed rate has the inverse relationship on surface roughness compared to the cutting speed. From the result it is concluded that thechange in feed rate (0.12-0.24 mm/rev) has asignificant effect on surface roughness (1.5-1.9μm)at lower cutting speed(1000rpm) whereas the change in feed rate (0.12-0.24 mm/rev) has no significant effect on surface roughness (0.62-0.7μm)at higher cutting speed (1400 rpm).
Design-Expert® Software Factor Coding: Actual ROUGHNESS (uM)
Design points above predicted value
Design points below predicted value
X1 = A: CUTTING SPEED X2 = B: DEPTH OF CUT
Actual Factor C: FEED RATE = 0.18
0.2
0.3
0.4
0.5
0.6
1000 1100 1200 1300 1400 0 0.5 1 1.5 2 2.5 3
R
O
U
G
H
N
E
S
S
(
u
M
)
A: CUTTING SPEED (RPM) B: DEPTH OF CUT (mm)
Design-Expert® Software Factor Coding: Actual ROUGHNESS (uM)
Design points above predicted value
Design points below predicted value
X1 = B: DEPTH OF CUT X2 = C: FEED RATE
Actual Factor A: CUTTING SPEED = 1200
0.12 0.15 0.18 0.21 0.24
0.2 0.3 0.4 0.5 0.6 0
0.5 1 1.5 2 2.5 3
R
O
U
G
H
N
E
S
S
(
u
M
)
International Journal of Emerging Technology and Advanced Engineering
Website: www.ijetae.com (ISSN 2250-2459, ISO 9001:2008 Certified Journal, Volume 5, Issue 6, June 2015)
142
[image:8.612.348.564.149.548.2]The conclusioncan also be verified from the ANOVA table 5.
Fig.9: Surface interaction dimensional views and Direct effect views of cutting speed and feed rate over surface roughness.
Validation of The Model-
The confirmatory test is conducted and regression model has been developed using box- behnken design of RSM are verified. Table 7 shows the comparison of predicted versus experimental value of surface roughness. The experimental values are found to be within 95% confidence interval which shows the validity of the model.
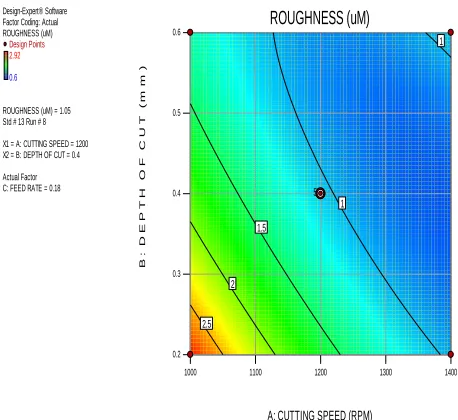
[image:8.612.55.272.153.338.2]Fig.10: Contour plot for cutting speed and depth of cut
TABLE 7 Verification Of Experiments
IV. CONCLUSIONS
On the basis of the experimental results and derived analysis, the studies may be concluded as below:
The consequences of the experimental data is used for predicting the outcome of assorted input machining parameters suchas cutting speed, feed and depth of cut on the surface roughness when machining EN-8 using carbide insert.
A quadratic equation is developed and projected.
Cutting speed has the strongest effect on the surface roughness among the selected parameters; it is inversely proportional to the response.
Surface roughness is inversely proportional to depth of cut
Design-Expert® Software Factor Coding: Actual ROUGHNESS (uM) X1 = A: CUTTING SPEED X2 = C: FEED RATE Actual Factor B: DEPTH OF CUT = 0.378378
0.12 0.15 0.18 0.21 0.24
1000 1100
1200 1300
1400 0
0.5 1 1.5 2 2.5 3
R
O
U
G
H
N
E
S
S
(
u
M
)
A: CUTTING SPEED (RPM) C: FEED RATE (mm/rev)
Design-Expert® Software Factor Coding: Actual ROUGHNESS (uM)
Design Points
2.92
0.6
ROUGHNESS (uM) = 1.05 Std # 13 Run # 8
X1 = A: CUTTING SPEED = 1200 X2 = B: DEPTH OF CUT = 0.4
Actual Factor C: FEED RATE = 0.18
1000 1100 1200 1300 1400
0.2 0.3 0.4 0.5 0.6
ROUGHNESS (uM)
A: CUTTING SPEED (RPM)
B
:
D
E
P
T
H
O
F
C
U
T
(
m
m
)
1
1
1.5
2
2.5
5
Run
Experimental value of roughness
Predicted value of roughness
Error percent
m m %
1 1.59 1.455 8.8
2 2.92 2.857 2.12
3 1.05 0.884 14.4
4 1.81 1.694 6.4
5 0.935 0.759 18.4
6 1.05 1.05 0
7 1.69 1.91 -11.5
8 1.05 .884 14.4
9 0.901 0.688 23.4
10 1.05 0.884 14.4
11 1.05 0.884 14.4
12 1.59 1.317 17.4
13 0.6 .762 -21.2
14 0.693 0.906 -23.5
15 0.945 0.994 -4.9
16 1.01 1.073 -5.8
[image:8.612.53.282.463.673.2]International Journal of Emerging Technology and Advanced Engineering
Website: www.ijetae.com (ISSN 2250-2459, ISO 9001:2008 Certified Journal, Volume 5, Issue 6, June 2015)
143
Surface roughness shows little variation with feedrate.it is directly proportional to feed rate.
Surface roughness is affected by factors in order as cutting speed followed by depth of cut.
A good surface roughness was obtained atthe feed rate (0.12-0.15 mm/rev) andcutting speed (1200-1400 rpm).
The change in feed rate (0.12-0.24 mm/rev)has a significant effect on surface roughness(1.5-1.9μm) at lowercutting speed(1000rpm).
The change in feed rate (0.04-0.08mm/rev) has no significant effect on surfaceroughness (0.62-0.70μm) at highercutting speed (1400 rpm).
A feed rate less than 0.16 and depth of cutfrom 0.5 to 0.6mm have been preferred forobtaining good surface finish.
REFERENCES
[1] Abhang. L. B and Hameedullah. M, Optimal Machining Parameters
for Achieving the Desired Surface Roughness in Turning of Steel,TJER, Vol. 9, No. 1,2012,pp. 37-45
[2] Alagarsamy S.V, RajakumarN.Analysis of Influence of Turning
Process Parameters on MRR & Surface Roughness Of AA7075 Using Taguchi’s Method and Rsm”International Journal of Applied Research and Studies (iJARS) ,Volume 3, Issue 4, 2014.
[3] Aruna. M and Dhanalaksmi. V, Design Optimization of Cutting
Parameters when Turning Inconel 718 with Cermet Inserts, World Academy of Science, Engineering and Technology ,vol. 61, 2012.
[4] Basha N.Z., Vivek S. Optimization of CNC Turning Process
Parameters on Aluminium 6061 Using response surface
methodology IRACST – Engineering Science and Technology: An International Journal (ESTIJ), vol. xxx, no. xxx,2013.
[5] Hae-Jin C., Response Surface Methodology
(Ch.10.RegressionModeling Ch.11.ResponseSurfaceMethodology) School of Mechanical Engineering, Chung-Ang University.
[6] Hwang. Y. K and Lee. C. M, Surface roughness and cutting force
prediction in MQL and wet turning process of AISI 1045 using design of experiments, Journal of Mechanical Science and Technology,vol. 24,issue. 8 ,2010,pp.1669~1677
[7] Kandananond.K, The Determination Of Empirical Model For
Surface Roughness In Turning Process Using Design Of Experiment, vol., 8,issue. 10, 2009 ,
[8] Lin W.S., Lee B.Y., Wu C.L., Modeling the surface roughness and
cutting force for turning. J. Mater. Process. Technol.vol. 108, 2001, pp. 286–293.
[9] Montgomery, D.C., . Design and Analysis of Experiments, Wi1ey,
New York,4th ed.,1997
[10] Motorcu, A. R.: Surface Roughness Evaluation When Machining
Carbon Steel With Ceramic Cutting Tools,
UludağÜniversitesiMühendislik-MimarlıkFakültesiDergisi, Cilt 14, Sayı 1, 2009
[11] Noordin MY, Venkatesh VC, Sharif S, Elting S, Abdullah A.
Application of response surface methodology in describing the performance of coated carbide tools when turning AISI 1045 steel. Journal of Materials Processing Technology. Vol. 1 issue 1, 2004,pp 46-58.
[12] Rafai N. H. and Islam M. N, An Investigation Into Dimensional
Accuracy And Surface Finish Achievable In Dry Turning, Machining Science and Technology, Volume 13, Issue 4, 2009,pp 571-589,
[13] Ranganath M S, Vipin, Harshit,Optimization of Process Parameters
in Turning Operation Using Response Surface Methodology: A Review,International Journal of Emerging Technology & Advanced Engg., Volume 4, Issue 10,october 2014
[14] Ranganath M S and Vipin, Effect of Machining Parameters on
Surface Roughness with Turning Process- Literature Review, International Journal of Advance Research and Innovation, Volume 2, 2014,pp 531-536,
[15] Ranganath M S and Vipin, Optimization of Process Parameters in
Turning Operation Using Taguchi Method and Anova: A Review, International Journal of Advance Research and Innovation, Volume 1, 2013,pp 31-45
[16] Ranganath M S, Vipin, Nand Kumar and R. Srivastava Surface
Finish Monitoring in CNC Turning Using RSM and Taguchi Techniques International Journal of Emerging Technology and Advanced Engineering Website: www.ijetae.com, ISO 9001:2008 Certified Journal, Volume 4, Issue 9, 2014.
[17] Sahin. Y, Motorcu. A. R , Surface roughness model in machining
hardened steel with cubic boron nitride cutting tool International Journal of Refractory Metals & Hard Materials vol.26,2008,pp.84-90
[18] Sahoo P., Optimization Of Turning Parameters For Surface
Roughness Using RSM and GA,Advances in Production Engineering & Management vol.6 ,2011,pp.197-208
[19] Sastry. M N P and. Devi. K D, Optimization of Performance
Measures in CNC Turning using Design of Experiments(RSM) , Science Insights: An International Journal vol. 1 (1),2011,pp.1-5
[20] Singh H., Kumar P.,Mathematical Models Of Tool Life And Surface
Roughness For Turning Operation Through Response Surface Methodology, Journal Of Scientific & Industrial Research Vol. 66, March 2007, Pp. 220-226
[21] Srinivasan, A.,R.M. Arunachalam, S. Ramesh and J.S.
Senthilkumaar, Machining Performance Study on Metal Matrix Composites-A Response Surface Methodology Approach, American Journal of Applied Sciences vol. 9 issue 4,2012,pp.478-483
[22] Stanimir. A, Regressions Modeling Of Surface Roughness In Finish
Turning Of Hardened 205cr115 Steel Using Factorial Design Methodology Fiabilitate Si Durabilitate - Fiability& Durability No 1(7),2011,Editura “AcademicaBrâncuşi” , Târgu Jiu
[23] Subramanian M. et ellUsing RSM and GA to Predict Surface
Roughness Based on Process Parameters in CNC Turning of AL7075-T6. International Journal of Innovative Research in Science, Engineering and Technology Volume 3, Special Issue 3, 2014
[24] Vipin and Kumar. H, Surface Roughness Prediction Model by