comment
reviews
reports
deposited research
interactions
information
refereed research
Research
Strong-association-rule mining for large-scale gene-expression
data analysis: a case study on human SAGE data
Céline Becquet*, Sylvain Blachon*, Baptiste Jeudy
†
, Jean-Francois
Boulicaut
†
and Olivier Gandrillon*
Addresses: *Equipe Signalisations et identités cellulaires, Centre de Génétique Moléculaire et Cellulaire CNRS UMR 5534, Université Claude Bernard Lyon 1, 16 rue Dubois, F-69622 Villeurbanne cedex, France. †Laboratoire d’Ingénierie des Systèmes d’Information, Institut National des Sciences Appliquées de Lyon, Bâtiment Blaise Pascal, F-69621 Villeurbanne cedex, France.
Correspondence: Olivier Gandrillon. E-mail: [email protected]
Abstract
Background: The association-rules discovery (ARD) technique has yet to be applied to gene-expression data analysis. Even in the absence of previous biological knowledge, it should identify sets of genes whose expression is correlated. The first association-rule miners appeared six years ago and proved efficient at dealing with sparse and weakly correlated data. A huge international research effort has led to new algorithms for tackling difficult contexts and these are particularly suited to analysis of large gene-expression matrices. To validate the ARD technique we have applied it to freely available human serial analysis of gene expression (SAGE) data.
Results: The approach described here enables us to designate sets of strong association rules. We normalized the SAGE data before applying our association rule miner. Depending on the discretization algorithm used, different properties of the data were highlighted. Both common and specific interpretations could be made from the extracted rules. In each and every case the extracted collections of rules indicated that a very strong co-regulation of mRNA encoding ribosomal proteins occurs in the dataset. Several rules associating proteins involved in signal transduction were obtained and analyzed, some pointing to yet-unexplored directions. Furthermore, by examining a subset of these rules, we were able both to reassign a wrongly labeled tag, and to propose a function for an expressed sequence tag encoding a protein of unknown function.
Conclusions: We show that ARD is a promising technique that turns out to be complementary to existing gene-expression clustering techniques.
Published: 21 November 2002
GenomeBiology2002, 3(12):research0067.1–0067.16
The electronic version of this article is the complete one and can be found online at http://genomebiology.com/2002/3/12/research/0067 © 2002 Becquet et al., licensee BioMed Central Ltd
(Print ISSN 1465-6906; Online ISSN 1465-6914)
Received: 19 December 2001 Revised: 2 July 2002 Accepted: 25 September 2002
Background
We are now entering the post-genome era and it seems obvious that, in a near future, the critical need will not be to generate data, but to derive knowledge from huge datasets
The kind of raw data in which we are interested can be con-sidered as a matrix, denoted as G, of real numbers (Table 1). The rows denote different samples or conditions, such as the same cell type in different biological situations, and are indi-cated in this hypothetical example by Greek letters. The columns, indicated by letters, denote genes. In practice, we can have hundreds of lines and thousands of columns. G[␣,c] denotes the quantitative expression of gene c in the situation ␣. Table 1 shows a model matrix that we will use in our explanations later.
Most of the available gene-expression data-analysis methods are based on clustering algorithms that try to establish syn-expression groups [1], that is, groups of genes whose expres-sion is correlated in different biological situations. The basis for all clustering algorithms is their ability to generate groups of genes that fulfill two related constraints: intra-group similarities should be maximized and interintra-group simi-larities should be minimized.
Although such algorithms have been quite successful, most notably in the molecular profiling of human cancers [2], their biological validity can be questioned when the identifi-cation of molecular networks is the goal. In this context, they have three main drawbacks. First, a gene which functions in numerous physiological pathways, such as that for the p53 protein [3], will have to be clustered in one and only one group. Second, no relationship can be inferred between the different members of a group. That is, a gene and its target genes will be co-clustered, but the type of relationship cannot be rendered explicit by the algorithm. Third, most clustering algorithms will make comparisons between the gene-expression patterns in all the conditions examined. They will therefore miss a gene grouping that only arises in a subset of cells or conditions.
To overcome these problems, we investigated the potential impact of the association-rule discovery (ARD) technique.
This is an unsupervised data-mining technique that seeks descriptive rules in potentially very large datasets [4]. This method should resolve the above drawbacks of existing clus-tering approaches for the following reasons. First, any gene can be assigned to any number of rules as long as its expres-sion fulfills the assignation criteria. This means that a gene involved in many synexpression groups will appear in each and every one of those groups, without limitation. Second, rules are orientated (If … then …) and thus to a certain extent describe the direction of a relationship. For example, a gene encoding a transcription factor should appear in the left portion of the rule and its target genes in the right portion. Third, by exploring low values of frequency, one can identify rules that are true in only a limited number of cells or situations. This means that if, in the overall dataset, a spe-cific subset of cells exhibit highly characteristic patterns of gene expression, the algorithm should be able to detect it. Last but not least, by focusing on strong rules, the biologist does not have to browse and study a huge number of redun-dant rules.
Contribution
In this paper we evaluate the ARD for generating synexpres-sion groups from large gene-expressynexpres-sion matrices. The kind of rule we wish to discover is, for example, ‘When gene a and gene b are overexpressed within a situation, then often gene c is overexpressed too’. Such a rule will be designated valid. If it is also discovered that genes a, b and c are often overex-pressed in various situations, then the rule would be desig-nated frequent. The user simply defines thresholds for ‘frequent enough’ and ‘valid enough’, but no other informa-tion is needed. An associainforma-tion-rule miner then identifies every rule that is frequent and valid according to these user-defined thresholds. This is clearly unsupervised data mining. This process is quite complex, especially when the number of columns is very large, which is typical of gene-expres-sion data. Indeed, the number of potential rules increases exponentially with respect to the number of columns, and it rapidly becomes impossible to enumerate these rules and check if they are frequent and valid. As well as this aspect of complexity, it is also necessary to consider that not all the frequent and valid rules may be interesting to the biol-ogist. A second processing phase will be required to iden-tify the most promising rules first. Here again, however, we assume that this concept of ‘promising’ cannot be deter-mined in advance.
We assessed the potential of the ARD technique by using the Min-Ex approach (see below), which provides an elegant solu-tion for eliminating redundant associasolu-tion rules. This has been recognized as a major improvement in the standard association-rule mining technique [5]. As this improvement should greatly facilitate the extraction of interesting rules from very large, densely correlated and highly dimensional data, we used ARD with Min-Ex for analyzing publicly available data Table 1
Example matrix for gene-expression data
a b c d
␣ 22 73 57 17
 57 32 64 21
␥ 41 83 21 23
␦ 65 81 59 70
⑀ 18 79 56 64
52 39 59 16
30 76 61 65
comment
reviews
reports
deposited research
interactions
information
refereed research
obtained by serial analysis of gene expression (SAGE) in human cells [6,7].
Results
SAGE is an experimental technique designed to quantify gene expression [8]. This technique produces 10-base sequences, or ‘tags’, that identify one (or more) mRNAs. The frequency of each tag in the overall produced sequence reflects the cel-lular abundance of the corresponding transcript(s).
SAGE data have been poorly exploited by data-mining tech-niques so far; we are aware of only one study on the com-plete set of data [9]. One obvious reason for such poor exploitation lies in the structure of the data, including a high error rate for low-frequency tags (and especially tags appear-ing only once in a library), and a very high dimensionality.
The use of different approaches for generating the boolean values (see below) that indicate whether a gene is overex-pressed or not solves the problem of low-frequency tags. Furthermore, the Min-Ex algorithm that is implemented in the ac-miner software we used has been designed for han-dling huge and highly dimensional datasets.
We explored the validity of the association-rule technique after generating different types of boolean matrices and comparing the rules extracted in each case. We also com-pared the data we obtained with those obtained through ‘tra-ditional’ clustering, and conclude that clustering and association rules can be seen as complementary.
Introducing the raw data
The SAGE data were downloaded through ftp [10] as of June 2001. We downloaded: the tags_freq files (list of unique tags with frequency seen [11]), the description files [12] and a
Stats.txt spreadsheet file [13] containing various information regarding the libraries, and establishing a link between the tags_freq files and the description files.
The minimal transcriptome set was generously provided as an Excel file by V. E. Velculescu (Johns Hopkins Oncology Center, Baltimore). This consisted of 1,183 tags, their expres-sion values in different tissues and their identification. Preprocessing raw data and preparing the boolean context
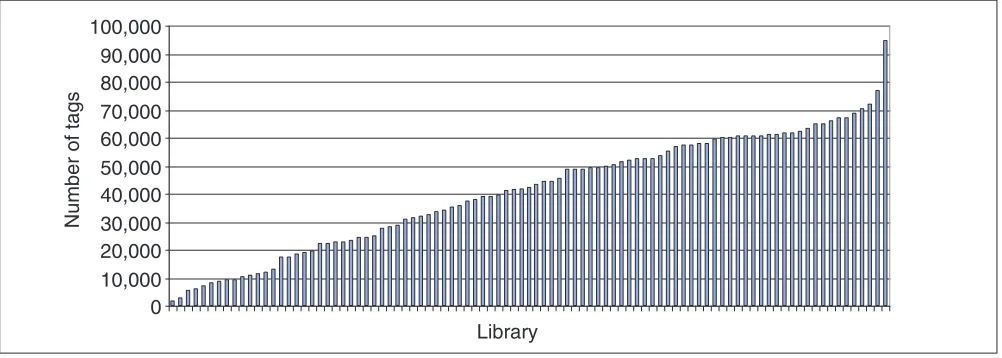
[image:3.609.56.557.531.710.2]We used only the human SAGE libraries that were found in the Stat.txt file. This left us with 93 libraries. So that we would not have to analyze the situation created by missing data we limited ourselves to the genes belonging to the minimal transcriptome set [14]. We understood this set as being genes that should be found in each and every human library analyzed. This was not the case, and the vast majority of those tags were not found in one or other library. As this might be due to the very small size of some libraries (Figure 1), we tested the percentage of missing tags as a function of library size. The smaller libraries (less than 20,000 tags) indeed harbored a very high percentage of missing tags. Using a cutoff value of 20,000 sequenced tags, we obtained a frequency of missing tags of 8%. This value was not considerably modified when a much higher cutoff value (50,000 tags, 5% missing tags) was applied; this value, however, resulted in a great loss of information. We there-fore decided to use the 74 libraries that displayed more than 20,000 tags, and we decided to give a value of zero when a given tag was missing in a given library. As our approach is based on the use of a cutoff value (see below) we feel quite confident that this should have only a marginal effect, if any, on the output. Furthermore, the resulting expression profiles did not display any aberrant form due to the use of the null value (see below).
Figure 1
Size distribution among the 93 SAGE human libraries, in overall number of sequenced tags.
Library
Number of tags
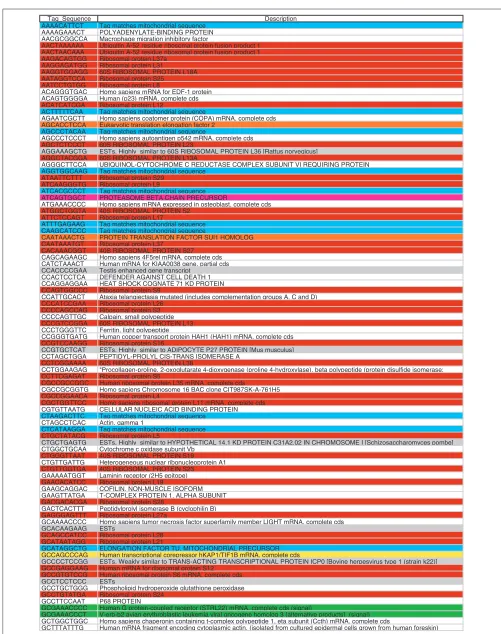
Finally, we re-established a strictly minimal transcriptome set containing tags found in each and every library with more than 20,000 tags (Figure 2). This set contained 156 tags, among which we found 56 representing genes encoding ribosomal proteins, and 15 representing genes involved in translation processes. Of the original 1,183 tags belonging to the minimal transcriptome, 361 were found to represent ambiguous tags (a single tag sequence matching more than one gene description) in the original Velculescu Excel file. Those 361 ambiguous tags were discarded. We therefore continued with a list of 822 non-ambiguous tags.
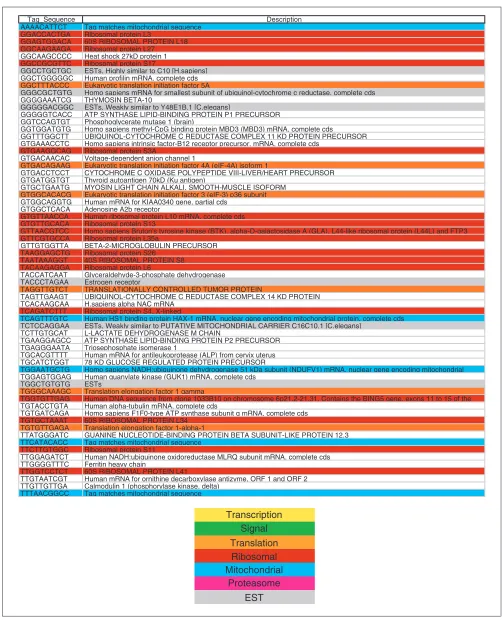
The original tags_freq files contained the following informa-tion: a list of tag sequences, and the number of times each sequence was found in the library. Because the actual library size is highly variable (Figure 1), such sequences could not be compared without normalization. We used the same normal-ization approach as previously described [9]: the tags_freq value was divided by the total number of tags in the library and multiplied by 300,000, the estimated number of RNAs per cell [14]. The final dataset therefore contained the nor-malized expression value, expressed as transcripts per cell, for 822 genes in 74 human cell types. Such a matrix is very useful in order to explore the expression profiles of various genes in different cell types. We therefore established these profiles for a number of genes (Figure 3). Two tendencies are immediately apparent from those patterns.
One is that the addition of null values (the absence of tags from some libraries) did not result in the generation of an aberrant point (Figure 3a-c). The pattern generated was very similar to the one generated for the tags belonging to the strictly minimal transcriptome set, that is, those for which no missing data were found (Figure 3d-e). All the patterns dis-played a markedly skewed distribution toward the smallest values, which may directly result either from sequencing errors or from insufficient sequencing effort. This bias should be minimized when creating the boolean matrix (see below).
All the genes, whether belonging to the strictly minimal transcriptome set or not, display highly variable expression levels (ranging for example from 3 to 433 copies per cell for the GAPDH gene; Figure 3e). Such a high level of variation creates very interesting conditions for creating the boolean matrix. We verified that this very high dynamic range of GAPDH expression was not an artifactual result produced by large differences in library sizes by plotting the number of observed GAPDH tags as a function of library size (Figure 3g). Clearly, no correlation could be detected between these two parameters. Indeed, the very high varia-tion in levels of GAPDH has recently been documented using both SAGE and quantitative RT-PCR [15].
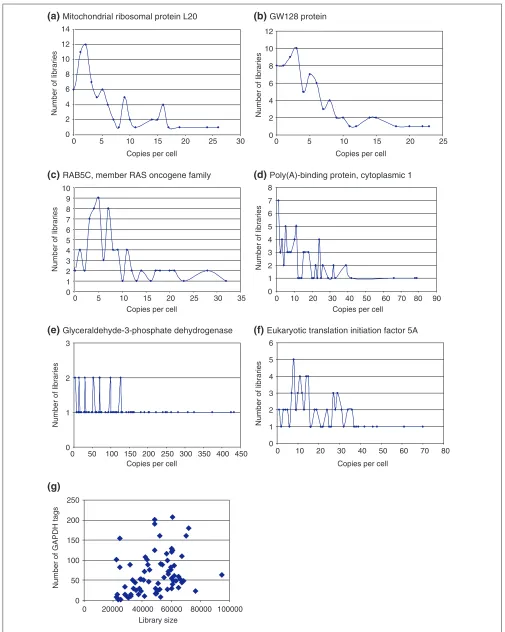
The values contained in the 822 x 74 expression matrix had to be transformed into boolean values by a so-called dis-cretization phase. In our context, each quantitative value has
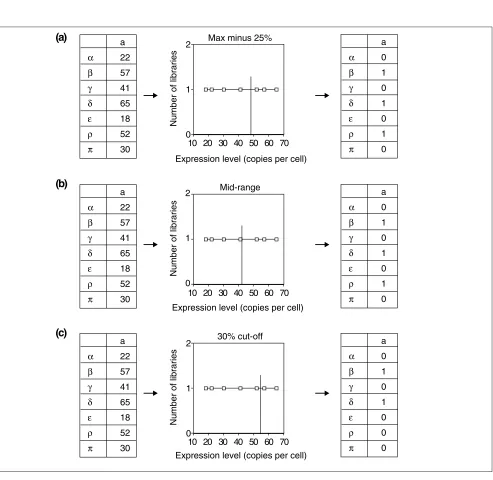
given rise to one boolean value, that is, true (1) or false (0). We have explored the effect of three different discretization procedures (Figure 4). First we used the ‘max minus x%’ procedure. This consists of identifying the highest expres-sion value (HV) in any library for each tag, and defining a value of 1 for the expression of that tag in a library when the expression value was above (HV - x)/100. Otherwise, the expression of the tag was assigned a value of 0 (Figure 4a). We also analyzed the effect of a mid-range-based cutoff (Figure 4b). The highest and lowest expression values were identified for each tag and the mid-range value was defined as being equidistant from these two numbers (their arith-metic mean). Then, all expression values below or equal to the mid-range were set to 0, and all values strictly above the mid-range were set to 1.
Finally, we used a ‘x% of highest value’ approach (Figure 4c). For each tag, we identified libraries in which its level of expression was in the 5% of highest values. These were assigned the value 1, and the rest were set to 0.
These procedures will clearly generate different boolean matrices. One of the main questions will then be: what is the influence of those differences on the nature of the generated rules? As seen below, some tendencies are conserved irre-spective of the discretization procedure applied; others are only apparent using one of the three approaches.
The use of such discretization approaches is nevertheless both technically interesting and biologically sound. The main technical interest lies in the elimination of all the very low tag values, which may be the result of either sequencing errors or insufficient sequencing effort. Biologically, the dis-cretization approach can be seen as an overexpression experiment, in which we identify genes that are overex-pressed (right part of the rule) when a given set of genes are overexpressed (left part of the rule). Nevertheless, differ-ences that are generated as a result of different discretization approaches highlight the problem of determining the best mathematical definition of gene overexpression.
Mining the boolean context and post-processing the rules
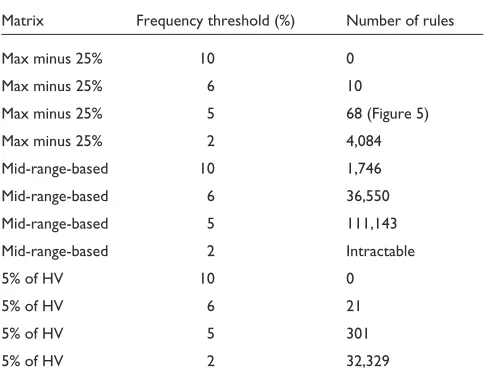
The binary matrices were transformed into a readable format for the ac-miner software (see Materials and methods). For the extraction phase, in every case we applied a confidence value of 100%. This means that all the rules generated are true in 100% of the cases. We first checked the effect of varying the frequency threshold, from 10% to 2%, on the number of rules extracted (Table 2).
comment
reviews
reports
deposited research
interactions
information
[image:5.609.53.554.79.713.2]refereed research
Figure 2(see the next page for continuation of figure and the legend)
Tag_Sequence Description AAAACATTCT Tag matches mitochondrial sequence
AAAAGAAACT POLYADENYLATE-BINDING PROTEIN AACGCGGCCA Macrophage migration inhibitory factor
AACTAAAAAA Ubiquitin A-52 residue ribosomal protein fusion product 1 AACTAACAAA Ubiquitin A-52 residue ribosomal protein fusion product 1 AAGACAGTGG Ribosomal protein L37a
AAGGAGATGG Ribosomal protein L31
AAGGTGGAGG 60S RIBOSOMAL PROTEIN L18A AATAGGTCCA Ribosomal protein S25 AATCCTGTGG Ribosomal protein L8
ACAGGGTGAC Homo sapiens mRNA for EDF-1 protein ACAGTGGGGA Human (p23) mRNA, complete cds ACATCATCGA Ribosomal protein L12
ACTTTTTCAA Tag matches mitochondrial sequence
AGAATCGCTT Homo sapiens coatomer protein (COPA) mRNA, complete cds AGCACCTCCA Eukaryotic translation elongation factor 2
AGCCCTACAA Tag matches mitochondrial sequence
AGCCCTCCCT Homo sapiens autoantigen p542 mRNA, complete cds AGCTCTCCCT 60S RIBOSOMAL PROTEIN L23
AGGAAAGCTG ESTs, Highly similar to 60S RIBOSOMAL PROTEIN L36 [Rattus norvegicus] AGGCTACGGA 60S RIBOSOMAL PROTEIN L13A
AGGGCTTCCA UBIQUINOL-CYTOCHROME C REDUCTASE COMPLEX SUBUNIT VI REQUIRING PROTEIN AGGTGGCAAG Tag matches mitochondrial sequence
ATAATTCTTT Ribosomal protein S29 ATCAAGGGTG Ribosomal protein L9
ATCACGCCCT Tag matches mitochondrial sequence ATCAGTGGCT PROTEASOME BETA CHAIN PRECURSOR
ATGAAACCCC Homo sapiens mRNA expressed in osteoblast, complete cds ATGGCTGGTA 40S RIBOSOMAL PROTEIN S2
ATTCTCCAGT Ribosomal protein L17
ATTTGAGAAG Tag matches mitochondrial sequence CAAGCATCCC Tag matches mitochondrial sequence
CAATAAACTG PROTEIN TRANSLATION FACTOR SUI1 HOMOLOG CAATAAATGT Ribosomal protein L37
CACAAACGGT 40S RIBOSOMAL PROTEIN S27 CAGCAGAAGC Homo sapiens 4F5rel mRNA, complete cds CATCTAAACT Human mRNA for KIAA0038 gene, partial cds CCACCCCGAA Testis enhanced gene transcript
CCACTCCTCA DEFENDER AGAINST CELL DEATH 1 CCAGGAGGAA HEAT SHOCK COGNATE 71 KD PROTEIN CCAGTGGCCC Ribosomal protein S9
CCATTGCACT Ataxia telangiectasia mutated (includes complementation groups A, C and D) CCCATCCGAA Ribosomal protein L26
CCCCAGCCAG Ribosomal protein S3 CCCCAGTTGC Calpain, small polypeptide CCCGTCCGGA 60S RIBOSOMAL PROTEIN L13 CCCTGGGTTC Ferritin, light polypeptide
CCGGGTGATG Human copper transport protein HAH1 (HAH1) mRNA, complete cds CCGTCCAAGG Ribosomal protein S16
CCGTGCTCAT ESTs, Highly similar to ADIPOCYTE P27 PROTEIN [Mus musculus] CCTAGCTGGA PEPTIDYL-PROLYL CIS-TRANS ISOMERASE A
CCTCGGAAAA 60S RIBOSOMAL PROTEIN L38
CCTGGAAGAG "Procollagen-proline, 2-oxoglutarate 4-dioxygenase (proline 4-hydroxylase), beta polypeptide (protein disulfide isomerase; CCTTCGAGAT Ribosomal protein S5
CGCCGCCGGC Human ribosomal protein L35 mRNA, complete cds
CGCCGCGGTG Homo sapiens Chromosome 16 BAC clone CIT987SK-A-761H5 CGCCGGAACA Ribosomal protein L4
CGCTGGTTCC Homo sapiens ribosomal protein L11 mRNA, complete cds CGTGTTAATG CELLULAR NUCLEIC ACID BINDING PROTEIN CTAAGACTTC Tag matches mitochondrial sequence CTAGCCTCAC Actin, gamma 1
CTCATAAGGA Tag matches mitochondrial sequence CTGCTATACG Ribosomal protein L5
CTGCTGAGTG ESTs, Highly similar to HYPOTHETICAL 14.1 KD PROTEIN C31A2.02 IN CHROMOSOME I [Schizosaccharomyces pombe] CTGGCTGCAA Cytochrome c oxidase subunit Vb
CTGGGTTAAT 40S RIBOSOMAL PROTEIN S19 CTGTTGATTG Heterogeneous nuclear ribonucleoprotein A1 CTGTTGGTGA 40S RIBOSOMAL PROTEIN S23 GAAAAATGGT Laminin receptor (2H5 epitope) GAACACATCC Ribosomal protein L19
GAAGCAGGAC COFILIN, NON-MUSCLE ISOFORM GAAGTTATGA T-COMPLEX PROTEIN 1, ALPHA SUBUNIT GACGACACGA Ribosomal protein S28
GACTCACTTT Peptidylprolyl isomerase B (cyclophilin B) GAGGGAGTTT Ribosomal protein L27a
GCAAAACCCC Homo sapiens tumor necrosis factor superfamily member LIGHT mRNA, complete cds GCACAAGAAG ESTs
GCAGCCATCC Ribosomal protein L28 GCATAATAGG Ribosomal protein L21
GCATAGGCTG ELONGATION FACTOR TU, MITOCHONDRIAL PRECURSOR GCCAGCCCAG Human transcriptional corepressor hKAP1/TIF1B mRNA, complete cds
GCCCCTCCGG ESTs, Weakly similar to TRANS-ACTING TRANSCRIPTIONAL PROTEIN ICP0 [Bovine herpesvirus type 1 (strain k22)] GCCGAGGAAG Human mRNA for ribosomal protein S12
GCCGTGTCCG Human ribosomal protein S6 mRNA, complete cds GCCTCCTCCC ESTs
GCCTGCTGGG Phospholipid hydroperoxide glutathione peroxidase GCCTGTATGA Ribosomal protein S24
GCCTTCCAAT P68 PROTEIN
GCGAAACCCC Human G protein-coupled receptor (STRL22) mRNA, complete cds (signal)
GCGAAACCCT V-erb-b2 avian erythroblastic leukemia viral oncogene homolog 3 {alternative products} (signal) GCTGGCTGGC Homo sapiens chaperonin containing t-complex polypeptide 1, eta subunit (Ccth) mRNA, complete cds
Figure 2(continued from the previous page)
The strictly minimal transcriptome set, representing the 156 tags that were found in each and every SAGE library constructed from more than 20,000 sequenced tags. The key shows the color code used for representing the function of the encoded proteins.
Tag_Sequence Description
AAAACATTCT Tag matches mitochondrial sequence GGACCACTGA Ribosomal protein L3
GGAGTGGACA 60S RIBOSOMAL PROTEIN L18 GGCAAGAAGA Ribosomal protein L27 GGCAAGCCCC Heat shock 27kD protein 1 GGCCGCGTTC Ribosomal protein S17
GGCCTGCTGC ESTs, Highly similar to C10 [H.sapiens] GGCTGGGGGC Human profilin mRNA, complete cds GGCTTTACCC Eukaryotic translation initiation factor 5A
GGGCGCTGTG Homo sapiens mRNA for smallest subunit of ubiquinol-cytochrome c reductase, complete cds GGGGAAATCG THYMOSIN BETA-10
GGGGGACGGC ESTs, Weakly similar to Y48E1B.1 [C.elegans]
GGGGGTCACC ATP SYNTHASE LIPID-BINDING PROTEIN P1 PRECURSOR GGTCCAGTGT Phosphoglycerate mutase 1 (brain)
GGTGGATGTG Homo sapiens methyl-CpG binding protein MBD3 (MBD3) mRNA, complete cds
GGTTTGGCTT UBIQUINOL-CYTOCHROME C REDUCTASE COMPLEX 11 KD PROTEIN PRECURSOR GTGAAACCTC Homo sapiens intrinsic factor-B12 receptor precursor, mRNA, complete cds
GTGAAGGCAG Ribosomal protein S3A
GTGACAACAC Voltage-dependent anion channel 1
GTGACAGAAG Eukaryotic translation initiation factor 4A (eIF-4A) isoform 1
GTGACCTCCT CYTOCHROME C OXIDASE POLYPEPTIDE VIII-LIVER/HEART PRECURSOR GTGATGGTGT Thyroid autoantigen 70kD (Ku antigen)
GTGCTGAATG MYOSIN LIGHT CHAIN ALKALI, SMOOTH-MUSCLE ISOFORM GTGGCACACG Eukaryotic translation initiation factor 3 (eIF-3) p36 subunit GTGGCAGGTG Human mRNA for KIAA0340 gene, partial cds
GTGGCTCACA Adenosine A2b receptor
GTGTTAACCA Human ribosomal protein L10 mRNA, complete cds GTGTTGCACA Ribosomal protein S13
GTTAACGTCC Homo sapiens Bruton's tyrosine kinase (BTK), alpha-D-galactosidase A (GLA), L44-like ribosomal protein (L44L) and FTP3 GTTCGTGCCA Ribosomal protein L35a
GTTGTGGTTA BETA-2-MICROGLOBULIN PRECURSOR TAAGGAGCTG Ribosomal protein S26
TAATAAAGGT 40S RIBOSOMAL PROTEIN S8 TACAAGAGGA Ribosomal protein L6
TACCATCAAT Glyceraldehyde-3-phosphate dehydrogenase TACCCTAGAA Estrogen receptor
TAGGTTGTCT TRANSLATIONALLY CONTROLLED TUMOR PROTEIN
TAGTTGAAGT UBIQUINOL-CYTOCHROME C REDUCTASE COMPLEX 14 KD PROTEIN TCACAAGCAA H.sapiens alpha NAC mRNA
TCAGATCTTT Ribosomal protein S4, X-linked
TCAGTTTGTC Human HS1 binding protein HAX-1 mRNA, nuclear gene encoding mitochondrial protein, complete cds TCTCCAGGAA ESTs, Weakly similar to PUTATIVE MITOCHONDRIAL CARRIER C16C10.1 [C.elegans]
TCTTGTGCAT L-LACTATE DEHYDROGENASE M CHAIN
TGAAGGAGCC ATP SYNTHASE LIPID-BINDING PROTEIN P2 PRECURSOR TGAGGGAATA Triosephosphate isomerase 1
TGCACGTTTT Human mRNA for antileukoprotease (ALP) from cervix uterus TGCATCTGGT 78 KD GLUCOSE REGULATED PROTEIN PRECURSOR
TGGAATGCTG Homo sapiens NADH:ubiquinone dehydrogenase 51 kDa subunit (NDUFV1) mRNA, nuclear gene encoding mitochondrial TGGAGTGGAG Human guanylate kinase (GUK1) mRNA, complete cds
TGGCTGTGTG ESTs
TGGGCAAAGC Translation elongation factor 1 gamma
TGGTGTTGAG Human DNA sequence from clone 1033B10 on chromosome 6p21.2-21.31. Contains the BING5 gene, exons 11 to 15 of the TGTACCTGTA Human alpha-tubulin mRNA, complete cds
TGTGATCAGA Homo sapiens F1F0-type ATP synthase subunit g mRNA, complete cds TGTGCTAAAT 60S RIBOSOMAL PROTEIN L34
TGTGTTGAGA Translation elongation factor 1-alpha-1
TTATGGGATC GUANINE NUCLEOTIDE-BINDING PROTEIN BETA SUBUNIT-LIKE PROTEIN 12.3 TTCATACACC Tag matches mitochondrial sequence
TTCTTGTGGC Ribosomal protein S11
TTGGAGATCT Human NADH:ubiquinone oxidoreductase MLRQ subunit mRNA, complete cds TTGGGGTTTC Ferritin heavy chain
TTGGTCCTCT 60S RIBOSOMAL PROTEIN L41
TTGTAATCGT Human mRNA for ornithine decarboxylase antizyme, ORF 1 and ORF 2 TTGTTGTTGA Calmodulin 1 (phosphorylase kinase, delta)
TTTAACGGCC Tag matches mitochondrial sequence
Transcription Signal
Translation Ribosomal Mitochondrial
Proteasome
comment
reviews
reports
deposited research
interactions
information
[image:7.609.53.558.84.716.2]refereed research
Figure 3 (see legend on the next page)
Number of libraries
0 5 10 15 20 25 30 0 5 10 15 20 25
Number of libraries
Number of libraries
Number of libraries
Number of libraries
0 50 100 150 200 250 300 350 400 450 0 10 20 30 40 50 60 70 80
0 10 20 30 40 50 60 70 80 90
Number of libraries
0 5 10 15 20 25 30 35
Library size
Number of GAPDH tags
Copies per cell
Copies per cell
Copies per cell Copies per cell
Copies per cell Copies per cell 0
2 4 6 8 10 12 14
0 2 4 6 8 10 12
0 1 2 3 4 5 6 7 8 9 10
0 1 2 3 4 5 6 7 8
0 1 2 3
0 1 2 3 4 5 6
250
200
150
100
50
0 20000 40000 60000 80000 100000
0
(a)
Mitochondrial ribosomal protein L20(b)
GW128 protein(c)
RAB5C, member RAS oncogene family(d)
Poly(A)-binding protein, cytoplasmic 1(e)
Glyceraldehyde-3-phosphate dehydrogenase(g)
Figure 3(see figure on the previous page)
Gene-expression profiles represented as copies per cell, derived by normalization from the values obtained in the 74 libraries used. (a) Mitochondrial ribosomal protein L20; (b) GW128 protein; (c) RAB5C, member of the Ras family; (d) Poly(A)-binding protein, cytoplasmic 1; (e) glyceraldehyde-3-phosphate dehydrogenase (GAPDH); (f)eukaryotic translation initiation factor 5A. (g)Repartition of GAPDH frequency (in number of tags) as a function of the size of the library from which that frequency was deduced. Three tags are shown that belong to the strictly minimal transcriptome set (d-f) and three tags not belonging to that set (a-c).
Figure 4
Schematic description of the discretization protocols used. On the left is shown the original matrix containing continuous values expressed as copies of transcript per cell, in the center the discretization procedure used, and on the right the resulting boolean matrix. (a)The max minus 25% approach. We took the highest value (65) and calculated 25% of 65 (16.25). Values above 65 - 16.25 (= 48.75) were given a boolean value of 1; all others were given a value of 0. (b)The mid-range approach. We took the highest value (65), the lowest value (18), and calculated the mid-range as ((65-18)/2)+18= 41.5. Values above 41.5 were given a boolean value of 1; all others were given a value of 0. (c)The 30% cut-off. We took the highest 30% of the number of values (here 7 x 0.3 = 2.1, that is, the two highest values), set them to 1 and the rest to 0. Note that this 30% value is not the actual value used for the extraction (see below) but is given as an illustration. Note also that these three different procedures resulted in different matrix densities. The last procedure resulted in the same number of boolean 1 results for all tags, whereas the first two generated different densities of 1, depending on the gene-expression pattern throughout the various libraries.
a
α 22
β 57
γ 41
δ 65
ε 18
ρ 52
π 30
Expression level (copies per cell)
Number of libraries
0 1 2
10 20 30 40 50 60 70
a
α 0
β 1
γ 0
δ 1
ε 0
ρ 1
π 0
a
α 22
β 57
γ 41
δ 65
ε 18
ρ 52
π 30
Expression level (copies per cell)
Number of libraries
0 1 2
10 20 30 40 50 60 70
a
α 0
β 1
γ 0
δ 1
ε 0
ρ 1
π 0
a
α 22
β 57
γ 41
δ 65
ε 18
ρ 52
π 30
Expression level (copies per cell)
Number of libraries
0 1 2
10 20 30 40 50 60 70
a
α 0
β 1
γ 0
δ 1
ε 0
ρ 0
π 0
(a)
(b)
(c)
Max minus 25%
Mid-range
therefore to be determined empirically on a given boolean matrix. It can also be seen from this table that the number of rules generated for a low-frequency threshold can be so high that even a properly designed algorithm is unable to extract them. In some cases at a low threshold, although rules can be extracted, their very high number renders their analysis impossible, at least with the post-processing strategies and tools currently available.
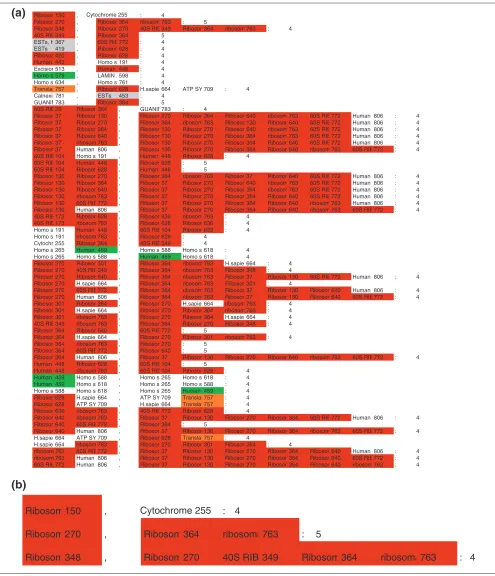
The 68 rules extracted from the ‘Max minus 25% matrix’ using an ac-miner frequency threshold at 5% were then transferred into an Excel file and color-coded according to the function encoded by the genes associated in the rules (Figure 5). It was immediately obvious that we obtained a very high level of homogeneity in the rules, with most of the rules associating genes encoding ribosomal proteins. We then analyzed the rules from the ‘mid-range-based’ cutoff using an ac-miner frequency threshold at 10%. The resulting 1,746 rules were transferred into an Excel file and color-coded according to the function encolor-coded by the genes associ-ated in the rules (see Additional data files). Once more, it was immediately obvious that we obtained a very high level of homogeneity in the rules, and once again most of the rules associated genes encoding ribosomal proteins. This time, a higher incidence of other translation-related non-ribosomal proteins was observed. It was also clear that because of the high number of rules generated, a post-processing task would need to be carried out to identify a smaller number of rules with the highest biological relevance. This is always the case with such unsupervised data mining techniques.
Finally, we analyzed the rules extracted from the ‘5% of highest value’ matrix using two different ac-miner frequency
thresholds. The 5% frequency value resulted in the generation of 301 rules that were transferred into an Excel file and color-coded according to the function encolor-coded by the genes associ-ated in the rules (see Additional data files). Once again, the rules were homogeneous, mostly associating protein synthe-sis-related (ribosomal or not) tags. Nevertheless, it was also apparent that some clustering of genes found in mitochondrial DNA was beginning to appear. This was made much more obvious by extracting rules at a 2% frequency value, and by selecting from the resulting 32,329 rules those that visually contained more than one tag identifying a mitochondrial gene. This approach resulted in a set of 436 rules that were highly homogeneous (see Additional data files).
Biological significance of the discovered rules
To explore the biological significance of the generated rules, we decided to investigate in detail a subset of the longest rules generated from the mid-range-based approach. We focused on a set of 47 rules associating 13 different genes (see Additional data files). As previously noted, the rules are very homogeneous, mostly associating protein synthesis-related tags. Only two tags were not categorized as such: a yellow-coded tag (number 763, transcription) and a gray-coded tag (631, expressed sequence tag (EST)). First, we rechecked the identity of tag 763 (sequence TGGTGTTGAG), by using the ‘tag to gene’ function of the National Center for Biotechnology Information (NCBI) website [6]. It provided the identification: Hs.275865: ribosomal protein S18. The initial identification of this tag was thus misleading and this shows that our data-mining technique can allow the correct reassignment of wrongly labeled tags.
We then rechecked the identity of tag 631 (sequence GTTG-GTCTGT). It provided the following identification: Hs.288967: Homo sapiens cDNA FLJ14105 fis, clone MAMMA1001202. This is an EST of unknown function. The results obtained with our mining technique suggest that the putative protein encoded by this EST is involved in protein synthesis. The ability both to correctly relabel wrongly attributed tags and to propose a function for an unknown protein is a first element of biological validation of the gen-erated set of rules, although final verification will depend on biological experiments demonstrating a function.
To gain further insight into the biological meaning of the rules generated, we decided to investigate in finer detail several rules associating proteins involved in signal trans-duction. The following rules were highlighted:
When the gene encoding the S6 kinase (RSK-B) (Tag n° 579) is overexpressed (that is, it has an expression value of 1), then the gene encoding the Lamin A (Tag n° 598) is also overexpressed, and this is true in 4 different cell types (see line 10 in Figure 5a for the actual the rule). This association of S6 kinase and lamin A is in good accordance with the previous identification of S6 kinase II as a potentially important lamin kinase [16].
comment
reviews
reports
deposited research
interactions
information
[image:9.609.55.297.551.741.2]refereed research
Table 2
Effect of varying the frequency threshold on the number of rules extracted
Matrix Frequency threshold (%) Number of rules
Max minus 25% 10 0
Max minus 25% 6 10
Max minus 25% 5 68 (Figure 5)
Max minus 25% 2 4,084
Mid-range-based 10 1,746
Mid-range-based 6 36,550
Mid-range-based 5 111,143
Mid-range-based 2 Intractable
5% of HV 10 0
5% of HV 6 21
5% of HV 5 301
Figure 5
Rules generated. (a)The 68 rules generated by ac-miner on a ‘max minus 25%’ boolean matrix using a 5% frequency threshold. The rules were translated into a color-coded Excel file. For the color-coding conventions used, see Figure 2. (b)The first three rules generated. The first rule reads: ‘When the gene encoding the ribosomal protein S24 (identified by the tag no. 150) is overexpressed, then the gene encoding the cytochrome c oxidase subunit IV (identified by tag 255) is also overexpressed’. This rule is true in four different libraries. The second rule associates three tags identifying the ribosomal proteins S5, L19 and S18 (true in five libraries). The third rule associates five tags identifying the ribosomal proteins L21, S5, S23, L19 and S18 (true in four libraries).
Ribosom150 , Cytochrome 255 : 4
Ribosom270 , Ribosom364 ribosom 763 : 5
Ribosom348 , Ribosom270 40S RIB349 Ribosom364 ribosom 763 : 4 40S RIB349 , Ribosom364 : 5
ESTs, H367 , 60S RIB772 : 4 ESTs 419 , Ribosom628 : 4 Ribosom420 , Ribosom628 : 4 Human 443 , Homo s 191 : 4 Excision513 , Human 448 : 4 Homo s 579 , LAMIN A598 : 4 Homo s 634 , Homo s 761 : 4
Translat 757 , Ribosom628 H.sapie 664 ATP SY 709 : 4 Calnexin781 , ESTs 453 : 4
GUANIN783 , Ribosom364 : 5
60S RIB20 Ribosom364 , GUANIN783 : 4
Ribosom37 Ribosom130 , Ribosom270 Ribosom364 Ribosom640 ribosom 763 60S RIB772 Human 806 : 4 Ribosom37 Ribosom270 , Ribosom364 ribosom 763 Ribosom130 Ribosom640 60S RIB772 Human 806 : 4 Ribosom37 Ribosom364 , Ribosom130 Ribosom270 Ribosom640 ribosom 763 60S RIB772 Human 806 : 4 Ribosom37 Ribosom640 , Ribosom130 Ribosom270 Ribosom364 ribosom 763 60S RIB772 Human 806 : 4 Ribosom37 ribosom 763 , Ribosom130 Ribosom270 Ribosom364 Ribosom640 60S RIB772 Human 806 : 4 Ribosom37 Human 806 , Ribosom130 Ribosom270 Ribosom364 Ribosom640 ribosom 763 60S RIB772 : 4 60S RIB104 Homo s 191 , Human 448 Ribosom628 : 4
60S RIB104 Human 448 , Ribosom628 : 5 60S RIB104 Ribosom628 , Human 448 : 5
Ribosom130 Ribosom270 , Ribosom364 ribosom 763 Ribosom37 Ribosom640 60S RIB772 Human 806 : 4 Ribosom130 Ribosom364 , Ribosom37 Ribosom270 Ribosom640 ribosom 763 60S RIB772 Human 806 : 4 Ribosom130 Ribosom640 , Ribosom37 Ribosom270 Ribosom364 ribosom 763 60S RIB772 Human 806 : 4 Ribosom130 ribosom 763 , Ribosom37 Ribosom270 Ribosom364 Ribosom640 60S RIB772 Human 806 : 4 Ribosom130 60S RIB772 , Ribosom37 Ribosom270 Ribosom364 Ribosom640 ribosom 763 Human 806 : 4 Ribosom130 Human 806 , Ribosom37 Ribosom270 Ribosom364 Ribosom640 ribosom 763 60S RIB772 : 4 40S RIB173 Ribosom628 , Ribosom636 ribosom 763 : 4
40S RIB173 ribosom 763 , Ribosom628 Ribosom636 : 4 Homo s 191 Human 448 , 60S RIB104 Ribosom628 : 4 Homo s 191 ribosom 763 , Ribosom628 : 4
Cytochr 255 Ribosom364 , 40S RIB349 : 4
Homo s 265 Human 459 , Homo s 588 Homo s 618 : 4 Homo s 265 Homo s 588 , Human 459 Homo s 618 : 4
Ribosom270 Ribosom301 , Ribosom364 ribosom 763 H.sapie 664 : 4 Ribosom270 40S RIB349 , Ribosom364 ribosom 763 Ribosom348 : 4
Ribosom270 Ribosom640 , Ribosom364 ribosom 763 Ribosom37 Ribosom130 60S RIB772 Human 806 : 4 Ribosom270 H.sapie 664 , Ribosom364 ribosom 763 Ribosom301 : 4
Ribosom270 60S RIB772 , Ribosom364 ribosom 763 Ribosom37 Ribosom130 Ribosom640 Human 806 : 4 Ribosom270 Human 806 , Ribosom364 ribosom 763 Ribosom37 Ribosom130 Ribosom640 60S RIB772 : 4 Ribosom301 Ribosom364 , Ribosom270 H.sapie 664 ribosom 763 : 4
Ribosom301 H.sapie 664 , Ribosom270 Ribosom364 ribosom 763 : 4 Ribosom301 ribosom 763 , Ribosom270 Ribosom364 H.sapie 664 : 4 40S RIB349 ribosom 763 , Ribosom364 Ribosom270 Ribosom348 : 4 Ribosom364 Ribosom640 , 60S RIB772 : 5
Ribosom364 H.sapie 664 , Ribosom270 Ribosom301 ribosom 763 : 4 Ribosom364 ribosom 763 , Ribosom270 : 5
Ribosom364 60S RIB772 , Ribosom640 : 5
Ribosom364 Human 806 , Ribosom37 Ribosom130 Ribosom270 Ribosom640 ribosom 763 60S RIB772 : 4 Human 448 Ribosom628 , 60S RIB104 : 5
Human 448 ribosom 763 , 60S RIB104 Ribosom628 : 4 Human 459 Homo s 588 , Homo s 265 Homo s 618 : 4 Human 459 Homo s 618 , Homo s 265 Homo s 588 : 4 Homo s 588 Homo s 618 , Homo s 265 Human 459 : 4 Ribosom628 H.sapie 664 , ATP SY 709 Translat 757 : 4 Ribosom628 ATP SY 709 , H.sapie 664 Translat 757 : 4 Ribosom636 ribosom 763 , 40S RIB173 Ribosom628 : 4
Ribosom640 ribosom 763 , Ribosom37 Ribosom130 Ribosom270 Ribosom364 60S RIB772 Human 806 : 4 Ribosom640 60S RIB772 , Ribosom364 : 5
Ribosom640 Human 806 , Ribosom37 Ribosom130 Ribosom270 Ribosom364 ribosom 763 60S RIB772 : 4 H.sapie 664 ATP SY 709 , Ribosom628 Translat 757 : 4
H.sapie 664 ribosom 763 , Ribosom270 Ribosom301 Ribosom364 : 4
ribosom 763 60S RIB772 , Ribosom37 Ribosom130 Ribosom270 Ribosom364 Ribosom640 Human 806 : 4 ribosom 763 Human 806 , Ribosom37 Ribosom130 Ribosom270 Ribosom364 Ribosom640 60S RIB772 : 4 60S RIB772 Human 806 , Ribosom37 Ribosom130 Ribosom270 Ribosom364 Ribosom640 ribosom 763 : 4
Ribosom 150 , : 4
Ribosom 270 , Ribosom 364 ribosoma763 : 5
Ribosom 348 , Ribosom 270 40S RIB 349 Ribosom 364 ribosoma763 : 4 Cytochrome 255
(a)
When the gene encoding the ras-related GTP-binding protein (Tag n° 312), is overexpressed (that is, it has an expression value of 1), then the gene encoding the Platelet-endothelial tetraspan antigen 3 (Tag n° 730) is also overex-pressed, and this is true in 8 different cell types. Tetraspans are membrane proteins that are proposed to act as ‘molecular facilitators’, grouping specific cell-surface proteins and thus increasing the formation and stability of functional signaling complexes [17]. Although they were proposed to activate the Jun N-terminal kinase (JNK) pathway [18], no association with Ras-family proteins has previously been reported. ARD results would support the contention that the function of Ras-family proteins is coor-dinated with that of tetraspan.
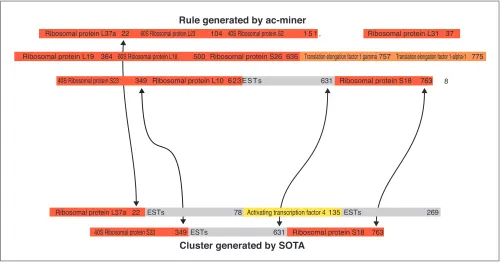
When both the genes encoding the G protein-coupled recep-tor (STRL22) (Tag n° 459) and the KH type splicing regula-tory protein KSRP (Tag n° 795) are overexpressed, then the gene encoding the KIAA0340 gene (Tag n° 607) is also over-expressed, and this is true in 8 different cell types. This rule suggests the existence of a functional association between a G-protein-coupled receptor related to chemokine receptors [19], a splicing factor [20], and a member of the RASgene superfamily (KIAA0340, also known as RAB3A, RIM, RIM1, RAB3IP2, RIMS1 [21]). That the expression of a G protein-coupled receptor correlates with that of a small GTP-binding protein may not be surprising. However, the indication that this signaling pathway may somehow be functionally corre-lated with a splicing event is an interesting prediction. Comparing association rules with self-organizing maps To compare the output of ac-miner with a traditional clus-tering method, we decided to use a recently described imple-mentation of the SOM algorithm called SOTA, which is freely available on the web [22,23]. The expression matrix, before boolean transformation, was computed through SOTA, using a variability threshold of 90%, and the resulting clusters were color-coded (see Additional data files). As such, it is clear that this approach does not allow either rela-beling of tags, or assignment of putative functions to tags encoding unknown proteins. Nevertheless, it can be quite useful to compare the results generated by the two methods, especially for exploring the rules associating heterogeneous members. One can for example note that one SOTA cluster associates several of the genes that were associated in the longest rules (Figure 6). The fact that four genes (including the EST of unknown function) belong at the same time to a strong rule and to a SOTA cluster clearly reinforces the pre-diction that those four genes are co-regulated and partici-pate in a similar function.
Discussion
We have used a new data-mining technique (ARD) for ana-lyzing gene-expression matrices to discover potentially interesting strong association rules. To validate the potential
of this technique, we used expression data that are freely available (human SAGE data). Because of the very high dimensionality of SAGE data, application of the recently developed algorithm Min-Ex has proved very useful com-pared to the previously developed association-rule algo-rithms based on the Apriori algorithm [4].
This approach was successful in generating a set of rules that were biologically meaningful according to two main criteria. This first criterion was that the rules generated were very homogeneous in terms of the function associated with the tags. The very strong message revealed by our approach is that some ribosomal mRNAs are strongly co-regulated. A very similar finding has been recently described in various biological systems, including many tumors and cell lines [24-26], cells overexpressing erbB-2 [27], cells overexpressing N-myc [28], NGF-treated PC12 cells [29] and yeast cells examined at a compendium level [30]. Both the underlying mechanism(s) and the biological function(s) for such co-regulation are still essentially elusive (see discussion in [29]), especially in light of the described translational control of ribosomal protein synthesis [31]. It is nevertheless clear that our ‘blind’ mining technique essentially captured a biological phenomenon that until now has been described on dissimilar occasions, and could represent a more general phenomenon than anticipated. We also observed the expected co-regula-tion of genes encoded by mitochondrial DNA (see [32] for a recent review). We were also able to extract several rules involving signal transduction proteins, some of which were confirmed by previous published evidence, and some of which point in yet-unexplored directions.
The color-coding we used is somewhat ‘crude’ and finer bio-logical definitions would be necessary for investigating the biological meaning of the rules in greater detail. We plan to use the newly described Gene Ontology classification [33] as a basis for establishing tag meta-identity. It would be very inter-esting to see whether rule homogeneity can be observed at the three GO levels: not only at the biological process level, but also at the molecular function and cellular component levels. The homogeneity that was generated in the rules was suffi-cient to relabel a wrongly labeled tag, and to propose a puta-tive function for an EST-encoded protein. Beyond the validation purpose, the heterogeneous sets of rules might be considered as the most biologically interesting, as they might point to previously unidentified functionally connected sets of genes. It is clear that the usefulness of such a set of rules for the scientific community will be very much improved by the use not only of the minimal transcriptome set, but of all the thousands of non-ambiguous tags (tags identifying only one gene and present at least once in two different libraries, see [9]). This work is in progress in our laboratories. We are currently exploring other promising future direc-tions. One is to evaluate a number of various objective
mea-comment
reviews
reports
deposited research
interactions
information
sures of interestingness to rank the rules according to crite-ria complementary to user-based knowledge. For example, conviction [34] is interesting, because, contrary to the confi-dence measure, it takes the support of the right-hand side of the rule into account. Roughly speaking, conviction mea-sures the quality of a rule seen as an implication. The J-measure [35] J-measures two important criteria for the quality of a rule, namely simplicity and goodness-of-fit between the rule and the data. Interestingly, when applied to frequent rules, we need only know the frequent itemsets (see Materi-als and methods for a definition) and their frequencies. Thus these measures can be evaluated efficiently.
Another extremely interesting scientific challenge is to con-sider other user-defined constraints that can be inserted in the association-rule miner algorithms [36]. These would not only be related to frequency and confidence thresholds but also to various constraints, for example, those that enforce the presence or absence of some attribute. This might enable work at lower-frequency thresholds and a focus on rules that involve the desired attributes. This is important, as it might enable the identification of association rules that are not suf-ficiently strong to be discovered at present.
Another line of enquiry is the possibility of applying the asso-ciation-rule approach to associate cell types rather than genes, in order to identify closely related cell types. Such an approach has already been implemented, using a clustering
algorithm on human SAGE data [9]. It remains to be seen whether the ARD approach can give rise to rules that produce cell regroupings that can be compared with these clusters, just as rules and clusters associating genes have been compared. To conclude, we have demonstrated the usefulness of ARD, and in particular that this approach can be used to highlight various properties concealed in the mass of data, depending on the discretization procedure applied. This approach should be regarded as highly complementary to the more traditional clustering approaches, and should prove as useful for extracting properties from microarray-generated expres-sion data as we demonstrated for SAGE-generated data.
Materials and methods
The association-rule discovery technique
The classical framework
[image:12.609.55.557.87.351.2]In the standard presentation of ARD [4], the data are in the form of a (large) boolean matrix. In the case of gene-expres-sion data, it may be generated from DNA arrays or SAGE approaches, and initial values are continuous. The genera-tion of the boolean matrix from such continuous data is a critical step that may impinge on the interpretation of the rules generated. We have described three different approaches to generating such matrices (see ‘ Preprocessing raw data and preparing the boolean context’) that all try to capture a gene-expression pattern.
Figure 6
Side-by-side comparison of one rule generated by ac-miner, belonging to the longest set and one cluster generated by SOTA (see Additional data files). The arrows indicate tags that were found to associate through both methods.
Rule generated by ac-miner
Cluster generated by SOTA
! "!
# $
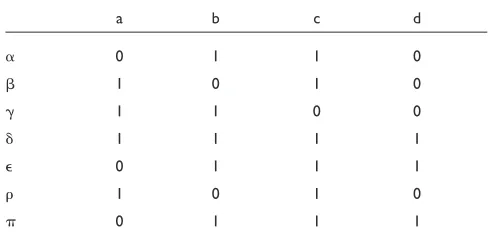
If the columns of the matrix are denoted C1, C2, …, Cn, then the ARD technique discovers association rule that are expressions X ——> Y where X and Y are sets of columns (often called itemsets) and X Y= 쏗 (for an example of the actual rules extracted, see Figure 5). The relevance of a rule X ——> Y can be measured by its frequency and its confi-dence. The frequency is the number of rows where all columns in X and Y have a value of 1 (true) simultaneously. This number is often divided by the number of rows to provide a relative frequency. The confidence is the ratio between the frequency and the number of rows where all the columns in X have a value of 1, that is, it estimates the conditional probability of observing the properties denoted by Y when the properties denoted by X are true. Thus, when a rule has a confidence of 1, it means that 100% of the rows that have 1 in the columns in X also have 1 in the columns in Y. The classical association-rule mining task concerns the discovery of every rule such that its frequency and its confidence are greater or equal to user-defined thresholds [4].
Given our example dataset in Table 1 we define that gene a is overexpressed in condition if its level of expression is greater than the mean level of expression of a across all conditions (␣ to ). Otherwise, it is considered to be underexpressed (see ‘ Preprocessing raw data and preparing the boolean context’ above for the actual discretization procedures used). In this way we build a boolean matrix as shown in Table 3.
In the example shown above, the rule gene a ——> gene c has the frequency 3/7 and the confidence 3/4. In other words, genes a and c are overexpressed simultaneously in 3/7 of the situations, and when gene a is overexpressed then in 75% of the situations gene c is also overexpressed. If the frequency threshold had been fixed at 30% and the confidence thresh-old at 70%, then the rule gene a ——> gene c would be discov-ered. At these thresholds, a rule such as gene c ——> gene b would not be discovered because it is not sufficiently valid (4/6 = 66%), although it is sufficiently frequent (4/7 = 57%). Similarly, the rule gene a, gene b, gene c ——> gene d would
not be discovered because it is not sufficiently frequent (1/7 = 14%), although it is valid (confidence = 100%).
Mining of frequent and valid association rules has led to a great deal of research since the definition of the Apriori algo-rithm [4]. Many data-mining software tools include an implementation of this algorithm, for example, commercial packages such as Clementine [37] and free academic soft-ware packages such as Weka [38].
Solutions to the classical association-rule mining problem
Most of the available implementations of association-rule miners perform well on sparse and weakly correlated boolean data. They are based on a two-phase process. First, every frequent itemset is identified and its frequency com-puted. An example of an itemset would be the sets of genes that are overexpressed together in more than 10% of the bio-logical situations. This will represent the limiting step, in terms of computing time, for the whole process.
Valid rules are identified from each discovered frequent itemset. The discovery of valid frequent rules from the quent itemsets is a straightforward operation. For each fre-quent itemset X, the rule X\{Y}——>Y is generated for every subset Y of X, and its confidence is calculated. Rules are listed only if their confidence is greater or equal to the user-defined threshold. Using this approach, the derivation of fre-quent/valid rules is quite efficient as infrequent itemsets have already been eliminated to reduce the numbers of cal-culations to determine validity and confidence of rules.
It turns out that the challenging issues related to associa-tion-rule mining are now being able to compute every fre-quent itemset and its frequency for the desired frequency threshold, and being able to support the identification of useful rules among the (thousands of) extracted frequent and valid rules. The identification of frequent itemsets in a boolean matrix consists of retrieving all possible attribute combinations that are true-valued in a number of lines of the matrix greater than the frequency threshold. For example in a matrix of 1,000 columns the initial number of candidates is 21,000. The computation of frequent itemsets is only feasible if an efficient candidate-enumeration strategy enables the search space to be pruned of most of the infrequent subsets without having to count their frequency. Fortunately, one can use the so-called anti-monotonicity of the minimal fre-quency as a constraint. Thus, an itemset cannot be frequent if one of its subsets is not frequent. Thus by identifying first singletons, then pairs, then itemsets of size 3, and so on, it is possible to prune most of the search space. This is because as soon as an itemset is known to be infrequent, all its super-sets can be ignored. By considering larger and larger item-sets, it is clear that eventually the whole collection of the frequent itemsets will be identified. In practice, apriori-based frequent-itemset-extraction algorithms work if the largest frequent itemset has a size lower or equal to 15 (at
comment
reviews
reports
deposited research
interactions
information
[image:13.609.53.297.621.741.2]refereed research
Table 3
Boolean matrix built from the matrix of expression values
a b c d
␣ 0 1 1 0
 1 0 1 0
␥ 1 1 0 0
␦ 1 1 1 1
⑀ 0 1 1 1
1 0 1 0
least 215itemsets have been considered by the counting pro-cedure). Clearly, the lower the frequency threshold, the larger the number of frequent itemsets.
A reasonable frequency threshold can be operationally defined as one at which the extraction of rules remains tractable (that is, does not require excessive computing time) but which nevertheless conserves sufficiently interest-ing properties. Thus the properties one wishes to study should have to involve perhaps at least 5% of the situations, whereas the extraction becomes intractable below 30%. We might want to compute the frequent sets for the lowest pos-sible threshold to provide more input for the post-processing phase. Apriori-like implementations can fail because of this essential requirement to identify and count for at least every frequent itemset. In situations in which the number of fre-quent itemsets is high, the frequency threshold must be increased and the risk that the frequent patterns discovered are trivial also increases similarly.
The post-processing phase is important for reporting results and supporting the discovery of interesting rules among the frequent and valid rules. Taking into account the huge number of generated rules, we must provide not only tools allowing us to browse and select the rules (subjective criteria of interestingness) but also various objective measures of interestingness to rank the rules according to complemen-tary criteria (see Discussion).
Furthermore, among the set of frequent and valid rules, a large number of rules will certainly be redundant. For example in the situation of rules r1 = X1 ——> Y1 and r2 = X2 ——> Y2 (when X1 X2 and Y2 Y1) are both frequent rules and have (almost) the same confidence. We can con-sider that r1 is more general than r2 and therefore discard r2 from the output because r2 does not provide any additional information. Application of this simple technique allows thousands and in some cases hundreds of thousands of redundant rules to be discarded without losing any informa-tion. Note, however, that this is an application-independent post-processing operation: no domain knowledge is used to eliminate uninteresting rules. In a complementary manner, domain knowledge can be applied to select subsets of gener-ated rules, for example, the rules that contain some attrib-utes could be discarded or attention can be focused on the subsets of rules in which others attributes occur.
With respect to the data described in Results, we have tried the classical approach and had difficulties using an Apriori-based implementation. Not only were we forced by constraints of tractability to work at rather high frequency thresholds, but despite this, in this exploratory context, we were nevertheless drowned by the number of rules gener-ated. Instead of implementing tedious post-processing phases, we decided to apply a recent technique that proposes solutions to these two problems.
Mining rules in dense boolean matrices: the Min-Ex approach
A huge research effort has been made to solve these problems of Apriori-like algorithms. The proposals concern both the efficient computation of the frequent itemsets and the possi-bility of directly identifying rules of greater potential interest. The design of Min-Ex and its implementation ac-miner is the result of this international effort [39]. Not only does it enable the more efficient computation of frequent itemsets but it also directly identifies a subset of the frequent and valid rules in condensed representation of the frequent itemsets. Min-Ex is based on the concept of ␦-free itemsets. An itemset is designated ␦-free if none of its subsets is linked together in a ␦-strong rule, that is, a rule with at most ␦ exceptions. In the research reported here, we used only rules that were 100% true, that is ␦= 0. In this case, an itemset X is ␦-free if there is no association rule with confidence of 100% between subsets of X. There are two very interesting properties of ␦-free itemsets. First, anti-monotonicity of freeness; every subset of a ␦-free itemset is also ␦-free and every superset of a non ␦-free itemsets is also non ␦-free. Second, frequent ␦-free itemsets are a condensed represen-tation of frequent itemsets, that is, they are less numerous than the frequent itemset while providing almost the same information (exactly the same information if ␦= 0).
Taken together, those two properties allow that when X is known to be a frequent ␦-free itemset, the frequency of (many) supersets of X can be derived from the frequency of X without having to count them. More precisely, for each 0-free set X, one can efficiently compute the maximal superset F such that its frequency is equal to the frequency of X, the so-called closure of X. As a result, every set that is included between X and F is known to have the frequency of X. In real-life data, it enables one to reduce significantly the number of sets for which the counting phase is needed. Also, it reduces the size of the explored search space [39]. Formal-ization and technical algorithmic details for computing ␦-free itemsets and their closures are described in [39]. In the present paper, we use the implementation called ac-miner-close.
Example
has a value of 1, and is thus considered as overexpressed), gene b and gene c are true as well. In other terms, we have a rule gene d ——> gene b gene c with a confidence value of 1 (logical rule). Thus, mining 0-free sets and their closures leads to association rules with confidence 1.
When considering the whole collection of logical rules extracted with ac-miner-close, we have an important prop-erty that these rules are not only frequent and logical (confi-dence 1) but maximal: X ——> Y is maximal if another frequent and logical rule Z ——> W such that Z X and/or Y W does not exist. Ac-miner-close provides the collection of such rules, designated strong rules, directly. These rules have a minimal left-hand side and a maximal right-hand side and many redundant rules are not provided.
Clearly, provided that the computation is tractable, which will be determined by the frequency threshold, the strong rules can also be computed from the output of an Apriori-based association rule miner. It needs for the computation of the so-called structural cover of the extracted rules (discarding rules that do not satisfy the above property of maximality).
Additional data files
Four supplemental figures are available with the online version of this paper. The rules in the table are color-coded according to the function encoded by the genes associated in the rules. For the color-coding conventions used in the sup-plemental figures, see Figure 2.
Supplemental figure 1 shows the first 566 rules (out of
1,746) generated by ac-miner on a mid-range-based boolean matrix using a 10% frequency threshold.
Supplemental figure 2 shows(a)The 301 rules generated by
ac-miner on a ‘5% cut-off’ boolean matrix using a 5% fre-quency threshold. (b)The 436 rules, out of 32,329 gener-ated by ac-miner on a 5% cut-off boolean matrix using a 2% frequency threshold, and from which the rules containing mitochondrial tags were visually extracted.
Supplemental figure 3shows the longer set of rules: from
the 1,746 rules generated by ac-miner on a mid-range-based boolean matrix using a 10% frequency threshold. Those 49 rules associated 13 tags and were true in 8 libraries. Shown are the rules (a) before and (b)after the proper reassign-ment of the tag 763.
Supplemental figure 4 shows the SOTA clustering output
translated into a color-coded Excel file.
Acknowledgements
The work in O. Gandrillon’s laboratory is supported by the Ligue contre le Cancer (Comité départemental du Rhône), INSERM/AFM (joint program), the CNRS, the UCBL, the Fondation de France, the EU RTN
program and the Association pour la recherche contre le cancer. The research at INSA Lyon is partially funded by the cInQ IST-2000-26469 European Project funded by the Future and Emerging Technologies arm of the IST programme. We thank Artur Bykowski for the implementation ac-miner-close of the Min-Ex algorithm, Edmund Derrington for critical reading of the manuscript and all lab members for helpful discussions.
References
1. Niehrs C, Pollet N: Synexpression groups in eukaryotes. Nature 1999, 402:483-487.
2. Liotta L, Petricoin E: Molecular profiling of human cancer. Nat Rev Genet2000, 1:48-56.
3. Kohn KW: Molecular interaction map of the mammalian cell cycle control and DNA repair systems. Mol Biol Cell 1999, 10:2703-2734.
4. Agrawal R, Mannila H, Srikant R, Toivonen H, Verkamo AI: Fast dis-covery of association rules.In Advances in Knowledge Discovery and Data Mining. Cambridge, MA: AAAI/MIT Press; 1996:307-328. 5. Zaki M: Generating non-redundant association rules.In Proc of
the sixth ACM SIGKDD international conference on Knowledge discovery and data mining. Boston, MA: ACM Press; 2000:34-43.
6. SAGEmap[http://www.ncbi.nlm.nih.gov/SAGE/index.cgi]
7. Lash AE, Tolstoshev CM, Wagner L, Schuler GD, Strausberg RL, Riggins GJ, Altschul SF: SAGEmap: a public gene expression resource. Genome Res2000, 10:1051-1060.
8. Velculescu VE, Zhang L, Vogelstein B, Kinzler KW: Serial analysis of gene expression. Science1995, 270:484-487.
9. Ng R, Sander J, Sleumer M: Hierarchical cluster analysis of SAGE data for cancer profiling.In Proceedings of BIOKDD 2001 Workshop on Data Mining in Bioinformatics. 2001: 65-72.
10. SAGE data[ftp://ftp.ncbi.nlm.nih.gov/pub/sage/]
11. SAGE data: tags_freq[ftp://ftp.ncbi.nlm.nih.gov/pub/sage/extr/] 12. SAGE data: description files
[ftp://ftp.ncbi.nlm.nih.gov/pub/sage/info/] 13. SAGE data: Stats.txt
[ftp://ftp.ncbi.nih.gov/pub/sage/OLD/extr/stats.txt]
14. Velculescu VE, Madden SL, Zhang L, Lash AE, Yu J, Rago C, Lal A, Wang CJ, Beaudry GA, Ciriello KM, et al.: Analysis of human transcriptomes. Nat Genet1999, 23:387-378.
15. Feroze-Merzoug F, Berquin IM, Dey J, Chen YQ: Peptidylprolyl isomerase A (PPIA) as a preferred internal control over GAPDH and beta-actin in quantitative RNA analyses. Biotech-niques2002, 32:776-782.
16. Ward GE, Kirschner MW: Identification of cell cycle-regulated phosphorylation sites on nuclear lamin C. Cell1990, 61: 561-577.
17. Maecker HT, Todd SC, Levy S: The tetraspanin superfamily: molecular facilitators. FASEB J1997, 11:428-442.
18. Yunta M, Oliva JL, Barcia R, Horejsi V, Angelisova P, Lazo PA: Tran-sient activation of the c-Jun N-terminal kinase (JNK) activity by ligation of the tetraspan CD53 antigen in different cell types. Eur J Biochem 2002, 269:1012-1021.
19. Liao F, Lee HH, Farber JM: Cloning of STRL22, a new human gene encoding a G-protein-coupled receptor related to chemokine receptors and located on chromosome 6q27. Genomics1997, 40:175-180.
20. Min H, Turck CW, Nikolic JM, Black DL: A new regulatory protein, KSRP, mediates exon inclusion through an intronic splicing enhancer. Genes Dev1997, 11:1023-1036.
21. Takai Y, Sasaki T, Shirataki H, Nakanishi H: Rab3A small GTP-binding protein in Ca(2+)-dependent exocytosis. Genes Cells
1996, 1:615-632.
22. DNA-array data analysis with SOTA [http://bioinfo.cnio.es/sotarray/]
23. Herrero J, Valencia A, Dopazo J: A hierarchical unsupervised growing neural network for clustering gene expression pat-terns. Bioinformatics2001, 17:126-136.
24. Vaarala MH, Porvari KS, Kyllonen AP, Mustonen MV, Lukkarinen O, Vihko PT: Several genes encoding ribosomal proteins are over-expressed in prostate-cancer cell lines: confirmation of L7a and L37 over-expression in prostate-cancer tissue samples. Int J Cancer1998, 78:27-32.
25. Pogue-Geile K, Geiser JR, Shu M, Miller C, Wool IG, Meisler AI, Pipas JM: Ribosomal protein genes are overexpressed in colorectal
comment
reviews
reports
deposited research
interactions
information
cancer: isolation of a cDNA clone encoding the human S3 ribosomal protein. Mol Cell Biol1991, 11:3842-3849.
26. Denis MG, Chadeneau C, Lecabellec MT, LeMoullac B, LeMevel B, Meflah K, Lustenberger P: Over-expression of the S13 ribosomal protein in actively growing cells. Int J Cancer1993, 55:275-280. 27. Henry JL, Coggin DL, King CR: High-level expression of the
ribosomal protein L19 in human breast tumors that over-express erbB-2. Cancer Res 1993, 53:1403-1408.
28. Boon K, Caron HN, van Asperen R, Valentijn L, Hermus MC, van Sluis P, Roobeek I, Weis I, Voute PA, Schwab M, et al.: N-myc enhances the expression of a large set of genes functioning in ribosome biogenesis and protein synthesis. EMBO J2001, 20:1383-1393.
29. Angelastro JM, Torocsik B, Greene LA: Nerve growth factor selectively regulates expression of transcripts encoding ribosomal proteins. BMC Neurosci2002, 3:3.
30. Hughes TR, Marton MJ, Jones AR, Roberts CJ, Stoughton R, Armour CD, Bennett HA, Coffey E, Dai H, He YD,et al.: Functional dis-covery via a compendium of expression profiles. Cell 2000, 102:109-126.
31. Greco A, Laurent AM, Madjar JJ: Repression of beta-actin syn-thesis and persistence of ribosomal protein synsyn-thesis after infection of HeLa cells by herpes simplex virus type 1 are under translational control. Mol Gen Genet 1997, 256:320-327. 32. Enriquez JA, Fernandez-Silva P, Montoya J: Autonomous
regula-tion in mammalian mitochondrial DNA transcripregula-tion. Biol Chem1999, 380:737-747.
33. Gene Ontology Consortium[http://www.geneontology.org/] 34. Brin S, Motwani R, Ullman JD, Tsur S: Dynamic itemset counting
and implication rules for market basket data.In Proc ACM Conf SIGMOD 97. New York: ACM Press; 1997:255-264.
35. Smyth P, Goodman RM: An information theoretic approach to rule induction from databases. IEEE Trans Knowledge Data Eng 1992, 4:301-316.
36. Boulicaut J-F, Jeudy B: Mining free sets under constraints.In Proc Int Database Engineering and Applications Symp IDEAS 01. Grenoble, France: IEEE Computer Press; 2001: 322-329.
37. SPSS: Clementine Reference Manual Version 5. Chicago, IL: Integral Solutions Limited/SPSS; 1998.
38. Witten IH, Frank E: Data Mining - Practical Machine Learning Tools and Techniques with JAVA Implementations. San Francisco, CA: Morgan Kaufmann; 2000.