Isothermal Technology than of Real-Time PCR for Quantification of
HIV-1 RNA on Dried Blood Spots
Severine Mercier-Delarue,aMuriel Vray,bJean Christophe Plantier,cTheodora Maillard,aZidan Adjout,aFabienne de Olivera,b Nathalie Schnepf,aSarah Maylin,aFrancois Simon,aConstance Delaugerrea
‹Laboratoire de Virologie, AP-HP-Hôpital Saint Louis, INSERM U941–Université Paris Diderot, Sorbonne Paris Cité, Paris, Francea; Unité d’Epidémiologie des Maladies Emergentes, Institut Pasteur, INSERM, Paris, Franceb; Laboratoire Associé au CNR du VIH Hôpital Charles Nicolle, CHU de Rouen, Université de Rouen, Rouen, Francec
Dried blood spots (DBS) are widely proposed as a plasma surrogate for monitoring antiretroviral treatment efficacy based on the HIV-1 RNA level (viral load [VL]) in resource-limited settings. Interfering coamplification of cell-associated HIV-1 DNA during reverse transcription (RT)-PCR can be avoided by using nucleic acid sequence-based amplification (NASBA) technology, which is based on an RNA template and isothermic conditions. We analyzed VL values obtained with DBS and plasma samples by com-paring isothermic NASBA (NucliSENS EasyQ HIV-1 V2.0; bioMérieux) with real-time RT-PCR (Cobas TaqMan HIV-1 V2.0; Roche). Samples from 197 HIV-1-infected patients were tested (non-B subtypes in 51% of the cases). Nucleic acid extractions were performed by use of NucliSENS EasyMAG (bioMérieux) and Cobas AmpliPrep (Roche) before the NASBA and RT-PCR quantifications, respectively. Both quantification assays have lower limits of detection of 20 (1.3) and 800 (2.9) log10copies/ml (log) in plasma and DBS, respectively. The mean (DBS minus plasma) differences wereⴚ0.39 andⴚ0.46 log, respectively, for RT-PCR and NASBA. RT-PCR on DBS identified virological failure in 122 of 126 patients (sensitivity, 97%) and viral suppres-sion in 58 of 70 patients (specificity, 83%), yielding 12 false-positive results (median, 3.2 log). NASBA on DBS identified virologi-cal failure in 85 of 96 patients (sensitivity, 89%) and viral suppression in 95 of 97 patients (specificity, 98%) and yielded 2 false-positive results (3.0 log for both). Both technologies detected HIV-1 RNA in DBS at a threshold of 800 copies/ml. This higher specificity of NASBA technology could avoid overestimation of poor compliance or the emergence of resistance when monitor-ing antiretroviral efficacy with the DBS method.
T
he increasing availability of antiretroviral drugs for HIV-in-fected populations in developing countries calls for more field-friendly methods for HIV-1 viral load monitoring during treatment.The gold standard for HIV-1 viral load measurement is analy-sis of plasma samples by means of reverse transcription (RT)-PCR, isothermal nucleic acid-based amplification assay (NASBA), or branched DNA signal amplification assay (bDNA). As viral load assay methods currently require adequate facilities with com-plex equipment and specialized personnel, shipment of plasma samples to reference laboratories has been proposed as an alterna-tive. However, this requires cool storage and compliance with strict regulations governing the transport of infectious substances. Dried fluid spot specimens have been shown to be a viable alter-native to plasma specimens for PCR-based early diagnosis of HIV-1 infection in infants (1–3). Dried blood spot (DBS) speci-mens are particularly suited to resource-limited settings, because they require minimal training to prepare. Furthermore, DBS are stable at ambient temperature for several weeks (4), are deemed nonhazardous once dried, and can be shipped by regular mail to specialized reference laboratories for HIV-1 RNA quantification (5–9).
The sensitivity of viral load analysis on DBS is an important factor, especially for detecting viral rebound in antiretroviral treatment (ART)-experienced patients. Four main commercial assays for HIV-1 RNA quantification have been evaluated on DBS samples, NASBA (Organon Teknika, Durham, NC), NucliSENS (bioMérieux, Lyon, France), Amplicor HIV-1 monitor (Roche Diagnostics Molecular Systems, Alameda, CA), and Abbott
Real-Time HIV-1 (Abbott Diagnostics Des Plaines, Chicago, IL), with detection thresholds between 3.5 and 4 log copies per ml (6,7,9). Sensitivity is lower with DBS than with plasma samples by around
⫺0.3 to⫺0.8 log (10–12).
Recent evaluation of NucliSENS EasyQ HIV-1 V2.0 (based on NASBA technology) on DBS and plasma samples under different storage conditions (temperature, humidity, and duration) showed that DBS samples yielded 100% specificity, linear results over a wide range of viral loads, and a detection limit of 800 cop-ies/ml (13). This complies with recent WHO guidelines defining virological failure as a plasma HIV-1 RNA level of⬎1,000 cop-ies/ml (14).
Most relevant studies have been performed on samples from patients living in Africa, where HIV-1 viral diversity is very high. However, the accuracy of HIV-1 quantification in DBS versus plasma samples has not been studied according to different HIV-1 subtypes.
In whole blood, HIV nucleic acids are present as RNA in the plasma matrix and as DNA in the cell matrix. Most platforms use
Received12 August 2013 Returned for modification8 September 2013
Accepted9 October 2013
Published ahead of print16 October 2013
Editor:A. M. Caliendo
Address correspondence to Constance Delaugerre, [email protected].
Copyright © 2014, American Society for Microbiology. All Rights Reserved.
doi:10.1128/JCM.01848-13
on May 16, 2020 by guest
http://jcm.asm.org/
RT-PCR to amplify conserved regions of the HIV-1 genome after nucleic acid extraction. RT-PCR may thus coamplify both RNA and DNA, if present, potentially leading to false-positive results for virological failure. Conversely, NASBA technology is based on the use of an RNA template to initiate amplification under isothermic conditions, thus avoiding amplification of any viral DNA. The frequency of false-positive results for virological failure has not been compared between RT-PCR and NASBA.
Here we compared the isothermic NASBA assay (NucliSENS EasyQ HIV-1 V2.0; bioMérieux) with a real-time RT-PCR-based assay (Cobas TaqMan HIV-1 V2.0; Roche) for HIV-1 RNA quan-tification in a large number of DBS and plasma specimens con-taining a broad range of viral loads and HIV-1 subtypes.
MATERIALS AND METHODS
Ethics statements.This was a noninterventional study with no addition to usual procedures. Biological specimens were obtained for only stan-dard viral diagnosis requested by physicians (no specific sampling, no modification of the sampling protocol, no supplementary questions in the national standardized questionnaire). The results were analyzed using an anonymized database. French Public Health Law CSP Art. L 1121-1.1 states that such studies without supplemental blood sampling do not re-quire ethics approval and rere-quire only oral informed consent. The CPP Ile de France IV ethics committee waived the requirement for ethics approval (agreement no. IRB 00003835).
Preparation of DBS samples.We prospectively collected 197 plasma and whole-blood samples from EDTA tubes sent to the laboratory for HIV-1 resistance genotyping, as recommended in antiretroviral-naive pa-tients and in papa-tients with suspected treatment failure (plasma viral load [pVL] above 50 copies/ml). This yielded a wide range of pVL values and allowed us to take HIV-1 strain diversity into account. Before centrifuga-tion, fresh blood was thoroughly homogenized. Aliquots of 50l of whole blood from each patient were spotted on filter paper (five spots per card, no. 903 Protein Saver cards; Whatman) then air dried and stored in sealed bags at ambient temperature.
Plasma, collected after 20 min of centrifugation at 3,000⫻g, was stored at⫺80°C in 1.5-ml aliquots for batch testing. One milliliter of each plasma sample was processed according to the instructions of the manu-facturers of the NucliSENS EasyMAG and Cobas AmpliPrep assays.
Viral load determination by NASBA.Each DBS on each card was cut out using sterile scissors. For each analysis, two spots from each patient (total 100l) were eluted in 2 ml of NucliSENS lysis buffer and incubated on a roller mixer for 2 h at room temperature. The filter paper was then removed from the tube and the lysate was further processed using NucliSENS EasyMAG according to the manufacturer’s instructions; the total lysate volume of 2 ml was used for extraction (bioMérieux). Nucleic acids were isolated using Boom’s silica-based technology.
Viral load was also quantified with NucliSENS EasyQ HIV-1 V2.0 (bioMérieux, Lyon, France) according to the manufacturer’s instructions. The linear dynamic range of this assay spans 25 (1.4 log10) to 3,000,000
(6.4 log10) HIV-1 RNA copies/ml when 1 ml of plasma is used. The lower
limit of quantification is 800 copies/ml when 2 spots of 50l of whole blood are used (13). The limit of detection is 100 copies/ml, and qualita-tive results are obtained below 800 copies/ml (negaqualita-tive,⬍100 copies/ml; positive, between 100 and 800 copies/ml).
Viral load determination by RT-PCR.Two spots per patient were eluted as described above for the NASBA method. One milliliter of lysis buffer was extracted using Cobas AmpliPrep, leading to a doubling of real pVL values throughout the analysis.
Total nucleic acids were extracted from plasma and DBS samples by using the Cobas AmpliPrep (Roche) system, which uses a generic silica-based capture method. Viral load was then measured with Cobas TaqMan HIV-1 V2.0 (Roche) according to the manufacturer’s instructions. The linear dynamic range of the assay spans 20 (1.3 log10) to 10,000,000 (7
log10) HIV RNA copies/ml when 1 ml of plasma is used. As no
informa-tion was available for the use of this assay on DBS, we decided to use the same limit of quantification and detection cutoffs of 800 and 100 cop-ies/ml for plasma and DBS, respectively, as for the NucliSENS EasyQ HIV-1 V2.0 assay.
Determination of HIV-1 subtypes.The HIV-1 subtype was deter-mined by sequencing thePolregion (protease and reverse transcriptase) on a 16-capillary sequencer (ABI PRISM Genetic Analyzer; Applied Bio-systems, Les Ulis, France), with respect to the Los Alamos HIV sequence database (HIV BLAST [http://www.hiv.lanl.gov/]). When this sequencing method failed, serotyping was performed as previously described (15) and the results were expressed as subtype B or non-B.
Statistical analysis.To evaluate correlations between the different technologies, all viral RNA values were recorded as log10-transformed
copy numbers of HIV-1 RNA per milliliter of DBS or plasma. Negative samples and samples below the detection threshold were attributed the lower threshold value, while those above 10,000,000 copies were attrib-uted a value of 10,000,000 copies/ml. Results obtained for DBS specimens were not corrected for the hematocrit.
For each method, pVL was expressed as log10copies/ml, together with
the median, interquartile ranges (25 to 75%), and mean⫾standard de-viation (SD), both for all the plasma and DBS samples and also according to the HIV-1 subtype (B versus non-B). The Mann-Whitney two-sample test was used to compare median VL values according to the viral subtype. The Spearman rank correlation test and intraclass correlation coeffi-cient were used to measure the correlation between RNA values obtained for DBS and plasma samples with each technology. The concordance be-tween DBS and plasma samples was assessed by using the Bland-Altman approach, in which the differences in VL (equal and above 2.9 log) in the two sample types were plotted against the mean VL of each technology. In DBS and plasma samples, agreement of the results for the detection of virological failure obtained with each technology, using a threshold of 800 copies/ml (2.9 log10), was assessed by using kappa statistics and the Lan-dis-Koch interpretation scale (kappa values of⬍0.40 indicate poor agree-ment;⬎0.40 and⬍0.75, fair to good agreement; and⬎0.75, excellent agreement).Pvalues were determined using Fisher’s exact test.
All analyses were performed with STATA statistical software (version 12). Differences were considered significant whenPvalues were below 0.05.
RESULTS
HIV-1 quantification according to the viral subtype.Paired plas-ma-DBS specimens from 197 patients were collected and tested with both technologies. HIV-1 subtype results were available for 187 (94.4%) patients and were in keeping with the subtype diver-sity in France (16). Among these 187 patients, 91 (49%) were infected by the B subtype and 96 (51%) by non-B subtypes, as follows: 28 (15%) CRF02_AG, 17 (9%) complex recombinants, 4 (2%) G, 4 (2%) F, 3 (1.6%) A, 3 (1.6%) H, 2 (1%) CRF01_AE, 2 (1%) CRF22_01A1, 1 (0.5%) CRF18_cpx, 1 (0.5%) CRF36_cpx, and 1 (0.5%) CRF45_cpx. The remaining 30 samples (16%) could not be genotyped but were classified as non-B by serotyping. The viral subtypes were grouped together as B or non-B for subsequent analysis.
Table 1shows the median (interquartile range [IQR; 25 to 75%]) VL values obtained on DBS and plasma samples with the two technologies, both for all samples and according to the B and non-B subtypes. Overall, median VL values in plasma and DBS were 3.2 and 3.4 log copies/ml, respectively, with the RT-PCR method and 2.8 and 2.9 log copies/ml, respectively, with the NASBA method. No differences were found between B and non-B subtypes with either method (P⬍0.5 for all compari-sons).
on May 16, 2020 by guest
http://jcm.asm.org/
Correlation between DBS and plasma values obtained by RT-PCR.Among the 105 samples with a plasma VL ofⱖ2.9 log by RT-PCR, the mean⫾SD values for plasma and DBS samples, respectively, were 4.7⫾0.86 log copies/ml and 4.3 ⫾0.80 log copies/ml, and the median (IQR) values were 4.8 log (4.2 log, 5.2 log) and 4.3 log (3.7 log, 4.9 log).
The correlation coefficient for plasma and DBS VL values was r2⫽0.76 (Fig. 1a) (Spearman rank correlation test) and the intra-class correlation coefficient (confidence interval [CI]) was 0.77 (0.69 to 0.85). The Bland-Altman plot inFig. 1bshows that the mean of the difference between DBS and plasma was⫺0.39 log (limits of agreement,⫺1.26 and 0.47), regardless of the VL level and viral subtype. A significant difference was observed for 6 sam-ples (5.7%), with 5 (3 non-B and 2 B subtypes) above the upper limit (0.47 log) in DBS compared to those in plasma and 1 non-B subtype above the lower limit (⫺1.26 log) in plasma compared to those in DBS (Fig. 1b).
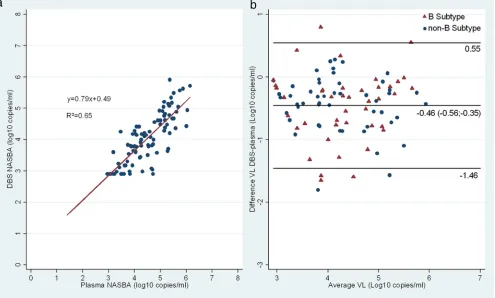
Correlation between DBS and plasma values obtained by NASBA.Using NASBA technology, among the 93 samples with a pVL ofⱖ2.9 log, the mean⫾SD values for plasma and DBS, respectively, were 4.5⫾0.81 log10copies/ml and 4.0⫾0.79 log copies/ml, and the median (IQR) values were 4.5 log (3.9 log, 5.2 log) and 4.0 log (3.4 log, 4.6 log).
The correlation coefficient for viral loads in plasma versus DBS was 0.65 (Fig. 2a) (Spearman rank correlation test) and the intra-class correlation coefficient (CI) was 0.67 (0.56 to 0.78). The Bland-Altman plot inFig. 2bshows that the mean of the difference between DBS and plasma was⫺0.46 log (limits of agreement from
⫺1.46 to 0.55), regardless of the VL level and viral subtype. A significant difference was observed for 7 (7.5%) samples, with two B subtypes above 0.55 log on DBS compared to those in plasma and 5 (3 B and 2 non-B subtypes) above⫺1.46 log in plasma compared to those in DBS.
Concordance of HIV-1 RNA viral loads measured in DBS and plasma with RT-PCR and NASBA.The reliability of DBS specimens for detecting virological failure was evaluated by using plasma specimens as the reference for each method, and the rec-ommended threshold (800 copies/ml). As shown inTable 2, there was excellent overall agreement between DBS and plasma speci-mens for detecting VL above 800 copies/ml, withP values of
⬍0.001 for both methods and kappa statistics of 0.82 (RT-PCR) and 0.86 (NASBA). RT-PCR correctly identified virological failure on DBS specimens from 122 of the 126 patients concerned (sen-sitivity, 97%; positive predictive value, 91%) and viral suppression on DBS specimens from 58 of 70 patients (specificity, 83%; nega-tive predicnega-tive value, 94%). PCR on DBS specimens yielded 12 false-positive results (median 3.2 [range, 2.9 to 3.6] log, with 8 B, 1 non-B, and 3 undetermined subtypes).
Likewise, NASBA correctly identified virological failure on DBS specimens from 85 of the 96 patients concerned and viral suppression in 95 of 97 patients (positive predictive value, 98%; negative predictive value, 90%). NASBA on DBS yielded 2 false-positive results (2 B subtypes, 3.0 log for both).
DISCUSSION
[image:3.585.41.287.88.209.2]The NASBA and RT-PCR methods each gave similar VL values for DBS and plasma specimens, with high correlation coefficients (⬎0.80) and few values outside the agreement limits of the Bland-Altman plot (⬍7.5%). In keeping with previous data obtained in countries with strong HIV diversity (17), we found no significant difference in VL values between B and non-B subtypes (8,9,12,
TABLE 1HIV-1 viral load determined by RT-PCR and NASBA on DBS and plasma for all samples and according to viral subtype
Assay and sample type
HIV-1 viral load (median [IQR]) (log10copies/ml) of:
All samples (n⫽197)
B subtype (n⫽91)
Non-B subtype (n⫽96)
PCR
Plasma 3.2 (1.7–4.9) 3.5 (1.8–4.9) 3.3 (2.1–5) DBS 3.4 (2.9–4.4) 3.4 (2.9–4.4) 3.6 (2.9–4.5)
NASBA
Plasma 2.8 (1.4–4.4) 2.8 (1.4–4.6) 3.4 (1.4–4.2) DBS 2.9 (2.9–3.9) 2.9 (2.9–4.0) 2.9 (2.9–4.1)
FIG 1(a) Correlation curve for VL on plasma and DBS using RT-PCR. (b) Bland-Altman representation of VL in plasma and DBS using RT-PCR.
on May 16, 2020 by guest
http://jcm.asm.org/
[image:3.585.125.461.507.708.2]18), although it should be noted that we grouped together all non-B subtypes for analysis, while these subtypes encompass broad genetic diversity.
Overall, VL values obtained with DBS specimens tended to be lower than those obtained with the corresponding plasma sam-ples, with a mean difference of around 0.4 log10copies/ml. This difference has previously been noted with the NucliSENS, Abbott, and Roche methods (10, 11) and is likely due to differences in specimen volume and in the quality of nucleic acid extraction. VL values obtained with DBS specimens should thus not be compared with VL values previously obtained for plasma samples when monitoring therapeutic efficacy in a given patient.
A lower limit of HIV-1 RNA detection above 5,000 copies/ml has been reported for DBS specimens (10,11). This was in keeping with 2012 World Health Organization (WHO) recommendations in which persistent VL above 5,000 copies/ml was considered to confirm treatment failure. However, the new WHO guideline pre-sented in June 2013 defines virological failure as a plasma VL above 1,000 copies/ml (14). We therefore analyzed the perfor-mance of DBS and plasma samples for detecting virological failure at a threshold of 800 copies/ml, a threshold validated for the NucliSENS EasyQ HIV-1 V2.0 test. Excellent overall agreement was obtained between DBS and plasma specimens for detecting VL above 800 copies/ml. Both methods detected virological failure
[image:4.585.47.542.68.366.2]FIG 2(a) Correlation curve for VL on plasma and DBS using NASBA. (b) Bland-Altman representation of VL in plasma and DBS using NASBA.
TABLE 2Concordance between RT-PCR and NASBA on plasma and DBS for identifying virological failure
Assay type and VL (log copies/ml) for DBS specimens
No. of plasma samples with VL of:
Total no.
Kvalue (mean⫾SE
[95% confidence interval]) P
Performance values (%) of PCR and NASBA assaysa ⬍2.9 log
copies/ml
⬎2.9 log copies/ml
RT-PCR 0.82⫾0.04 (0.74–0.90) ⬍0.001 Sensitivity, 97; specificity, 83;
PPV, 91; NPV, 94
VL⬍2.9 58 4 62
VL⬎2.9 12 122 134
Total 70 126 196
NASBA 0.86⫾0.04 (0.78–0.94) ⬍0.001 Sensitivity, 89; specificity, 98;
PPV, 98; NPV, 90
VL⬍2.9 95 11 106
VL⬎2.9 2 85 87
Total 97 96 193
aPPV, positive predictive value; NPV, negative predictive value.
on May 16, 2020 by guest
http://jcm.asm.org/
[image:4.585.41.545.573.715.2]on DBS specimens with high sensitivity (from 89% to 97%). How-ever, specificity was lower with RT-PCR (83%) than with NASBA (98%), leading to more false-positive results for virological failure. This is in keeping with a previous study of whole-blood samples (18), in which 64 (23%) of 278 “undetectable” plasma specimens (ⱕ500 copies/ml) analyzed with Cobas TaqMan real-time RT PCR (Roche) had positive corresponding DBS samples. PCR co-amplifies cell-associated HIV DNA with HIV RNA, whereas the NASBA method with its isothermal amplification design mini-mizes the contribution of proviral DNA to VL measurement. Our study confirms this higher rate of false positives with RT-PCR (11%) than with NASBA (2%), at a threshold of 800 copies/ml. A modified extraction procedure specific for RNA has recently been proposed to avoid this DNA coamplification. Using the Abbott RealTime HIV-1 assay based on RT-PCR technology, Mbida et al. found a lower rate of false-positive amplification, as all plasma samples that were undetectable were also undetectable on the cor-responding DBS (9). As RT-PCR is widely available in developing countries, DNA coamplification could be avoided by specific RNA extraction, the use of DNase, or raising the VL quantification threshold above 3 log. In contrast, coamplification of HIV DNA and RNA by PCR may be useful for diagnosing HIV infection in newborns receiving preventive antiretroviral treatment.
In conclusion, dried blood specimens are a suitable alternative to plasma samples for HIV-1 viral load measurement. Indeed, both PCR and NASBA gave satisfactory results on DBS in com-parison with plasma, for both B and non-B subtypes, the latter being most prevalent in resource-limited settings (17). DBS cor-rectly identified virological failure at the new WHO threshold of 1,000 copies/ml, but the NucliSENS EasyQ HIV-1 v2.0 assay showed better specificity than RT-PCR. This NASBA method can thus accurately detect treatment failure at an early stage, allowing rescue intervention to avoid accumulation of drug resistance mu-tations.
ACKNOWLEDGMENTS
We thank bioMérieux and Roche for kindly providing reagents. Many thanks to Loic Chartier for his help in improving the quality of the figures.
REFERENCES
1.Comeau AM, Pitt J, Hillyer GV, Landesman S, Bremer J, Chang BH, Lew J, Moye J, Grady GF, McIntosh K.1996. Early detection of human immunodeficiency virus on dried blood spot specimens: sensitivity across serial specimens. Women and Infants Transmission Study Group. J. Pe-diatr.129:111–118.
2.Sherman GG, Stevens G, Jones SA, Horsfield P, Stevens WS. 2005. Dried blood spots improve access to HIV diagnosis and care for infants in low-resource settings. J. Acquir. Immune Defic. Syndr.38:615– 617.http: //dx.doi.org/10.1097/01.qai.0000143604.71857.5d.
3.Stevens W, Erasmus L, Moloi M, Taleng T, Sarang S.2008. Performance of a novel human immunodeficiency virus (HIV) type 1 total nucleic acid-based real-time PCR assay using whole blood and dried blood spots for diagnosis of HIV in infants. J. Clin. Microbiol.46:3941–3945.http://dx .doi.org/10.1128/JCM.00754-08.
4.Monleau M, Butel C, Delaporte E, Boillot F, Peeters M.2010. Effect of storage conditions of dried plasma and blood spots on HIV-1 RNA quan-tification and PCR amplification for drug resistance genotyping. J. Antimicrob. Chemother. 65:1562–1566. http://dx.doi.org/10.1093/jac /dkq205.
5.Alvarez-Muñoz MT, Zaragoza-Rodríguez S, Rojas-Montes O, Palacios-Saucedo G, Vázquez-Rosales G, Gómez-Delgado A, Torres J, Muñoz O. 2005. High correlation of human immunodeficiency virus type-1 viral load measured in dried-blood spot samples and in plasma under different
storage conditions. Arch. Med. Res. 36:382–386. http://dx.doi.org/10 .1016/j.arcmed.2005.03.010.
6.Amellal B, Katlama C, Calvez V.2007. Evaluation of the use of dried spots and of different storage conditions of plasma for HIV-1 RNA quan-tification. HIV Med.8:396 – 400.http://dx.doi.org/10.1111/j.1468-1293 .2007.00484.x.
7.Brambilla D, Jennings C, Aldrovandi G, Bremer J, Comeau AM, Cassol SA, Dickover R, Jackson JB, Pitt J, Sullivan JL, Butcher A, Grosso L, Reichelderfer P, Fiscus SA.2003. Multicenter evaluation of use of dried blood and plasma spot specimens in quantitative assays for human immu-nodeficiency virus RNA: measurement, precision, and RNA stability. J. Clin. Microbiol.41:1888 –1893.http://dx.doi.org/10.1128/JCM.41.5.1888 -1893.2003.
8.Mwaba P, Cassol S, Nunn A, Pilon R, Chintu C, Janes M, Zumla A. 2003. Whole blood versus plasma spots for measurement of HIV-1 viral load in HIV-infected African patients. Lancet362:2067–2068.http://dx .doi.org/10.1016/S0140-6736(03)15103-3.
9.Mbida AD, Sosso S, Flori P, Saoudin H, Lawrence P, Monny-Lobé M, Oyono Y, Ndzi E, Cappelli G, Lucht F, Pozzetto B, Oukem-Boyer OOM, Bourlet T.2009. Measure of viral load by using the Abbott Real-Time HIV-1 assay on dried blood and plasma spot specimens collected in 2 rural dispensaries in Cameroon. J. Acquir. Immune Defic. Syndr.52:9 – 16.http://dx.doi.org/10.1097/QAI.0b013e3181aeccbc.
10. Monleau M, Montavon C, Laurent C, Segondy M, Montes B, Delaporte E, Boillot F, Peeters M.2009. Evaluation of different RNA extraction methods and storage conditions of dried plasma or blood spots for human immunodeficiency virus type 1 RNA quantification and PCR amplifica-tion for drug resistance testing. J. Clin. Microbiol.47:1107–1118.http://dx .doi.org/10.1128/JCM.02255-08.
11. Garrido C, Zahonero N, Corral A, Arredondo M, Soriano V, De Mendoza C.2009. Correlation between human immunodeficiency virus type 1 (HIV-1) RNA measurements obtained with dried blood spots and those obtained with plasma by use of NucliSENS EasyQ HIV-1 and Abbott RealTime HIV load tests. J. Clin. Microbiol.47:1031–1036.http://dx.doi .org/10.1128/JCM.02099-08.
12. Rottinghaus EK, Ugbena R, Diallo K, Bassey O, Azeez A, Devos J, Zhang G, Aberle-Grasse J, Nkengasong J, Yang C.2012. Dried blood spot specimens are a suitable alternative sample type for HIV-1 viral load measurement and drug resistance genotyping in patients receiving first-line antiretroviral therapy. Clin. Infect. Dis.54:1187–1195.http://dx.doi .org/10.1093/cid/cis015.
13. Van Deursen P, Oosterlaken T, Andre P, Verhoeven A, Bertens L, Trabaud MA, Ligeon V, De Jong J.2010. Measuring human immuno-deficiency virus type 1 RNA loads in dried blood spot specimens using NucliSENS EasyQ HIV-1 v2.0. J. Clin. Virol.47:120 –125.http://dx.doi .org/10.1016/j.jcv.2009.11.021.
14. World Health Organization.2013. Consolidated guidelines on the use of antiretroviral drugs for treating and preventing HIV infection: recom-mendations for a public health approach. World Health Organization, Geneva, Switzerland. http://www.who.int/hiv/pub/guidelines/arv2013 /download/en/index.html.
15. Barin F, Plantier J-C, Brand D, Brunet S, Moreau A, Liandier B, Thierry D, Cazein F, Lot F, Semaille C, Desenclos J-C.2006. Human immuno-deficiency virus serotyping on dried serum spots as a screening tool for the surveillance of the AIDS epidemic. J. Med. Virol.78(Suppl 1):S13–S18.
http://dx.doi.org/10.1002/jmv.20600.
16. Chaix M-L, Seng R, Frange P, Tran L, Avettand-Fenoël V, Ghosn J, Reynes J, Yazdanpanah Y, Raffi F, Goujard C, Rouzioux C, Meyer L, Cohort Study Group ANRS PRIMO. 2013. Increasing HIV-1 non-B subtype primary infections in patients in France and effect of HIV sub-types on virological and immunological responses to combined antiretro-viral therapy. Clin. Infect. Dis.56:880 – 887.http://dx.doi.org/10.1093/cid /cis999.
17. Taylor BS, Sobieszczyk ME, McCutchan FE, Hammer SM.2008. The challenge of HIV-1 subtype diversity. N. Engl. J. Med.358:1590 –1602.
http://dx.doi.org/10.1056/NEJMra0706737.
18. Waters L, Kambugu A, Tibenderana H, Meya D, John L, Mandalia S, Nabankema M, Namugga I, Quinn TC, Gazzard B, Reynolds SJ, Nelson M.2007. Evaluation of filter paper transfer of whole-blood and plasma samples for quantifying HIV RNA in subjects on antiretroviral therapy in Uganda. J. Acquir. Immune Defic. Syndr.46:590 –593.http://dx.doi.org /10.1097/QAI.0b013e318159d7f4.