2019 International Conference on Computer Science, Communications and Big Data (CSCBD 2019) ISBN: 978-1-60595-626-8
Improved Force
-Directed Layout
Algorithm for Social
Network Visualization
Sheng-Nan ZHANG
1and Xin JIANG
2,*1School of Software, Shenyang University of Technology, Shenyang, 110870, China
2School of Information Science and Engineering, Shenyang University of Technology,
Shenyang, 110870, China
*Corresponding author
Keywords: Visualization, Social network, Force-directed layout, Key nodes.
Abstract. In large-scale social network visualization, the layout results often have visual confusion suchas overlapping nodes, crossing edge, and lack of highlighting of key nodes. Therefore, this paper proposed an improved force-directed layout algorithm. Based on the FR algorithm, we considered the degree of the nodes, adjusted the repulsive force, and then highlighted the key nodes according to the degree of centrality and betweenness centricity of the nodes. Furthermore, when calculating the distance of gravitation or repulsion between two nodes, we considered the size of the node itself, and the "boundary-to-boundary" distance for avoiding overlapping between nodes was introduced, thus the clear community structure division was obtained. The experimental results show that the algorithm fully demonstrates the key information and clear community structure of social network, and has practical application value.
Introduction
Information visualization of social network is a research hotspot in the field of visualization. With the help of visualization technology, users can quickly, efficiently and deeply understand, predict and discover specific phenomena in social network. Network visualization involves key technologies such as network structure layout, network attribute visualization and user interaction, and its core is to study how to distribute and display network information in a certain visual space[1]. At present, network visualization layout mainly adopts node-link layout method, that is, vertices are used to represent individuals in the network, and connecting lines (edges) between nodes to show the relationship between individuals, the social relations in the real world are abstracted into node-link structure [2]. Force-directed layout algorithm is a classical node-link layout method, which is based on the principle of physical forces to generate a network layout with uniform distribution of nodes and edges, better symmetry and local aggregation.
With the development of internet technology, network data has grown rapidly. Because of the small-world and scale-free characteristics of social networks, when the scale of the network becomes larger, the traditional force-directed layout algorithm is prone to cause visual confusion such as overlapping nodes and edges, which makes it difficult to distinguish the network structure and obtain key nodes clustering information, and the layout is not readable. In addition, the traditional layout method is not clear about the division of communities, the clustering effect is poor, the key nodes cannot be effectively highlighted, and the information obtained is incomplete.
In view of the problems existing in large-scale social network visualization, this paper improved the classical force-directed layout algorithm—FR algorithm. The goal of this algorithm is to highlight key nodes, avoid overlapping nodes, make the community structure clear, and the layout result has good adaptability and effectiveness.
Force-directed Layout and Its Improved Algorithm
When the system is given an initial state, the spring force will cause the steel ring to move until the total energy of the system is reduced to a minimum [3].
The force-directed elastic model is easy to understand and implement, but the computational overhead is large, so a series of improved algorithms appear later. The most typical FR algorithm is based on the elastic model, it simulates nodes as atoms, and each node moves continuously under the action of gravitation and repulsion until the system is in equilibrium. The FR algorithm used gravitation fa between connected nodes, used repulsion fr between all nodes,
2
2 a
r
d f
k k f
d
(1)
Where, d is the Euclidean distance between two nodes, k is the equilibrium coefficient, which is related to the width and height of the scene. The algorithm used the simulated annealing method to judge if the whole system was in equilibrium, and achieved the convergence of the algorithm by continuously reducing the energy of the system.
Social network belongs to the complex network. Aiming at the problem that traditional graph layout cannot effectively show the community structure of the network, Literature [4] firstly divided the network nodes into communities through the existing community partitioning algorithm, and then abstracted the communities into nodes to achieve the purpose of visualizing community structure. Literature [5] introduced community-gravity force to each node, and employed k-means algorithm to make nodes in the same community near to the center of the community.
Data in social networks is not only complex, but also huge. In order to globally display large-scale social networks, Literature [6] adopted parallelization techniques and layered ideas. The existing community discovery algorithm has the problem that the quality of the community does not meet the requirements of graph visualization and the efficiency of the algorithm is low. Based on modularity optimization, Literature [7] combined with pre-selection of seed nodes to merge small communities, and introduced community gravity to promote the convergence of nodes in the same community. Although the above-mentioned methods have improved the force-directed layout from different aspects, they all lack the prominence of key nodes in social network and the overlap of nodes, so that the intuitive and clear effect of network structure cannot be obtained from the layout results.
Improved Algorithm Design
Basic Idea of Algorithm
Social network has the characteristics of small-world and scale-free, the degree of nodes has a great impact on the visualization results. The importance of social network nodes is mainly measured by two indicators: degree centrality and betweenness centrality.
(1) Degree centrality: the degree to which the node is at the center of the network. For an undirected graph with n nodes, the degree of centrality C Nd( i) of node i is the total number of direct contacts with other n-1 nodes, expressed as a matrix as follows:
1
( ) n ( )
d i j ij
C N
x i j (2)(2) Betweenness centrality: The number of times a node is located on the shortest path between the other two nodes. If a node is on the shortest path of many other nodes, the node has a high betweenness centrality.
Assuming that gij is the number of shortest paths between i and j, the betweenness centrality of the
third node x is expressed byb xij( ), i.e. the probability that x is on the shortest path between i and j.
( ) ( ) ij ij
ij g x b x
g
(3)
If the absolute betweenness centrality CABx of the node i is calculated, the probability of whether there is a node x in the shortest path of all the node pairs in the graph is accumulated, that is:
( ), n n ABx i j ij
C
b x i j x and i j (4) As mentioned above, in order to meet the measurement criterion of node importance in social network, this algorithm introduced the degree of nodes into the force formula, adjusted the repulsive force, highlighted the key nodes according to the degree centrality and the betweenness centrality of nodes, so as to obtain the key information conveniently from the visual layout result. In addition, aiming at the visual confusion of overlapping nodes in traditional layout algorithm, when the algorithm calculated the distance between the gravitation or repulsion of two nodes, considering the size of the node itself, the "boundary-to-boundary" distance between the nodes to prevent overlapping was introduced to avoid overlapping of nodes.Algorithm Design
The algorithm is mainly divided into the following three steps: (1) Building an initial layout based on the FR algorithm
The FR algorithm is fast, simple and easy to implement, especially its layout has a good symmetry, which is consistent with the aesthetic standard of visualization. Therefore, the FR algorithm is very suitable as an initial graph layout. However, FR algorithm is only applicable to simple networks with simple structure and few nodes, it is not easy to find the structural features of social networks with small-world and scale-free characteristics. So we need the following two steps to improve the FR algorithm.
(2) Highlighting the key nodes of the network structure
In our algorithm, the repulsion force is adjusted based on the force formula of FR algorithm. The repulsive force between two nodes is proportional to the degree of two nodes, which weakens the repulsive force between the nodes with poor connection and those with high connection, and makes the nodes with poor connection close to the nodes with high connection, and finally reaches the equilibrium state. The adjusted repulsive force is:
1 2
1 2
1 2
(deg( ) 1)(deg( ) 1) ( , )
( , ) r
n n
F n n k
d n n
(5)
Where F n nr( ,1 2) represents the repulsive force of nodes n1 andn2, deg( )n1 , deg( )n2 represents
the degree of nodes n1 and n2, and d n n( ,1 2) represents the Euclidean distance between nodes n1 and
2
n . The deg( ) 1n in equation (5) is designed to ensure that the zero-degree nodes still have some repulsive force.
According to the degree centrality and betweenness centrality of nodes, key nodes are highlighted in the layout result of this algorithm. Then the algorithm calculated the average weighting degree of nodes. By highlighting, enlarging the nodes with high connectivity and high betweenness centrality, the community structure can be displayed and the key information can be easily obtained.
The average weighting degree also considers the weight of the edge when counting the node degrees. The average weighting degree of an undirected graph shown in Figure 1 is 1.4, and that of a digraph shown in Figure 2 is 0.7.
(3) Avoiding overlap and coverage of nodes
When calculating the distance between the gravitation and repulsion of two nodes, the algorithm considers the size of the node itself and introduces the parameter d ′, which is the "boundary-to-boundary" distance between overlapping nodes:
d′( ,n n1 2) d( ,n n1 2) size( )n1 size(n2) (6) When n1 and n2 denote two nodes, d n n( ,1 2) denotes the distance between the center of node n1
and the center of node n2, size( )n1 calculates the distance from the center of node n1 to the boundary
of the node. When d ′( ,n n1 2)0, it means that there is no overlap between nodes; when d ′( ,n n1 2)0, it means that there is overlap between nodes, then the gravitation between nodes is 0 and the repulsion increases; when d ′( ,n n1 2)0, it means that there is neither gravitation nor repulsion between nodes.
Visualization Examples and Analysis
In order to verify the effectiveness of the algorithm, we implemented the algorithm on Gephi platform. One social network data set was selected to test, verify and analyze the performance of the algorithm, and compared the layout result with FR algorithm.
Relational Network for Sending Letters between Cities
(1) Sample data set
[image:4.595.166.426.468.526.2]The experiment used a relational social network (including 55 cities in 13 European countries) to send letters between European cities, which was obtained from the official website of Stanford Large-Scale Network Data Set. The data set contains 1000 nodes and 14116 directed edges. Nodes represent cities and have latitude and longitude attributes. Directed edges between nodes represent sending letters from one city to another. Data sets are stored in comma-separated value (CSV) file format of electronic forms. Some information is shown in Tables 1 and 2.
Table 1. Partial nodes information of the relational network for sending letters between cities.
Id Label City Longitude Latitude
376088951 name1 Berlin 13.4 52.51
891347862 name230 Roma 12.49 41.89
517201178 name514 Bern 7.42 46.94
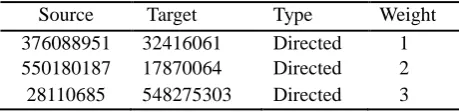
Table 2. Partial edges information of the relational network for sending letters between cities.
Source Target Type Weight
376088951 32416061 Directed 1 550180187 17870064 Directed 2 28110685 548275303 Directed 3
(2) Comparative analysis of the visualization result
[image:4.595.182.412.549.605.2]
Figure 3.FR layout algorithm. Figure 4.Layout effect diagram after improving repulsive force.
[image:5.595.315.484.93.190.2]From the visualization result of Figure 4, the whole force-directed layout shows excessive "stretching" of width, serious overlap of nodes and low utilization of screen space. At this time, when calculating the distance of gravitation or repulsion between two nodes, the size of the node itself is considered, and the "boundary-to-boundary" distance for avoiding overlapping between nodes is introduced, the final layout of the algorithm is obtained, as shown in Figure 5.
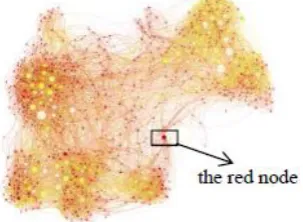
Figure 5. The layout effect diagram of the algorithm of this paper.
According to the comparison of the visualization layout result, the traditional FR algorithm in Figure 3 has a uniform overall layout and a similar distance between nodes. However, the community division in the layout is not obvious, the overlap of nodes is serious, and lack of highlighting of key nodes, so that effective information cannot be obtained from them. The algorithm layout of Figure 5 can visually observe the number and structure of communities in the network, effectively solve the problem of visual confusion, and clearly show the community structure and the key nodes of the network, such as light-colored highlighted nodes representing the core area of information transmission in the city. Communities do not exist independently, relying on the "bridge" of nodes (such as the red node circled by the black rectangular box in Figure 5), which represent the hub of information transmission. Consequently, the algorithm has obvious advantages in displaying community structure, key nodes and ensuring no overlap of nodes. The layout result also meets the aesthetic standards and has great application value.
Summary
Aiming at the visualization requirements of social networks, this paper proposed an improved force-directed layout algorithm for social network visualization. Based on the FR algorithm, the algorithm highlighted the key nodes, according to the degree of centrality and betweenness centrality of the nodes, and the overlapping of nodes is avoided, the community structure is clearly displayed, and the key information is conveniently obtained from the visualization result.
Acknowledgement
[image:5.595.224.376.305.416.2]References
[1] Wu P, Li SK. Layout algorithm suitable for structural analysis and visualization of social network. Journal of Software, 2011, 22(10):2467-2475. (in Chinese)
[2] Tang Ying, Sheng Fengfan, and Qin Xujia. A hierarchical visual abstraction method based on the improved force-directed graph layout. Journal of Computer-Aided Design & Computer Graphics, 2017, 29(4):641-650. (in Chinese)
[3] Eades P. A heuristics for graph drawing[J]. Congressus Numerantium, 1984, 42: 149-160
[4] Zhu Zhiliang, Lin Sen, Cui Kun, et al. Network topology layout algorithm based on community detection of complex networks. Journal of Computer-Aided Design & Computer Graphics, 2011, 23 (11): 1808-1815. (in Chinese)
[5] Wu Yu, Li Zaoxu, Li Hongbo, et al. A community-gravity-directed algorithm for showing community structure of complex networks. Journal of Computer-Aided Design & Computer Graphics, 2015, 27(8):1460-1467. (in Chinese)
[6] Gu Huijian, Han Zhongyuan, Xu Jiashu. Framework of parallel layout algorithm based on large-scale social networks. Computer Applications and Software, 2017, 34(1):73-78. (in Chinese)