Environment Sensing and Energy Efficient Smart
Sensor Switching
Dipanjan Bhattacharjee
Electronice & Communication
Sikkim Manipal institute of
Technology
Sikkim manipal University, India
Gangotri Chakraborty
Information technology
Sikkim Manipal institute of
Technology, Sikkim manipal
University, India
Sushabhan Choudhury
School of Technology, North
eastern Hill
UniversityMawaynroh,
umshing,Shillong, India
ABSTRACT
In this paper we present novel methods of energy efficient environment sensing in a very cost effective manner by a method called smart sensor switching. We have extracted the requirements of sensor switching and implemented various intelligent energy efficient protocols like dynamic sensor switching, sensor handover in the hardware platform which makes the sensing mechanism uninterrupted and highly energy efficient. The prototype hardware consists of five different gas sensors which are operated by centralized peripheral interface controller (PIC) based embedded system platform. The paper also describes a practical sensor switching mechanism with real time data, various dynamic and non dynamic sensor parameters have been considered in the designing scenario.
Keywords
Smart sensor switching, dynamic sensor switching, sensor handover, gas sensor, peripheral interface controller (PIC).
1.
INTRODUCTION
The importance of wireless sensor network is increasing day by day throughout the world due to modern sensor and embedded system technologies. Around the world would like to be sensed seamlessly anytime anywhere through the best sensor. Sensor node consists of large variety of heterogeneous sensors. The users would like to utilize heterogeneous sensor in a single platform without compromising the development cost and life time of the node. Many gas detecting systems have been developed which can detect different levels of gas concentrations effectively [1] [2]. In this paper we report the design and development of a reliable auto configurable smart wireless gas sensing system optimized for industrial application where system smartness and uninterrupted sensing are main concern. This is a typical gas sensing system with some additional features in contrast to other gas detection systems. The system provides highly secured and reliable data transmission over the network. It also detects presence of human at the site of leakage for timely rescue and will alert the appropriate security authority, temperature information sensed by temperature sensor which provides the danger level though
gas ignition hardly depends on the environmental temperature and pressure [3], it able to build gas concentration profile of the environment. If any abnormality take place the system will trigger an alarm situated; in such case a text message can be send to any where in the globe using a global system of mobile
communication (GSM) modulator and demodulator
Section 5 we describe various experimental results and there analysis, we conclude the paper in section 6.
2.
NEED FOR SENSOR SWITCHING AND
ITS CHALLENGES
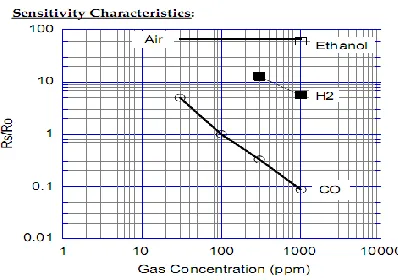
To enhance the sensing technology up to achieve the goal of “any time any concentration sensing through the best sensor” the sensor switching is highly desirable [10]. A sensor switching mechanism is the process of switch from one sensor to another when gas concentration about to cross sensing range of the particular sensor or to identify specific gases without interrupting the sensing process in most energy efficient way. The semiconductor type gas sensors can be broadly classified into two categories, first the detection range of the sensor and the sensitivity on various gases. TGS and MQ sensors are a type of thick film metal oxide semiconductor which offers low cost, long life, and good sensitivity to target gases while utilizing a simple electrical circuit. These sensors are especially suited to application in gas leak detectors for toxic and explosive gases. There are various challenges come across while practical implementing sensor switching mechanism. Fig.1 shows the detection range of some of the MQ and TGS gas sensors. From the figure it is clear that none of the single sensor can sense the gas concentration for a large span. If it is essential to measure large span of gas concentration, multiple sensors are required to operate simultaneously [11]. Average power consumption of the
Fig 1: Typical detection range of the gas sensors
sensor is around 835 milliwatt (mW) which is around 90 percentage of the system power. Activation of two sensors in parallel to sense a large span of gas will reduce system lifetime by 45 percentages which is not desirable. So to sense a large span of gas without increasing power consumption these sensors have to switch in appropriate gas concentration. Fig. 2 and fig. 3 shows the sensitivity characteristics of MQ2 and MQ7 gas sensor. MQ2 sensor is sensitive to multiple gases like carbon monoxide, iso-butane, ethanol, hydrogen. This characteristic have a advantage that in case of gas leakage of four different type of gases a single sensor is enough to detect, which reduces the development cost and power consumption. The draw back is
[image:2.612.332.551.106.262.2]that the sensor output response can not identify the type of gas. To identify the specific gas some special purpose sensors are required. fig. 3 shows sensitivity characteristics of MQ7 sensor
[image:2.612.340.539.295.435.2]Fig 2: Sensitivity characteristics of MQ2 gas sensor
Fig 3: Sensitivity characteristics of MQ7 gas sensor
it is specifically sensitive to carbon monoxide. In energy efficient way MQ2 can be used to detect four different gases by a single sensor instate of four different specific sensors to detect four different gases. By implementing the protocol three forth of power can be saved, and if gas identification is farther required the specific sensor can be powered on to identify the specific gas. To implement this energy efficient mechanism the sensor switching is compulsory. The system will on and off sensor as per the requirements. The sensor output depends on various factors like temperature and humidity dependency, heater voltage dependency, partial pressure, initial action. The main obstacles come across to perform the sensor switching are the requirement of complex electronic switching circuits and the initial or settling time (Ts) of the gas sensor. (Ts)is the time
required for a gas sensor to start sensing operation which has been elaborately discussed in the section 3.
3.
SMART SENSOR SWITCHING
[image:2.612.57.293.397.538.2]energized in air. The resistance drops sharply for the first few
Fig 4: Functionality of the Smart sensor switching
energize in air. The resistance drops sharply for the first few seconds after energizing, regardless of the presence of gases, and then reaches a stable level according to the ambient atmosphere. The length of initial action depends on the atmospheric conditions during storage and length of storage and varies by sensor model [12]. Typical value of Ts is around
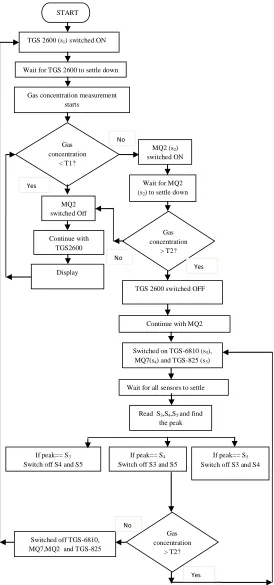
60sec.To understand the functionality of smart sensor switching three case studies is essential. Case 1 gas concentration is below threshold level 1 (T1) which is 90ppm. Case two gas concentration crosses the T1 but do not reach threshold point 2 (T2) which is 200ppm. Third case gas concentration cross both the threshold levels (T1 and T2).The process starts with the energizing S1 (TGS 2600), after settling time Ts (60 sec) system
checks for threshold level T1(90ppm) which is 90percent of the upper sensing limit of TGS 2600. Due to gas concentration below T1, MQ2 is not triggered and TGS 2600 continue the sensing process and display the gas concentration in LCD display with data refreshing rate of one sec. After initial system starts up a whole cycle completes in around 60 seconds. In case two the total cycle 2 completes in approximately 120 sec. On initial detection of gas concentration above T1 S2 (MQ2) triggered, it requires another 60 sec to settle down. S1 (TGS 2600) is in on condition until and unless S2 completes its initial action. This make before break handover approach established uninterrupted sensing during sensor switching. After completion of initial action MQ2 senses gas concentration, and due to it is still less then T2 (lower detection limit if MQ2), sensor 2 is switched off and sensor 1 continue the sensing process in cycle one. Case three is valid if gas concentration crosses both the threshold levels. Cycle three completes in approximately 180 sec. If gas concentration cross threshold T2, the three special
purpose sensors (S3, S4, S5). They are triggered for gas identification. On completion settling time of the S3, S4 and S5, system find out the peak value from these three sensors. On identification the specific gas remaining sensors are switched off to reduce the power consumption. The identified sensor continues the sensing process and continuously monitors gas concentration level. If concentration falls down below T2, then S2, S3, S4, S5 are switched off and cycle 1 starts again else cycle 3 repeats. To ensure uninterrupted sensing make before break(MBB) approach has been considered, that means the first sensor will not be turned off until second sensor become ready for sensing, not only that first sensor will not off until the concentration cross a certain level of the sensor 2 detection range.
3.1
Need for Dynamic Switching Time
Estimation
The smart sensor switching mechanism is discussed in section 3, from the discussion it is clear that when gas concentration reach threshold 1(90% detection range of sensor1) then only sensor2 is switched on by assuming that when gas concentration will reach upper detection range of sensor1 which is 100 ppm, sensor2 should complete its settling time Ts which is around 60 sec. Gas TGS 2600 (s1) switched ON
Wait for TGS 2600 to settle down Gas concentration measurement
starts
Gas concentration
< T1?
MQ2 (s2)
switched ON
Continue with TGS2600
Wait for MQ2 (s2) to settle down
Read S3,S4,S5 and find
the peak
If peak== S3
Switch off S4 and S5
Switched on TGS-6810 (s3),
MQ7(s4) and TGS-825 (s5)
START
TGS 2600 switched OFF
Continue with MQ2
Wait for all sensors to settle down
Display Gas Concentration
Gas concentration
> T2? MQ2
switched Off
If peak== S5
Switch off S3 and S4 If peak== S4
Switch off S3 and S5
Gas concentration
> T2? Switched off TGS-6810,
MQ7,MQ2 and TGS-825
Yes
No
Yes No
[image:3.612.31.305.73.658.2]concentration increment or decrement slope will differ time to time so it may happen that Ts is not complete but gas
concentration already entered the detection range of sensor 2, in
[image:4.612.327.576.94.221.2]
Fig 5: Functionality of the Smart sensor switching
Such case results in interrupt sensing which is not acceptable. Fig. 5 shows the slope rate and triggering point for three different gas samples, to achieve uninterrupted sensing the sensor 2 triggering point varies depending on gas concentration slope rate. Slope 1 reaches threshold level 1 (t1=90ppm) in 601 sec and 100 ppm at 668, so if sensor 2 triggers at 601 sec it will complete its Ts by t1+Ts=(601+60)=661 sec, where as practically gas concentration will reach 100 ppm at 668th sec, so in this case the sensoe2 will be ready in 7 sec advance. Slope 2 reaches threshold level 1 (t1=90ppm) in 301 sec and 100 ppm at 335, so if sensor2 triggers at 301 sec it will complete its Ts by
t1+Ts=(301+60)=361 sec, where as practically gas concentration will reach 100 ppm at 335th sec, so in this case the sensor2 will be ready in 26 sec delay, which results in 26 sec of interrupted sensing. In same way for slope3 sensor 2 will be ready n 40 sec delay, which results in 40 sec of interrupted sensing. Though Ts
is fixed to achieve uninterrupted sensing irrespective of gas concentration slope a dynamic switching time estimation is essential, where switching time for sensor 2 will vary depending on initial slope rate which is discussed in section 3.2.
3.2
Dynamic Switching Time Estimation
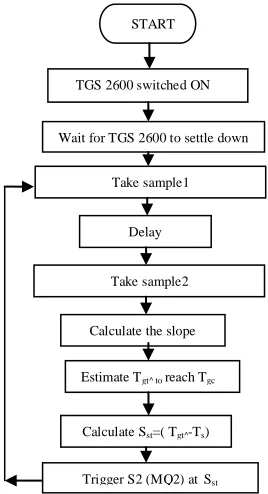
Dynamic switching time estimation is the process of finding sensor triggering time Sst^ by estimating time to reach target gas
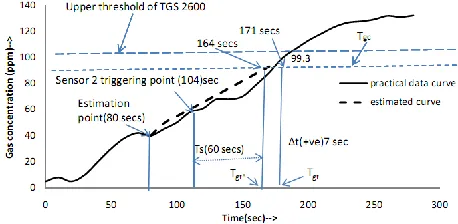
concentration to a level (Tgc)which is Tgt^ . .Fig. 6 shows the
process of finding Sst^ to obtain sensor handover to achieve
uninterrupted sensing irrespective of slope rate of gas. Estimation of sensor triggering time Sst^ is done after every five
seconds which can be alter as per the requirement. In fig. 6 shows Sst^ estimation at 80
th
second, gas concentration reaches Tgc in the time Tgt^ which is 164
th
seconds. To obtain
Fig 6: Dynamic switching time estimation
Uninterrupted sensing Sst^ can be fount by subtracting sensor
settling time Ts fromthe estimated time Tgt^ to reach target gas
concentration Tgc.
Sst^ = Tgt^ - Ts ,
Sst^ = 164 - 60 = 104 sec.
By this estimation process the system dynamically set the sensor triggering time at 104th seconds. The estimation algorithm uses its earlier data from initial to the last sample data obtain for estimating Tgt^. Fig. 7 is the flow chart for dynamic switching
time estimation.
Fig 7: Flow diagram for Dynamic Switching time estimation
START
TGS 2600 switched ON
Wait for TGS 2600 to settle down Take sample1
Calculate the slope Estimate Tgt^ to reach Tgc
Calculate Sst=( Tgt^-Ts)
Take sample2 Delay Delay Take sample1
Delay
[image:4.612.53.288.122.264.2] [image:4.612.378.512.361.608.2]4.
HARDWARE PROTOTYPE DESIGN &
EXPERIMENTAL SETUP
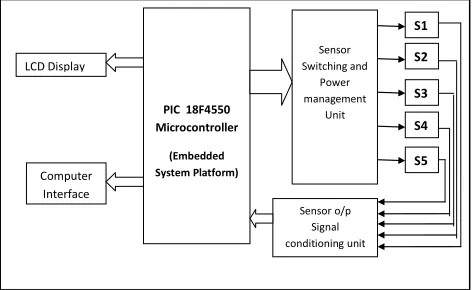
A hardware prototype has been designed to implement the proposed smart sensor switching protocols. All the components of the system have been chosen such a way to restrict the power consumption and cost as low as possible [13,14]. Power consumption is the vital factor for designing an embedded hardware. The internal architecture of the hardware is shown in fig. 8. An 8-bit reduced instruction set computer (RISC) PIC-18F4550 is selected due to its nano watt technology and 8 different types of power management modes, in which ideal mode current down to 5.8uA and sleep mode current down to 0.1uA. These make PIC-18F4550 optimum for this application. After initial signal conditioning, all the sensor signals are digitized by 10-bit internal ADC of the microcontroller. Sensor switching is done by low power metal oxide semiconductor field effect transistor (MOSFET) based switching circuit driven by the microcontroller signal. A 2X16 liquid crystal display (LCD) is used to display the gas concentration and sensor information. The hardware communicates with PC by a RS232 interface to make the database of the sensed data for further statistical analysis.
Fig. 8 Internal hardware architecture
A hardware prototype consists of five different gas sensors. S1-TGS2600 and S2-MQ2 is collaboratively performing sensor switching tasks. These two sensors are sensitive to several gases whereas S3-TGS6810, S4-MQ7 and S5-TGS 825 are sensitive to specific gases. The hardware is powered by 6 volt 1.5 Ah lithium-ion battery. A practical hardware is shown in fig. 9. Extensive experiments have been performed in a closed glass chamber by keeping environment temperature 20-25 degree centigrade. Isobutene is used as sample gas. Experiments are carried out for 1150 seconds. During this period gas Concentration has been altered periodically to validate the efficiency of proposed protocol. Sensed data have been sampled at a rate of 10sample per second.
Fig. 9 Developed hardware prototype
5.
RESULTS AND DISCUSSION
[image:5.612.310.568.96.258.2]The variation of gas concentration in the gas sensor sensed by the sensors and processed and stored by the hardware plat form is shown in fig. 10. In which first three thousand samples (300 sec) data have been used for simulation to execute dynamic switching time estimation algorithm. The simulation results are shown in fig. 11 to fig. 14.
Fig. 10 Gas concentration variation inside gas chamber
In simulation we estimated the future slope by using previous data samples and finally compared between estimation and practical data curve and find out the deviation to get the efficiency of estimation algorithm. From the data base we take out first 300seconds samples and estimated the future data slop by taking three different estimation point 70sec, 80sec, 90sec respectively. The simulation plot and there deviation and sensor triggering point for different estimation point are shown in fig. 11 to fig. 13 respectively.
PIC 18F4550 Microcontroller
(Embedded System Platform)
LCD Display S2
S3
S4
S5
Sensor o/p Signal conditioning unit
Sensor Switching and
Power management
Unit
S1
[image:5.612.42.279.373.518.2] [image:5.612.324.559.378.519.2]Fig. 11 switching time estimation at 70 seconds
Fig. 11 shows the switching time estimation at 70 seconds that means first 70 seconds data are used for estimation. From simulation result it is clear that the deviation between estimation and practical value is +20 seconds, so by estimating at 70 seconds the sensor 2 will be ready 20seconds advance that of practical value which results in sensor handover with uninterrupted sensing. In same way fig. 12 shows the estimation
Fig. 12 switching time estimation at 80 seconds
at 80 seconds. From simulation result it is clear that the deviation between estimation and practical value is +7 seconds, so by estimating at 80 seconds the sensor 2 will be ready 20seconds advance that of practical value which again results in sensor handover with uninterrupted sensing. And finally fig. 13
. Fig. 13 switching time estimation at 90 seconds
shows switching time estimation at 90 seconds. Simulation result shows deviation is +1 seconds, so by estimating at 90 seconds the sensor 2 will be ready 20seconds advance that of practical value which results in sensor handover with uninterrupted sensing. From these three simulation factors we got 100% +ve sensor triggering time estimation which perform sensor handover in a very efficient way. Fig. 14 shows the deviation value between practical and estimation curve at various estimation points starting from 30 seconds to 90 seconds. From the result it is clear that the estimation algorithm shows low accuracy in initial estimation point and it improves estimation accuracy at later estimation point. So to get higher accuracy more data samples should be considered.
Fig. 14 deviation factors at various estimation point
6.
CONCLUSION
This paper presents design and implementation energy efficient smart sensor switching protocols developed by the authors, which is able to achieve the initial goal of any time any concentration sensing by the best sensor. The protocols have been successfully deployed and validated in the hardware; all the estimation and switching algorithms have given 100% positive estimation. We are currently working on an improved version of smart sensor switching where we are finding the use of artificial intelligence in the estimation algorithms.
7.
ACKNOWLEDGMENT
This work has been carried out in the Electronics and Communication department, North Eastern Hill University (NEHU), and supported by Sikkim Manipal Institute of Technology (SMIT). Authors wish to thank both the Universities for providing all laboratory and equipment support for the research work.
8.
REFERENCES
[1] U.S. Environmental Protection Agency. Air Pollution Monitoring. Available online: http://www.epa. gov/oar/oaqps/ montring.html (accessed on September 28, 2009).. .
[2] Synergist Buyer's Guide. Indoor Air Quality. Available online: http://www.aiha.org/thesynergist/html/bg/iaq.htm (accessed on September 28, 2009).
[image:6.612.58.287.334.446.2][4] Dipanjan bhattacharjee,Sushaban choudhury, Ajay kumar ”Wireless intelligent smart sensor node for hazardous gas monitoring” international journal of Computer Science and Information Technology (IJCSIT), Vol 3, No 1, Pp. 53-57. june 2010.
[5] Dipanjan Bhattacharjee, Sushabhan Choudhary,“ Implementation of Self Diagnostic and Power Management Protocols on Wireless Gas Sensor Nodes”, International Journal of Engineering Science and Technology (IJEST), Vol2, No.4, April 2011, pp 2582-2589.
[6] Dipanjan Bhattacharjee, Sourabh Kumar, Akash Kumar, Sushabhan Choudhary, “Design and Development of Wireless Sensor Node”, (IJCSE) International Journal on Computer Science and Engineering Vol. 02, No. 07, 2010, 2431-2438.
[7] Murty, R.N.; Mainland, G.; Rose, I.; Choudhury, A.R.; Gosain, A.; Bers, J.; Welsh, M. CitySense: An Urban-Scale Wireless Sensor
[8] Sukwon Choi, Nakyoung Kim, Hojung Cha, Rhan Ha, “Micro Sensor Node Air pollutant Monitoring: Hardware and Software Issues” Sensors 2009,mdpi, 7970-7987.IEEE Computer Society: Waltham, MA, USA, 2008.
[9] Dipanjan bhattacharjee, Purva Bhatnagar, Sushabhan choudhury. “ design and Development od a Flexible Reliable Smart Gas Detection System” International Journal of Computer Applications (0975 – 8887) Volume 31- No.9,october 2011,
[10]C. Giraud and B.Jouvencel, “Sensorselection: Ageometricalapproach,”inProc.IEEE/RSJInt.Conf.Intell.Ro botsSyst., 1995,vol. 2,pp.45–49.
[11]Jer Hayes, Stephen Beirne, King-Tong Lau, Diamond “Evaluation of a low cost Wireless Chemical Sensor Network for Environmental Monitoring” International Conference IEEE SENSORS 2008 .
[12]www.figarosensor.com/sensor/technical information.
[13]E.BiagioniandK.Bridges,“Theapplication of remote sensor technology to assist the recovery of rare and endangered species,” Int.J.HighPerform.Computing Applic. ,vol. 16, no.3, pp.315–324,2002.