Applying Data Mining Technique for the Optimal Usage
of Neonatal Incubator
Hagar Fady S.
Dept. Of Computer Science & Eng.,
Faculty of Electronic Engineering
Menoufiya University, Egypt
Taha EL-Sayed T.
Dept. Of Electronic & ElectricalCommunication, Faculty of Electronic
Engineering
Menoufiya University, Egypt
Mervat Mahmoud M.
Dept. Of Computer Science &Eng., Faculty of Electronic
Engineering
Menoufiya University, Egypt
ABSTRACT
This research aims to provide intelligent tool to predict incubator Length of Stay (LOS) of infants which shall increase the utilization and management of infant incubators. The data sets of Egyptian Neonatal Network (EGNN) were employed and Oracle Data Miner (ODM) tool was used for the analysis and prediction of data. The obtained results indicated that data mining technique is an appropriate and sufficiently sensitive method to predict required LOS of premature and ill infant.
General Terms
Data mining, Infant Incubator, Length of Stay
Keywords
: Length of Stay, Data Mining, Regression, Incubator, Premature.1.
INTRODUCTION
Data Mining is the analysis of observational datasets to find unsuspected relationships and summarize data in novel ways that are both understandable and useful to the data owner. Data mining also can discover valuable and hidden knowledge from databases [1]. In healthcare, data mining is becoming increasingly popular, if not increasingly essential [2]. The healthcare environment is still ''information rich'' but ''knowledge poor''. There is a wealth of data available within the healthcare systems. However, there is a lack of effective analysis tools to discover hidden relationships and trends in data [3].
According to World Health Organisation (WHO) 30 August 2011 | Geneva, newborn deaths, that is deaths in the first four weeks of life (neonatal period), today account for 41% of all child deaths before the age of five. The first week of life is the riskiest week for newborns, and yet many countries are only just beginning postnatal care programmes to reach mothers and babies at this critical time. Almost 99% of newborn deaths occur in the developing world. With a reduction of 1% per year, Africa has seen the slowest progress of any region in the world.
Existing interventions can prevent two-thirds or more of these deaths if they reach those in need [4].
A neonatal intensive care unit, usually shortened NICU (pronounced "Nickyoo"), is a unit of a hospital specialising in the care of ill or premature newborn infants. Infants are cared for in incubators or "open warmers" [5]. Critical care providers are faced with resource shortages including beds to hold admitted patients. This resource constraint is particularly important in specialized areas of the hospital, such as
intensive care units (ICU) or step down units. An early and accurate prognosis of LOS may have organizational, economic, and medical implications. At times of reduced health care budgets, optimal resource planning, e.g. staff scheduling and early discharge policy, is vital [6]. Evaluating LOS information is a challenging task , but is essential for the operational success of a hospital. Intensive care resources in particular are often limited and pose scheduling problems for hospital staff and administrators. Predicting LOS is difficult and often only done retrospectively [2]. The main contributions of this paper are using data mining technique with different algorithms to estimate incubator's LOS. The propose algorithms are compared with the algorithms proposed by Hintz et al [7].
This paper is organized as follows. Section 2, reviews related work in LOS prediction. Section 3 demonstrates process, algorithms and structure of module used in LOS prediction. Section 4, describes the research results. Section 5, gives a performance study of the proposed algorithms compared with previous research algorithm presented by Hintz et al [7]. The conclusion of the paper is introduced in section 6.
2. RELATED WORK
Few literatures are addressing LOS prediction in the high-risk patient population of extremely preterm infants. These studies have focused on the effects of specific morbidities on LOS or explored variables that were associated with a pre-specified LOS [7]. Ref. [6], predicted LOS for preterm neonates using multiple linear regression model (MR) and an artificial neural network (ANN) based on few prenatal, perinatal and neonatal factors. Ref. [8], used data mining to predict length of stay in a geriatric hospital department. They applied one of the two classifiers: decision tree C4.5 and its successor R-C4.5s, Naïve Bayesian classifier (NBC) and its successor NBCs. Besides, Naive Bayesian imputation (NBI) model is used for handling missing data. In 2009, linear and logistic regression models with time dependent covariate inclusion were developed by Hintz et al [7]. These models were designed to predict LOS as continuous and categorical variable for infants <27 weeks estimated gestational age.
3. A SUGGESTED DATA MINING
PROCESS FOR DETERMINING LOS
Fig. 1 CRISP-DM Process
3.1 Business and Data Understanding
3.1.1 Procedures and Forms of EGNN:
EGNN is a not-for-profit organization whose mission is to improve the efficacy and efficiency of neonatal care in Egypt through a co-ordinate program of research, education, and quality improvement [10].
3.1.2 Previous research
It was found that previous researches developed LOS prediction models based on few risk factors. Those studies used statistical techniques such as multiple linear regression, logistic regression and neural network in LOS prediction model. Although different methods were used, no previous report studied or relied on the cases occurred in Egypt and available with EGNN.
From previous survey it is clearly that research goal is to predict LOS in Egyptian environment via creating high accuracy predictive data mining models.
3.2 Data Preparation
Data preparation includes 3 preprocessing steps (data selection, data cleaning and data transformation) applied to the data to help improve the accuracy, efficiency, and scalability of the classification or prediction process.
3.2.1 Data Selection
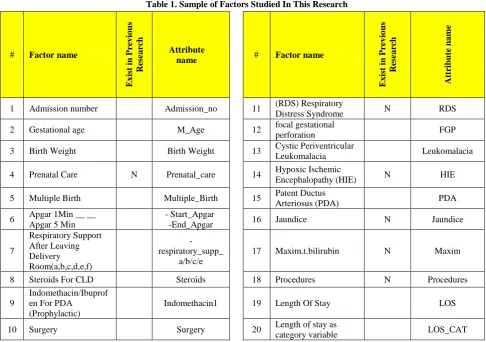
The study was done on 443 infants admitted to neonatal care unit .Tanta University Hospital from December 2010 and December 2011. Dead infants and Cases transferred to other hospitals before being discharged home were excluded. Infant's age ranged from 16 to 47 weeks and body weight ranged from 700 g to 5000 g. Data were organized and stored in electronic format. Each studied factor was identified based on EGNN manual and prenatal specialists consulted as shown in [11] , [12]. Table 1 shows sample of those factors. Factors that were not included in previous research, Hintz et al [7], are marked with “N” in the column “Exist in Previous Research”
of table 1 below.
Table 1. Sample of Factors Studied In This Research
# Factor name
Ex
ist
in
Pre
v
io
u
s
Re
se
a
rc
h
Attribute
name # Factor name
Ex
ist
in
Pre
v
io
u
s
Re
se
a
rc
h
Attr
ib
u
te
n
a
m
e
1 Admission number Admission_no 11 (RDS) Respiratory
Distress Syndrome N RDS
2 Gestational age M_Age 12 focal gestational
perforation FGP
3 Birth Weight Birth Weight 13 Cystic Periventricular
Leukomalacia Leukomalacia
4 Prenatal Care N Prenatal_care 14 Hypoxic Ischemic
Encephalopathy (HIE) N HIE
5 Multiple Birth Multiple_Birth 15 Patent Ductus
Arteriosus (PDA) PDA
6 Apgar 1Min __ __
Apgar 5 Min
- Start_Apgar
-End_Apgar 16 Jaundice N Jaundice
7
Respiratory Support After Leaving Delivery Room(a,b,c,d,e,f)
-respiratory_supp_
a/b/c/e
17 Maxim.t.bilirubin N Maxim
8 Steroids For CLD Steroids 18 Procedures N Procedures
9
Indomethacin/Ibuprof en For PDA
(Prophylactic)
Indomethacin1 19 Length Of Stay LOS
10 Surgery Surgery 20 Length of stay as
[image:2.595.49.536.417.759.2]3.2.2 Data Cleaning
In order to perform LOS prediction using ODM, the risk factors was represented in oracle database as attributes for the master table named TEST13_12 with (admission_no) primary key. It is found that collected data from the hospital tends to be incomplete, noisy and inconsistent. In this step, we fill on missing values, smooth out noise while identifying outliers, and correct inconsistencies in the data. Historical Data collected from EGNN forms were loaded into TEST13_12 table as data set using SQL developer release 3.
3. 2.3 Data Transformation
The study sample was randomly split into a development sample (211 patients [70%]),
and a validation sample (90 patients [30%]), data were discretized (that is, binned); numerical data binned into ranges of values(Quantile binning strategy), and categorical data divided into one bin for each of the values with highest distribution (TopN strategy) and the rest recoded into a bin named “Other”.
3.3 Module Development (modeling)
3.3.1 Technique selection
Data mining was selected for this research because of the following:
I – It is not commonly used in LOS prediction, so this research might reach new results.
II – Its ability to handle huge amounts of data.
III – Different mining algorithms can be tried and analyzed.
3.3.2 Tool Selection
The following tools are used in this research:
I – Oracle Data Miner version 11.1.0.4, for the mining activity, that act as a client and 11g database release 11.1.0.6.0 as a server.
II – Oracle SQL developer. III – MS Excel.
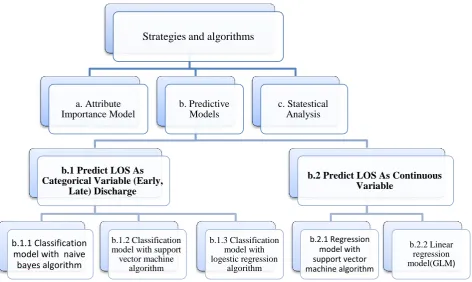
[image:3.595.65.538.334.616.2]3. 3.3 Defining Strategies and Algorithms
The following flow chart (Fig. 2) shows the work strategies and algorithms:Fig. 2 Working Strategies and Algorithms
a. Attribute Importance Model
Oracle Data Mining provides a feature called Attribute Importance (AI) that uses the algorithm Minimum Description Length (MDL) to rank the attributes by significance in determining the target value. Attribute Importance can be used to reduce the size of a Classification problem, giving the user the knowledge needed to eliminate some attributes, thus increasing speed and accuracy [13].
b. Predictive Model
b.1 Predict LOS as Categorical Variable (early,
late) Discharge
Three predictive models were constructed using classification method with Naive Bayes , SVM and logistic regression algorithms. Prenatal specialists consulted advised that if LOS is less than 30 day, it is classified as early discharge, otherwise it is late discharge. More details are below.
Strategies and algorithms
a. Attribute Importance Model
b. Predictive Models
b.2 Predict LOS As Continuous Variable
b.2.1 Regression model with support vector machine algorithm
b.2.2 Linear regression model(GLM)
b.1 Predict LOS As Categorical Variable (Early,
Late) Discharge
b.1.1 Classification model with naive
bayes algorithm
b.1.2 Classification model with support vector machine
algorithm
b.1.3 Classification model with logestic regression
algorithm
b.1.1 Classifications Model with Naïve Bayes
Algorithm
Naïve Bayes looked at the historical data and calculated conditional probabilities for the target values by observing the frequency of attribute values and of combinations of attribute values [13].
The Bayes theorem states that
( ) ( ) ( ) (1) Where B represents target class (early, late) and A represents attribute value.
The algorithm must count the number of cases where A and B occur together as a percentage of all cases (“pairwise” occurrences), and divide that by the number of cases where A occurs as a percentage of all cases (“singleton” occurrences). If these percentages are very small, they probably won’t contribute to the effectiveness of the model [12].
b.1.2 Classifications Model with Support Vector
Machine
Algorithm
Oracle Data Mining supports two kernels, Linear and Gaussian. Data records with N attributes can be thought of as points in N-dimensional space, and SVM attempts to separate the points into subsets with homogeneous target values; points are separated by hyperplanes in the linear case, and in the non-linear case (Gaussian) by non-linear separators. SVM finds the vectors that define the separators giving the widest separation of classes (the “support vectors”) [13]. SVMs belong to the general category of kernel methods. A kernel method is an algorithm that depends on the data only through dot-products. When this is the case, the dot product can be replaced by a kernel function which computes a dot product in some possibly high dimensional feature space [31]. The naive way of making a non-linear classifier out of a linear classifier is to map our data from the input space X to a feature space F using a non-linear function ϕ : X → F In the space F the discriminant function is:
( ) ( ) (2)
Suppose the weight vector can be expressed as a linear combination of the training examples, i.e.
∑ (3)
Then: ( ) ∑ (4) In the feature space, F this expression takes the form: ( ) ∑ ( ) ( )
(5)
The kernel function k(x, x0) defined as
( ) ( ) ( ) (6)
In terms of the kernel function the discriminant function is
( ) ∑ ( ) (7)
The widely used kernel is the Gaussian kernel defined by:
( ) ( ‖ ‖ ) (8)
Where ɣ is a parameter that controls the width of Gaussian [14]. In build activity, the kernel function was selected to be system determined, which allows the algorithm to select automatically the appropriate version of SVM to use. The active learning option was enabled.
It is a methodology, internally implemented, that optimizes the selection of a subset of the support vectors which will maintain accuracy while enhancing the speed of the model [13].
b.1.3 Classifications Model with Logistic
Regression Algorithm/(GLM)
Generalized linear models (GLM) represent the theoretical foundation on which linear regression can be applied to the modeling of categorical response variables. Common types of generalized linear models include logistic regression and Poisson regression. Logistic regression models the probability of some event occurring as a linear function of a set of predictor variables [14]. This model was developed for the validation of our result. it was used by the previous research [7]. The reference target class was 'early' class.
b.2 Predict LOS as Continuous Variable)
the Number Of Days Spent At Incubator)
2 predictive models were constructed using regression method with support vector machine and linear regression algorithm to predict the target variable (LOS).b.2.1 Regression Model with Support Vector
Machine Algorithm
SVM solves regression problems by defining an N-dimensional “tube” around the data points, determining the vectors giving the widest separation [13].As the SVM setting in classification model, the kernel function was selected to be system determined, active learning was also enabled.
b.2.2 Linear Regression Model/(GLM)
Regression analysis seeks to determine the values of parameters for a function that cause the function to best fit a set of data observations that you provide. The following equation expresses these relationships in symbols. It shows that regression is the process of estimating the value of a continuous target (y) as a function (F) of one or more predictors (x1, x2 , ..., xn), a set of parameters (θ1 , θ2 , ..., θn),
and a measure of error (e) [15].
( ) (9)
The term multivariate linear regression refers to linear regression with two or more predictors (x1, x2, …, xn). When
multiple predictors are used, the regression line cannot be visualized in two-dimensional space. However, the line can be computed simply by expanding the equation for single-predictor linear regression to include the parameters for each of the predictors [15].
(10) This algorithm was used to validate our algorithms by comparing prediction capabilities for all.Confidence level was selected to be 0.95.
c. Statistical Analyses
4. RESEARCH RESULTS
4.1
Sample Summary
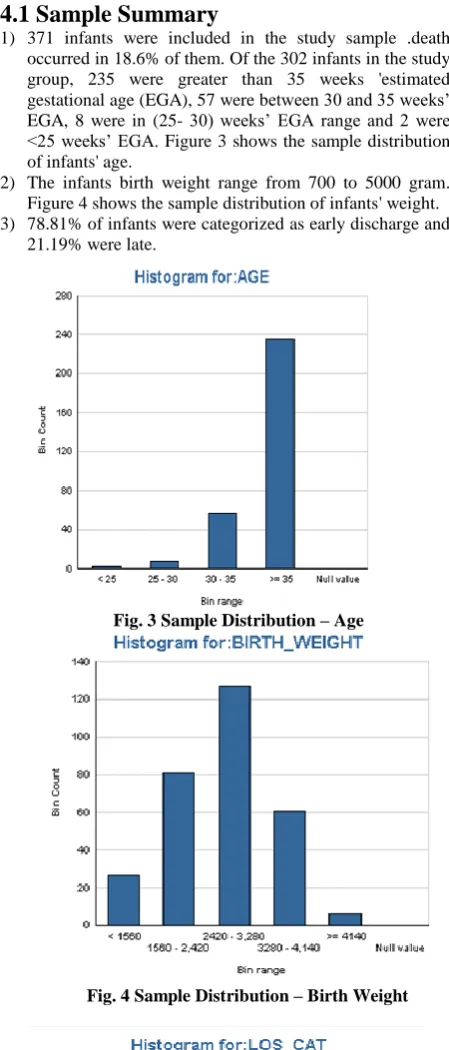
1) 371 infants were included in the study sample .death occurred in 18.6% of them. Of the 302 infants in the study group, 235 were greater than 35 weeks 'estimated gestational age (EGA), 57 were between 30 and 35 weeks’ EGA, 8 were in (25- 30) weeks’ EGA range and 2 were <25 weeks’ EGA. Figure 3 shows the sample distribution of infants' age.
2) The infants birth weight range from 700 to 5000 gram. Figure 4 shows the sample distribution of infants' weight. 3) 78.81% of infants were categorized as early discharge and
21.19% were late.
[image:5.595.54.279.86.612.2]Fig. 3 Sample Distribution – Age
[image:5.595.310.538.211.356.2]Fig. 4 Sample Distribution – Birth Weight
Fig. 5 Sample Distribution – LOS – Category
4.2 Characterizing Incubator LOS
Table 2 characterizes LOS in days and as categorical variable (early, late) according to gestational age groups. For infants less than 25 weeks’ EGA, the observed average LOS was 18 day,100% of them were early discharge ; for infants at 25 to 30 weeks’ EGA, average(LOS) was 20 day , 75% were early and 25% were late; for infants at 30 to 35, average (LOS) was about 25.5 day,70% were early and 30 % were late; for infants greater than or equal to 35, it was about 17.9 day,81% were early ,19 were late discharge.
Table 2. LOS in days according to EGA group, LOS category (early, late) according to EGA group
Ag
e
g
ro
u
p
we
ek
EG
A
LO
S
Av
er
a
g
e
Ea
rly
n
(%
in
EG
A
G
ro
u
p
)
La
te
n
(%
in
EG
A
G
ro
u
p
)
25 18.0 2(100) 0(0)
25 – 30 20.0 6(75) 2(25)
30 – 35 25.5 40(70) 17(30)
>35 17.9 190(81) 45(19)
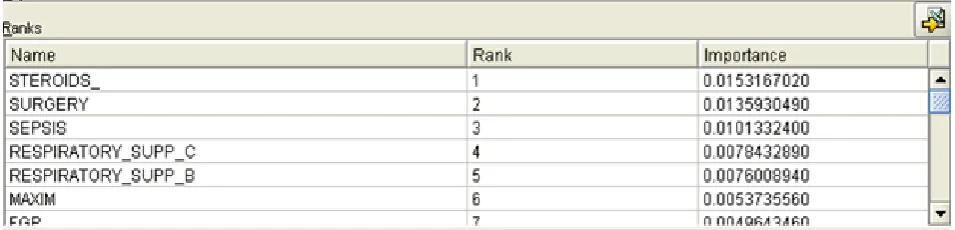
4.3 Attribute Importance Model Result:
It ranked the risk factors by significance in determining the target variable (LOS_CAT) as shown in fig 6. As a result, some attributes were eliminated as they added noise or had no frequency in development sample i.e. Indomethacin , Leukomalacia, Hemorrhage . Steroids, surgery, sepsis, Respiratory Support After Leaving Delivery Room(c,b), Maxim.t.bilirubin(jaundice degree) had higher significance than other factors .Other factors are still taken into consideration but with less importance. Statistical correlation was carried out to study the relation between LOS and other factors.
4.4 Predicting LOS as Categorical Variable
(Early Or Late)
4.4.1
Classification Model with Naïve
Bayes Algorithm
The model’s build activity result (development sample), shows the probabilities for predicting early discharge for a given attribute value. Steroids with value 0 take the highest probability of being early discharge. Down _syndrome, FGP, PDA and other attributes -with values 0, indicates the absence of them, show high probability for infant of being early discharge for.
4.4.2 Classification model with Support Vector Machine algorithm
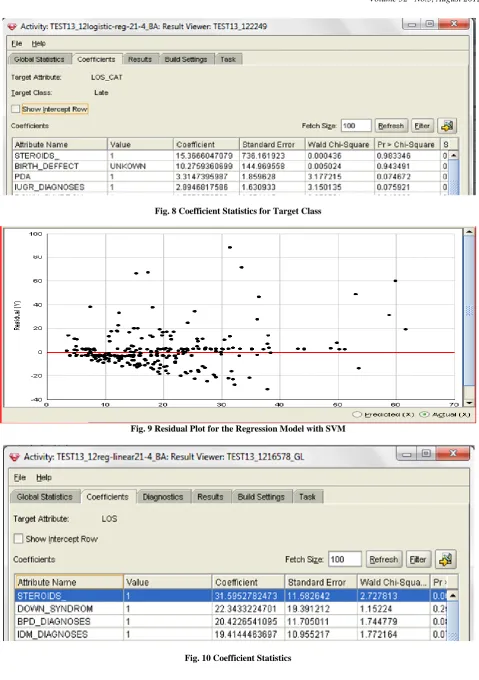
[image:5.595.70.268.603.753.2]4.4.3 Classification model with logistic regression algorithm Figure 8 shows the coefficient statistics for the target class (late).The coefficients were sorted in descending order .some attributes, like( steroids , PDA, sepsis, surgery ,down_syndrom) with value 1 and prenatal_care with value 0, had a large coefficient values in a logistic regression model which imply that they were extremely effective in predicting late discharge.
4.5 Predicting LOS as Continuous Variable
4.5.1 Regression Model with Support Vector
Machine Algorithm
Model build activity result
The setting for build activity was “system determined” regarding Kernel function. The system chose Gaussian function with standard deviation: 2.751, complexity factor: 0.51412, tolerance: 0.001 and epsilon: 0.024
Residual plot
Fig. 9 gives information about the residuals, that is, an indication of the difference between the actual value (in the Test dataset) and the predicted value. Clearly, for all LOS, majority of predictions exist around the zero error, however, cases with considerable error exist in different
4.5.2 Regression Model with Linear Regression Algorithm Coefficient statistics
Fig 10 shows the coefficient statistics for the target class (LOS). some attributes, like( Steroids, Down _Syndrome, BPD_Diagnoses, IDM_Diagnoses, Prematurity, Surgery) with value 1, had a large coefficient values in a regression model which imply that they were extremely effective in predicting LOS.
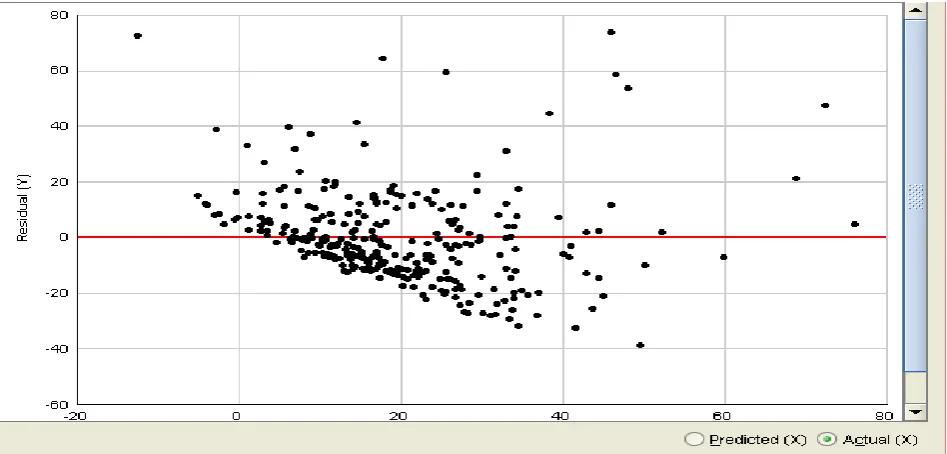
Residual plot
[image:6.595.60.538.327.442.2]Fig 11 shows the residual plot for the regression model with linear regression algorithm.
Fig. 6 Ranking Risk Factors by Significance
Fig. 8 Coefficient Statistics for Target Class
[image:7.595.59.539.54.735.2]Fig. 9 Residual Plot for the Regression Model with SVM
Fig. 11 Residual Plot for the Regression Model with Linear Regression
[image:8.595.53.281.362.671.2]4.6 Statistical Correlation Results
Table 4 below shows statistical correlation results.Table 4. Statistical Correlation Results
risk factor Pearson
Correlation P
Age - (0.095) 0.098133173
Birth Weight -.153** <0.01
FGP 0.076 0.186937449
head_circum (0.019) 0.743911909
IDM 0.054 0.346665449
IUGR 0.023 0.690037744
Length (0.062) 0.279313541
M_AGE 0.009 0.882436527
Maxim .231** <0.01
PREMATURITY .183** <0.01
RDS .188** <0.01
Respiratory
_supp_a .113* 0.0496673
Respiratory
_supp_b .277** <0.01
Respiratory
_supp_c .298** <0.01
Steroids .227** <0.01
Surgery .189** <0.01
**. Correlation is significant at the 0.01 level (2-tailed). *. Correlation is significant at the 0.05 level (2-tailed).
Although attribute importance model had neglected some risk factors in its ranking, the statistical analysis showed strong correlation between LOS and these factors. Birth weight, prematurity, maxim (jaundice degree), surgery, and steroids were strongly correlated with LOS. RDS, prematurity, maxim, surgery were positively associated with LOS, while birth weight, gestational age were inversely associated with LOS.
5. MODULE EVALUATION
This work makes performance evaluation based on several criteria as shown in table 5, 6. Predictive confidence is a visual indication of the effectiveness of the model compared to a guess based on the distribution of target values in the build dataset [13]. If the model has a predictive confidence of 65.64% that means it is 65.64% better than naïve model. The comparative tables (5,6) of predictive capabilities in case of algorithms used in our study and previous research’s algorithm presented by Hintz et al [7]. shows that:
1-
In LOS prediction models as categorical variableIn models that used naïve bayes and support vector machine classification algorithms, there was little difference in predictive confidence, overall accuracy and (Area Under Curve) AUC. However, total cost was less in SVM algorithm. On other hand, the logistic regression algorithm presented poor capabilities compared with our algorithms.
2-
in LOS prediction models as continuous variableThe SVM regression algorithm presented higher capability than linear regression algorithm by means of lower error and higher predictive confidence. SVM are becoming increasingly popular in medicine [16]. It can emulate some traditional methods, such as linear regression and neural nets, but goes far beyond those methods in flexibility, scalability, and speed [13].
It was noticed that for algorithms used both in this research and previous researches, mentioned in related works sections, performance indicators were better in this research which deploys data mining techniques. This could be explained by [17]"Traditional statistical methods, in general, require a great deal of user interaction in order to validate the correctness of a model. As a result, statistical methods can be difficult to automate. Moreover, statistical methods typically do not scale well to very large data sets. Data mining methods are suitable for large data sets and can be more readily automated ".
Table 5. Module – Performance Indicator Comparison For Categorical Variable
Performance indicator support vector machine algorithm naïve bayes algorithm logistic regression algorithm* Predictive confidence
65.76% 65.64% 24.41%
Average accuracy 0.828 0.828 0.622 Overall accuracy 0.874 0.868 0.791
Total cost 38 103.77 63
Area under ROC curve
0.894 0.907 0.791
*This algorithm was used by Hintz et al [7].
Table 6. Module – Performance Indicator Comparison for Continuous Variable Performance Indicator support vector machine Linear regression*
Predictive confidence 27.12% 12.99%
Mean absolute error 8.09 12
Root Mean Square Error 13.94 16.64 *This algorithm was used by Hintz et al [7].
6. CONCLUSION
This research is based on data collected from Egyptian hospitals using EGGN forms. The majority of factors listed in EGNN forms are common with factors studied in previous research worldwide. However, some factors are reflecting the Egyptian environment; i.e. jaundice and maxim.t.bilirubin which were found to be highly impacting the LOS.
In order to verify the obtained results, the simulation results are compared with the published data and give a good agreement with more comprehensive results as the module is trained by all cases went to the incubator. The obtained results are expected to be useful for determining the LOS especially in the Egyptian environment. In this paper the problem of inaccurate prognoses of infant LOS, which led to misuse of incubators, are discussed. The focus is on using different algorithms for intelligent and effective LOS prediction using data mining. For predicting LOS, the risk factors are listed and different data mining techniques were used.
The outcome of predictive data mining technique on the same dataset reveals that support vector machine appears to be most effective in categorical los prediction as it has the lowest cost,
highest percentage of predictive confidence and accuracy, followed by naïve bayes (with a difference of less than 1% in predictive confidence) and logistic regression.
It also appears to be most effective for predicting LOS as continuous variable compared to the linear regression model. Other methods like logistic regression and linear regression are not performing well. The results showed that, our data mining algorithm has realized a better prediction confidence and accuracy than the traditional statistical algorithms. The decision making for the length of stay has been improved and made more accurate. This provides the optimal and best incubator usage for the specific infant case
ACKNOWLEDGMENTS
Hager Fady thanks Dr.Eng.Ahmed Marzook for his guidance in Oracle programming. Also, Hager Fady thanks Dr.Asmaa Fady Sherief, assistant lecturer in forensic medicine and clinical toxicology department, Faculty of Medicine - Tanta university, for her help and cooperation in data collection
.
REFERENCES
[1] A. Almazyad, M. Ahamad and M. Siddiqui, "Effective Hypertensive Treatment Using Data Mining In Saudi Arabia," J. CLIN. MONITOR. COMP., vol. 24, no. 2, 2010.
[2] H. Koh and G. Tan, "Data Mining Applications In Healthcare," J. Health. Info. Man, vol. 19, no. 2, pp. 64-72, 2005.
[3] J. Soni, U. Ansari, D. Sharma and S. Soni, "Predictive Data Mining for Medical Diagnosis:An Overview of Heart Disease Prediction," J. Comp. Appl., vol. 17, no. 8, Mar 2011.
[4] WHO, "Newborn deaths decrease but account for higher share of global child deaths," 2011. [Online]. Available: http://www.who.int/mediacentre/news/releases/2011/ne wborn_deaths_20110830/en/index.html.
[5] J. Sandham, "Baby Incubation," 2008. [Online]. Available: http://www.ebme.co.uk.
[6] B. Zerinkow and K. Holtmannspötter, "Predicting Length-Of-Stay In Preterm Neonates," European Journal of Pediatrics, vol. 158, no. 1, 1999.
[7] S. Hintz, C. Bann, N. Ambalavanan, M. Cotten, A. Das and R. Higgins, "Predicting Time to Hospital Discharge for Extremely Preterm Infants," Journal of the American Academy of Pediatrics, vol. 125, pp. 146-154, 2010. [8] P. Liu, L. Lei, J. Yin, W. Zhang, W. Naijun and E.
El-Darzi, "Healthcare Data Mining: Prediction Inpatient Length of Stay," in 3rd International IEEE Conference on Intelligent Systems, Aveiro, 2006.
[9] G. Kraljevic and S. Gotovac, "Modeling Data Mining Applications for Prediction of Prepaid Churn in Telecommunication Services," Automatika, vol. 51, no. 3, pp. 275-283, 2010.
[11] EGNN, "28 Day/Discharge Form," EGNN, Cairo, 2010. [12] EGNN, "Dataset Manual," EGNN, Cairo, 2010. [13] R. Haberstroh, Oracle® Data Mining Tutorial for Oracle
Data Mining 11g Release 1, Oracle, 2008.
[14] A. Ben-Hur and J. Weston, A User's Guide to Support Vector Machines.
[15] Oracle, "Introducing Oracle Data Mining, Oracle Data Mining Concepts 11g Release 1 (11.1)," [Online]. Available:
http://docs.oracle.com/cd/B28359_01/datamine.111/b28 129/intro_concepts.htm.
[16] M. Clinic, "Infant jaundice," Mayo Foundation for Medical Education and Research;, 2011. [Online]. Available: http://www.mayoclinic.com/health/infant-jaundice.