© 2018, IRJET | Impact Factor value: 6.171 | ISO 9001:2008 Certified Journal | Page 2689
Fault section estimation in electric power systems using
Teaching-Learning-Based-Optimization algorithm
Reza Vakil Alroayaee
Islamic Azad University, Science and Research Branch, Daneshgah Blvd, Simon Bulivar Blvd, Tehran, Iran
---***---Abstract
- In this paper, an application of Teaching-Learning-Based-Optimization (TLBO) algorithm is presented to improve the fault section estimation performance in power systems. TLBO is an efficient optimization method which is suitable for finding global solutions for large scale non-linear optimization problems. This algorithm is free from the algorithm parameters, i.e., it does not require any parameter tuning to achieve a better performance. Fast convergence, small population size, and good global search capability characterize the performance of the algorithm. Using the proposed approach, faulty sectors can be estimated accurately among voluminous alarms. Moreover, by using the selected algorithm the feasibility of inaccurate diagnosis is reduced. The proposed method is versatile and can deal with uncertainties in fault section estimation such as failure performance of relays and circuit breakers or multiple simultaneous faults. The fault diagnosis can be accomplished in a very short time for large scale power systems by employing the algorithm. In order to validate the effectiveness of TLBO algorithm, the method is applied on simulated and practical power systems and the results are compared to those of other optimization algorithm i.e. Differential Evolution (DE), Artificial Bee Colony (ABC), Conventional Particle Swarm Optimization (CPSO) method, and a modified version of PSO known as Type1 PSO (T1PSO). The results demonstrate the superiority of this method as compared to other methods.Key Words
:
Fault section estimation, Teaching-Learning-Based Optimization.
1. INTRODUCTION
State estimation in power systems is a valuable tool for enhancing reliability and stability of the system [1]. Along the same line, fault section estimation in an electric power system refers to identifying the faulty sections (transmission lines, transformers and buses), and/or distinguishing the misoperation of different apparatuses (circuit breakers and DC source). A fault section can be estimated using the Reported alarms which are obtained from supervisory control and data acquisition (SCADA) systems [2-3]. As the fault section is identified, a fast and highly accurate restoration reaction is needed to minimize the service interruption and limit the damages to the equipment. This can also bring the future power systems known as smart grid; especially future distribution systems or microgrids, an important feature of self-healing; which is Fault Location Isolation, and Service Restoration (FLISR) [4-5]. Therefore, a precise and effective method for diagnosing the power system’s faults plays an important role in supporting the
network restoration for dispatchers [6,7]. Lots of methods have been presented in the literature for solving the foregoing issue including expert systems [8-10], artificial neural networks [11-14], machine learning algorithms [15-17],petri nets [18,19], cause-effect networks [20-22], and Bayesian networks [23]. However, it is difficult to achieve sufficient knowledge using the mentioned methods. Moreover, the procedure of knowledge acquisition and database establishment are burdensome with these methods.
Recently, a branch of optimization methods known as meta-heuristic algorithms, such as genetic algorithms [24]-[27], tabu search [28], immune algorithms [29], ant systems [30], particle swarm optimization [31], artificial bee colony [32,33], and honey-bee mating optimization algorithm [34] have been applied for estimating the faulty sections. These kinds of methods simulate behavior found in nature. Since these methods are population-based, the possibility of becoming stuck at the local optimum points is very low. Furthermore, these methods do not require any specific initial guess and can deal with complex objective functions and constraints.
In this paper, Teaching-Learning-Based Optimization (TLBO) algorithm is used to estimate the faulty sections of a power system. This algorithm simulates the procedure of enhancing the knowledge of students in a classroom. Students improve their grade in two main phases known as the Teacher phase and the Student phase. The teacher is generally regarded as the highest educated person in the class. It is clear that the average of the students’ knowledge is highly affected by the quality of the teacher. In other words, the better educated the teacher is, the higher level the students will achieve. Furthermore, students can also increase their level of education by interacting in groups. In order to evaluate the performance of the proposed method, it was applied on a simulated and a practical power system. The results were then compared to those of several other algorithms including Artificial Bee Colony (ABC), Differential Evolution (DE), Type1 Particle Swarm optimization (T1PSO), and Conventional Particle Swarm Optimization (CPSO). The superiority of the proposed method was demonstrated.
© 2018, IRJET | Impact Factor value: 6.171 | ISO 9001:2008 Certified Journal | Page 2690 2. Fault Diagnose Problem Formulation
The fault section estimation problem is an optimization problem as follows [33].
* * *
2 3 4
1 1 1 1
* * * *
5 6 1
1
(S)
{
}
{ (
)
}
p s
m
c
N N
N N
ij ij ik ik il il
i j k l
N
m m m m m m m m
m
E
MR
MR
PBR
PBR
SBR
SBR
RCR
RCR
ATR
ATR
FR
FR
C
C
(1)
where E(s) is the objective function which must be minimized, and S is an N-dimension binary vector in which Si represents the state of the ith section, where Si = 0 or 1 corresponds to the normal or faulty state, respectively. This vector, i.e. S, is the vector which needs to be determined optimally. All parameters of Eq. (1) are explained in detail in the [33].
3. Teaching Learning Based Optimization Algorithm
Teaching-Learning-Based Optimization (TLBO) algorithm is a population based method introduced by Rao, et al. [35, 36]. The method simulates the procedure of enhancing the grade of students in a class. The teacher and students are vital components of the method. The students increase their level in two main phases known as the teacher phase and the student phase. In the former the teacher tries to increase the level of the class. In the later the students increase their grade by interacting with each other. The method is further explained in this section.
As mentioned before, TLBO algorithm is a population-based algorithm. The population of the students is the solution of the optimization problem. The most knowledgeable student i.e., the best solution in the society (based on the objective function value), is nominated as the teacher. The process of TLBO is divided in two phases which are discussed in the following paragraphs.
3.1. Teacher phase
As mentioned, the best solution is considered as the teacher. The teacher tries to enhance the level of each student within the classroom (for instance M1) to his or her level (i.e., MT). Since this is impossible in practice, the teacher tries, therefore, to increase the mean level of the whole class to a higher level of M2. It is obvious that a higher educated teacher (a solution with better fitness) would have more impact on student’s grade improvement [36]. For a mathematical description of the teacher phase, the difference between the MT and Mmean is first calculated as follows:
_
(
)
diff
mean
i
r M
i
T
T M mean
f
(2)
where ri is a random variable in the range of [0, 1], and Tf is the teacher factor which can be either 1 or 2 and is selected randomly. Based on diff_mean the existing solution is updated as follows:
_
new
old
X
i
X
i
diff
mean
i
(3)
3.2. Student phase
In this phase, the students enhance their grade by interacting with each other. In other words, a student shares his knowledge with another student which is selected randomly from the classroom. The selected student learns new things if the other student is more knowledgeable, otherwise, the initial student teaches the other one. For the mathematical formulation of this phase, assume Xi and Xj are two classroom students where i ≠j. Student's knowledge i.e., f(X) is evaluated using the objective function. A solution with a better f(X) (lower for minimization and higher for maximization problem) means a more knowledgeable student. It is assumed that the problem is minimization. Therefore, if the fitness function of Xi is lower than Xj, it means Xi is a student with a higher level of knowledge in comparison to Xj. Therefore, Xi moves towards his direction. From a mathematical point of view Xi is upgraded using the following equation:
( ) ( ) ( j )
new old old old old old
Xi Xi r Xi i Xj if f Xi f X
(4)
If Xj is more knowledgeable than Xi, it means Xi must move towards Xj'. Thus, Xi is upgraded as follows:
( ) ( ) ( )
new old old old old old
Xi Xi r Xi j Xi if f X j f Xi
(5)
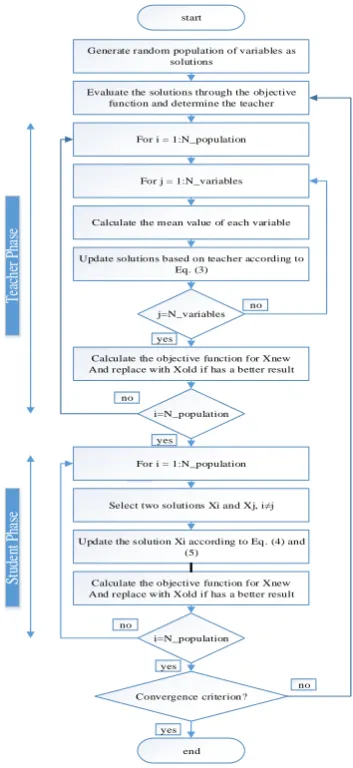
In these equations, Xi is a solution and f(Xi) refers to its fitness value. In each phase, Xnew is replaced with Xold if a better result is achieved. The process is continued until a convergence occurs. The flowchart of TLBO algorithm is shown in Fig. 1.
© 2018, IRJET | Impact Factor value: 6.171 | ISO 9001:2008 Certified Journal | Page 2691 “c1=c2=2.01, w=0.7298”, and linearly decreasing inertia PSO,
“c1=c2=2, w=0.4-0.9”. The tuning of theses coefficients has an impressive impact on the PSO results. In DE algorithm, CR (crossover constant) and F affect the results of the optimization algorithm. In ABC the abandonment limit factor should be selected appropriately for better results.
Generate random population of variables as solutions
Calculate the m ean value of each variable
Update solutions based on teacher according to Eq. (3)
Update the s olution Xi according to Eq . (4) and (5)
Select two solutions Xi and Xj, i≠j
Convergence criterion?
end For i = 1:N_population
For j = 1:N_variables Evaluate the solutions through the objective
function and determine the teacher
Calculate the objective function for Xnew And replace with Xold if has a better result
j=N_variables no
yes
i=N_population
no
For i = 1:N_population
Calculate the objective function for Xnew And replace with Xold if has a better result
i=N_population no
yes
no
yes yes no
Te
ac
he
r P
ha
se
St
ud
en
t P
ha
se
[image:3.595.68.245.160.545.2]start
Fig -1: Flowchart of TLBO algorithm.
In contrast, no specific parameter needed to be tuned in TLBO algorithm. The Tf and ri are the only parameters of TLBO, neither of which needs to be tuned. These parameters are selected randomly and their values do not influence the results of the algorithm. Therefore, it can be said that the TLBO is a parameter-free algorithm [37].
4. Result of Simulations
To evaluate the presented TLBO approach for a fault section estimation problem, several tests were implemented on both a simulated and a real system. The simulations were performed using a PC with Intel Dual Core P6100 2.00 GHz. In all of the tests the results of the proposed approach were compared with the Conventional Particle Swarm Optimization (CPSO) method, Type1 Particle Swarm Optimization (T1PSO) method, Differential Evolution (DE)
approach and Artificial Bee Colony (ABC) algorithm. In order to appraise the solution quality, convergence characteristics, and computational efficiency, a number of 100 independent trials were conducted. For CPSO, T1PSO, and the DE algorithm, a population of 50 members is adequate based on previous research. In order to make a fair comparison, the number of objective function evaluations must be the same for all methods. Since the objective function is evaluated twice in each iteration of the TLBO method (once in the teacher phase and again in the student phase), the population size of TLBO method (i.e., the number of students) has been assumed to be 25. The maximum number of allowed iterations of the ABC approach is set at 350. For the other approaches it has been set as 100.
4.1. Test Results
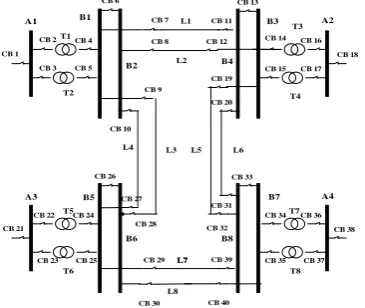
In order to evaluate the efficiency of the proposed method a 28-section system was considered as the test system. The test case, shown in Fig. 2, consists of 28 sections (s1…s28), 40 circuit breakers (c1…c40) and 84 protective relays (r1…r84), of which 36 relays (r1…r36) are considered as the main relays and the other 48 relays (r37…r84) are considered as the backup relays.
s1…s28 = A1…A4, T1…T8, B1…B8, L1…L8,
c1...c40= CB1…CB40
r1…r36= A1m…A4m, T1m…T8m, B1m…B8m, L1Sm, L1Rm…L8Sm, L8Rm
r37…r84= T1p…T8p, T1s…T8s, L1Sp, L1Rp…L8Sp, L8Rp, L1Ss, L1Rs…L8Ss, L8Rs
Here, both A and B refer to the bus number, T denotes the transformer number, and L represents the transmission lines number. The subscripts m, p, and s denote main relay, primary backup relay, and secondary backup relay, respectively. In addition, subscripts S and R denote the sending and receiving ends of a transmission line, respectively. The operating logics of protective relays and circuit breakers are illustrated in [31]. Several scenarios have been evaluated on the test system. These scenarios and the estimation results are listed in Table I. These scenarios include multiple faults, circuit breakers and relay failures, and a failure of the control center in receiving some information. The results of Table I show that the fault sections are accurately estimated using the proposed approach. The analyses of fault diagnosis for these four scenarios are explained as follows:
4.1.1. Scenario 1 of the test system:
© 2018, IRJET | Impact Factor value: 6.171 | ISO 9001:2008 Certified Journal | Page 2692 operation of B1m. In addition, CB11 is tripped by operation
of L1Rm. According to the above explanations, this scenario contains simultaneous faults on bus B1 and line L1.
4.1.2 Scenario2 of the test system:
In this scenario, B1m and B2m are tripped due to a fault on B1 and B2. Thus, CB4, CB5, CB6, CB9 are opened by the operation of B1m and CB10 is opened by the action of B2m. Furthermore, L1Sm is tripped due to a fault on L1. CB7 is opened by L1Sm or by the action of B1m. In addition, L2Rm is tripped because of a fault on line L2. L2Rm sends a trip command to CB12 in order to eliminate the fault. However, it is observed that L1Rm and L2Sm refuse to actuate. Consequently, CB11 is opened by the operation of L1Rp and CB8 is opened by L2Sp or by the action of B2m. Therefore, there are simultaneous faults on buses B1, B2 and lines L1, L2 in this scenario.
4.1.3 Scenario3 of the test system:
There is a fault on T3, but T3m fails to actuate; thus, CB14 and CB16 are opened by T3p. Another fault occurs on L7, but L7Sm does not response. Consequently, CB29 is opened by the action of L7Sp. In addition, CB39 is opened by the operation of L7Rm. Here, there are simultaneous faults on transformer T3, and line L7.
4.1.4 Scenario4 of the test system:
There are simultaneous faults on B7, B8, T7, T8, L5 and L7; however, the main relays T8m, L5Rm and L7Sm refuse to actuate. Consequently, CB37 is opened by T8p and CB32 is opened by L5Rp or by the action of B8m. CB29 is also opened by L7Sp. CB19 is tripped due to the action of L5Sm. CB33 is opened by B7m or by the operation of B8m. CB34 is opened by T7m or B7m. CB35 is opened by B7m or by the action of T8p. CB36 is opened by T7m. CB39 is opened by L7Rm or B8m. Moreover, to eliminate the fault on B7, the secondary backup relays L6Ss and L8Ss actuate; then, CB20 and CB30 are tripped. B7m also sends a trip command to CB40, but CB40 fails to actuate.
CB 1
CB 2 CB 4
CB 3 CB 5 CB 6
CB 7 CB 11 CB 8 CB 12
CB 9
CB 10
CB 19 CB 20
CB 31 CB 32 CB 28
CB 27
CB 33
CB 22 CB 24
CB 23 CB 25 CB 21
CB 29 CB 39
CB 30 CB 40
CB 35 CB 37 CB 34 CB 36
CB 38 CB 18 CB 14 CB 16
CB 15 CB 17 L1
L2
L3 L4 L5 L6
L7 L7
L8 T1
T2
T3
T4
T5
T6
T7
T8 CB 13
A1 B1 A2
B2 B4
B3
A3 B5 A4
B6 B8
B7 CB 26
[image:4.595.298.568.113.345.2]Fig -2: Flowchart of TLBO algorithm.
Table -I: Test Scenarios and Estimation Results for Test System
Scenario ACTUATED PROTECTIVE DEVICES Faulted sections Estimated sections
1 CB4,CB5,CB6,CB7,CB11
B1m,L1Sp,L1Rm B1,L1 B1,L1
2
CB4,CB5,CB6,CB7,CB8, CB9,CB10,CB11,CB12 B1m,L1Sm,L1Rp,B2m,L2Sp , L2Rm
B1,B2,L
1,L2 B1,B2,L1,L2
3 CB14,CB16,CB29,CB39
T3p,L7Sp,L7Rm T3,L7 T3,L7
4
CB19,CB20,CB29,CB30,CB3 2,CB33,CB35,CB36,CB37,C B34,CB39,T7m,T8p,B7m,B 8m, L5SM,L5RP,L6SS,L7SP,L7RM
,L8SS
L5,L7,B 7,B8,T7, T8
L5,L7,B7, B8,T7,T8
4.2. Accuracy Test
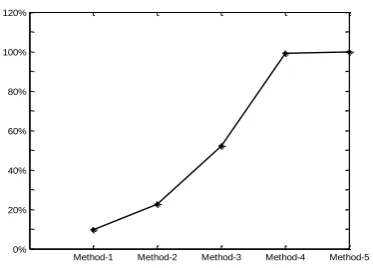
[image:4.595.72.255.576.730.2]Several accuracy tests have been implemented in this study. One hundred independent trials have been carried out. Tables II lists the accuracy rates of all scenarios of the test system, using 1 (CPSO), 2 (T1PSO), Method-3 (DE), Method-4 (ABC), and Method-5 (the proposed TLBO approach). Furthermore, a comparison between the methods is drawn in Fig. 3 based on the accuracy rates. From all of this, it can be inferred that methods 1, 2 and 3 have poor accuracy rates. Since the fault estimation problem is a discrete optimization problem with a high number of variables, these methods normally converge to the local optimum. Nevertheless, the results confirmed that the proposed method presented the best accuracy rate.
Table II: Comparison of accuracy rate
Scenario TLBO ABC DE T1PSO CPSO
1 100% 100% 54% 53% 30%
2 100% 98% 54% 16% 14%
3 99% 99% 49% 16% 20%
© 2018, IRJET | Impact Factor value: 6.171 | ISO 9001:2008 Certified Journal | Page 2693
[image:5.595.70.257.86.220.2]Method-1 Method-2 Method-3 Method-4 Method-5 0% 20% 40% 60% 80% 100% 120%
Fig. 3 Averaged accuracy rate of the test system
4.3. Convergence Test
To compare the convergence behavior of the methods, the convergence characteristics of scenario 2 of the test system are shown in Fig. 4. This figure shows that all the methods obtain the correct estimation of the fault sections with the minimum objective function values. It can be concluded from Fig. 4 that the first, second, and third methods converge faster than the other methods; however, the results of the Tables II show that these methods have poor accuracy. Since the method's accuracy is very important in fault section estimation problems, these methods are not appropriate to detect the faulty sections.
0 50 100 150 200 250
0 5 10 15
number of iterations
[image:5.595.306.566.297.589.2]o b je c ti v e f u n c ti o n TLBO ABC DE T1PSO CPSO
Fig. 4 Convergence characteristics of scenario 2 of the test system
4.4. Robustness Test
Since heuristic methods are population based algorithms with casual procedures, a single run is not enough to judge their performance. These kinds of methods have roughly the same results in different trials. Therefore, a number of trials with different initializations should be carried out to find the best solution and the best method. The lower the differences between the best solutions obtained in different trials of an algorithm are, the more robust the algorithm is.
The frequency of the objective function values for the first three scenarios of the test system after 100 independent trials have been tabulated in Table III. The results show that the proposed method has a greater probability of achieving a
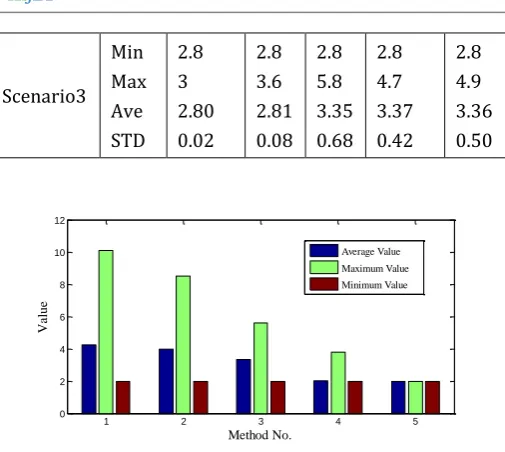
better solution in comparison with the other methods. Moreover, the best, the average, and the worst answer and also the standard deviation (STD) of the results for different scenarios after 100 trials have been listed in Table IV. A small standard deviation indicates that most of the solutions are close to the average. The results show that the proposed method reaches the minimum value of the objective function along with the smallest STD. Some results of scenario 2 for the test system are also presented in Fig. 5. It can be concluded that TLBO has the maximum consistency and robustness in comparison to the other methods.
Table III: Frequency of convergence
Range of objective function values
Methods 1.5-3.0 3.0-4.5 4.5-6.0 Greater than 6
[image:5.595.59.264.429.585.2]Scenario1 Method-1 Method-2 Method-3 Method-4 Method-5 51 68 94 100 100 21 22 6 0 0 23 8 0 0 0 5 2 0 0 0 Scenario2 Method-1 Method-2 Method-3 Method-4 Method-5 28 29 79 99 100 28 37 18 1 0 32 26 3 0 0 12 8 0 0 0 Scenario3 Method-1 Method-2 Method-3 Method-4 Method-5 49 43 51 99 100 48 56 43 1 0 3 1 6 0 0 0 0 0 0 0
Table IV: Convergence Result after 100 Trial
TLBO ABC DE T1PSO CPSO
[image:5.595.301.566.627.781.2]© 2018, IRJET | Impact Factor value: 6.171 | ISO 9001:2008 Certified Journal | Page 2694 Scenario3
Min Max Ave STD
2.8 3 2.80 0.02
2.8 3.6 2.81 0.08
2.8 5.8 3.35 0.68
2.8 4.7 3.37 0.42
2.8 4.9 3.36 0.50
1 2 3 4 5
0 2 4 6 8 10 12
Method No.
V
a
lue
[image:6.595.35.288.65.291.2]Average Value Maximum Value Minimum Value
Fig. 5. Consistency test of scenario 2.
4.5 Efficiency of calculation
[image:6.595.26.298.570.676.2]It should be noted that this analysis is off-line, not real time. Relays and CBs have already operated before estimation of the faulted section. In light of this fact, it does not matter too much if one algorithm converges a couple of seconds quicker. However, in order to compare the computation times of different methods, the calculation time of 100 trials for each scenario are listed in Table V. As tabulated in this table, the first three methods are faster than methods 4 and 5, but as mentioned before, these methods easily converge to local optimum points. Thus, they are not appropriate for fault section estimation problems. Furthermore, based on tabulation, method 5 requires less computation time than method 4. Lastly, it is essential to note that all computation times of the test system have been performed using a PC with 2.00 GHz processor. It is clear that the simulations computation times would be much shorter if applying a more powerful processor.
Table V. Computation Time of Methods
Method
1 Method2 Method3 Method4 Method5 Scenario1 3.98 s 2.70 s 4.33 s 41.34 s 8.91 s Scenario2 3.32 s 2.18 s 3.29 s 59.04 s 9.13 s Scenario3 4.02 s 3.68 s 4.18 s 48.36 s 5.37 s Scenario4 2.44 s 3.67 s 3.98 s 53.01 s 6.75 s
5. Conclusion
In this paper, Teaching-Learning-Based-Optimization algorithm (TLBO) as a robust algorithm in fault diagnosis problems is proposed. The proposed approach has been validated and compared with other algorithms including Conventional Particle- Swarm Optimization, Type1 Particle
Swarm Optimization, Differential Evolution, and Artificial Bee Colony. All these nature-inspired algorithms require algorithm parameters to be set to properly perform while the proposed optimization method is a parameter-free algorithm. Thus, selection of parameters to search for the optimum solution can be avoided by using this method. Simulations and comparisons show that TLBO is superior to other algorithms in estimating the faulty sections. The effectiveness of TLBO method was checked by implementing on a large scale power system and the results show that the proposed method has the best accuracy rate, maximum consistency, and robustness when compared to other methods. Therefore, this method appears very effective in solving fault section estimation problems.
REFERENCES
[1] A Ghasemkhani, V Sarfi, L Yang, H Livani, “Decentralized Dynamic State Estimation with Missing and Delayed PMU Measurements,” in Proc. IEEE Transm. Distrib. Conf. Expo., 2018.
[2] A. Ghasemkhani; H. Monsef; A. Rahimi-Kian; A. Anvari-Moghaddam, "Optimal Design of a Wide Area Measurement System for Improvement of Power Network Monitoring Using a Dynamic Multiobjective Shortest Path Algorithm," IEEE Systems Journal , vol.PP, no.99, pp.1-12.
[3] Y. Sekine, Y. Akimoto, M. Kunugi, C. Fukui, S. Fukui. "Fault diagnosis of Power Systems," in Proceedings of the IEEE, May 1992.
[4] S. Heydari, S. M. Mohammadi-Hosseininejad, H. Mirsaeedi, A. Fereidunian, and H. Lesani, “Simultaneous placement of control and protective devices in the presence of emergency demand response programs in smart grid,” International Transactions on Electrical
Energy Systems, 2018; e2537.
https://doi.org/10.1002/etep.2537.
[5] S.M.M. HN, S. Heydari, H. Mirsaeedi, A. Fereidunian, and A.R. Kian, “Optimally operating microgrids in the presence of electric vehicles and renewable energy resources,” in 2015 Smart Grid Conference (SGC), 2015, pp. 66–72
[6] A. Forooghi Nematollahi, A. Dadkhah, O. Asgari Gashteroodkhani, and B. Vahidi, "Optimal sizing and siting of DGs for loss reduction using an iterative-analytical method," Journal of Renewable and Sustainable Energy, vol. 8, no. 5, p. 055301, 2016.
© 2018, IRJET | Impact Factor value: 6.171 | ISO 9001:2008 Certified Journal | Page 2695 [8] H.J. Lee, B.S. Ahn Y.M. Park. "A fault diagnosis expert
system for distribution substations," IEEE Trans Power Deliv, vol. 15, pp. 92-7, 2000.
[9] Y.C. Huang. "Fault section estimation in power systems using a novel decision support system," IEEE Trans. Power Syst, Vols. 17,, no.2, pp. 439-444, May 2002..
[10] G.C. Jr, J. G Rolim, and H.H. Ziim. "Interperetation of remote backup protection operation for fault section estimation by a fuzzy expert system," in Proc. IEEE Bologna Power technol.Conf., Bologna, Italy, Vol. 2, pp.1-6, Jun.2003,
[11] L.L. Lai. "Application of neural networks to fault classification and protection," in Proceeding of the 4th international conference on advances in power system control, operation and management,vol. 1, 1997.p.72-6.
[12] T. Oyama. "Fault section estimation in power system using Holtzman machine," in Proce Sec Forum Artif Neural Netw appl Power syst, 1993:3-8.
[13] H.T Yang, W.Y Chang. C.L.Huang. "Power system distributed on-line fault section estimation using decision tree based neural nets approach," IEEE Transaction Power Delivery, Vol. 10, pp. 540-6, 1995.
[14] M. Jafari, V. Sarfi, A. Ghasemkhani, H. Livani, L. Yang, H. Xu and R. Koosha, "Adaptive Neural Network Based Intelligent Secondary Control for Microgrids," in Power and Energy Conference (TPEC), IEEE Texas, 2018.
[15] Sharifi S, Tivay A, Rezaei SM, Zareinejad M, Mollaei-Dariani B. Leakage fault detection in electro-hydraulic servo systems using a nonlinear representation learning approach. ISA Trans. February 2018;73:154–64.
[16] Sharifi, S., Rezaei, S. M., Tivay, A., Soleymani, F., & Zareinejad, M. (2016, October). Multi-class fault detection in electro-hydraulic servo systems using support vector machines. In Robotics and Mechatronics (ICROM), 2016 4th International Conference on (pp. 252-257). IEEE.
[17] Soleymani, F., Rezaei, S. M., Sharifi, S., & Zareinejad, M. (2016, October). Position control of a servo-pneumatic actuator using generalized Maxwell-Slip friction model. In Robotics and Mechatronics (ICROM), 2016 4th International Conference on (pp. 246-251). IEEE.
[18] J. Sun, S.Y. Qin,Y.H. Song."Fault diagnosis of electric power systems basedon fuzzy petri nets," IEEE Trans Power Syst, Vol. 19, pp. 2053-9, 2004.
[19] X. Luo, M. Kezunovic. "Implementing fuzzy fuzzy reasoning petri-nets for fault section estimation," IEEE trans Power Deliv, Vol. 23, pp. 676-85, 2008.
[20] L. Xu, M.Y Chow. "A classification approach for power distribution systems fault cause identification," IEEE Trans Power syst, Vol. 21, pp. 53-60, 2006.
[21] W.H Chen, C.W Liu, M.S Tsai. "Fast fault section estimation in distribution substations using matrix-based cause-effect networks," IEEE Trans Power Deliv, Vol. 16, pp. 522-7, 2001.
[22] S. Amin-Nejad, T. A. Gashteroodkhani, and K. Basharkhah, "A Comparison of MVDR and LCMV Beamformers’ Floating Point Implementations on FPGAs," Wireless Personal Communications, pp. 1-17.
[23] Y.Zhu, L. Huo, J. Lu. "Bayesian networks-based approach for power systems fault diagnosis," IEEE Trans Power Deliv, Vol. 21, pp. 634-8, 2006.
[24] F. S Wen, C.S Chang. "Probabilistic approach for fault section estimation in power systems based on a refined genetic algorithm,"
Proc.Inst.Elect.Eng,Gen.Transm.Distrib, Vol. 144 no.2, pp. 160-168, March1997.
[25] L.L.Lai, A.G Sichanie, B.J.Gwyn. "Comparison between evolutionary programming and a genetic algorithm for
fault section estimation,"
Proc.Inst.Elect.Eng.Gen.Transm.Distrib, Vol. 145.no.2, pp. 616-620, Sept 1998.
[26] Y.X. Wu, X.N. Lin, S.H. Miao, P .Liu, D.Q. Wang, D.B. Chen. "Application of family eugenics based evelution algorithms to electric power system fault section estimation," in Proc. IEEE/Power Energy Soc. Transm. Distrib. Conf. Exhibit, Dalian, China, pp.1-5, 2005.
[27] P.P. Bedekar, S.R. Bhide.V.S. Kale. "Fault section estimation in power system using Hebb's rule and continuous genetic algorithm," in Int J Electr Power Energy Syst, Vol. 33. pp. 475- 465, 2011.
[28] F.S.Wen, C. S.Chang, and L.Tian. "A modified abductive inference modal for fault section etimation in power systems using the tabu search approach," Elect,Power,compon,Syst, Vol. 28 no.5, pp. 399-414, May 2000.
[29] F. B. Leao, R.A.F. Pereira, and J.R.S. Mantovani. "Fault section estimation in electric power systems using an optimization immun algorithm," Elect ,Power System, Res, Vol. 80, pp. 1341-1352, 2010.
[30] C.S. Chang, L.Tian, and F.S. Wen. "A new approach to fault section estimation in power systems using ant systems," Elect. Power Syst. Res., Vol. 49.no.1, pp. 63-70, Feb, 1999.
© 2018, IRJET | Impact Factor value: 6.171 | ISO 9001:2008 Certified Journal | Page 2696 optimization model and binary particle swarm
optimiization," in Proc. Power Energy Soc, Gen. Meeting,, Calgari,A.B. Canada, pp.1-8, july 2009.
[32] S.J. Huang, X.Z. Liu. "Application of artificial bee colony-based optimization for fault section estimation in power systems," Electrical Power and Energy Systems, Vol. 44, pp. 210-218, 2013.
[33] O. A. Gashteroodkhani and B. Vahidi, "Application of Imperialistic Competitive Algorithm to Fault Section Estimation Problem in Power Systems," in The International Conference in New Research of Electrical Engineering and Computer Science, Iran, Sep 2015.
[34] S.J. Huang, X.Z. Liu, W.F. Su, and T.C.Ou."Application of Enhanced Honey-Bee Mating Optimization Algorithm to Fault section Estimation in Power Systems," IEEE Trans.Power Deliv, Vol. 28. no. 3, July 2013.
[35] R.V. Rao, V.J. Savsani, D.P. Vakharia, "Teaching-learning-based optimization: a novel method for constrained mechanical design optimization problems", Comput. Aided Des. Vol. 43, No. 3, pp. 303-315, 2011.
[36] R.V. Rao, V.J. Savsani, D.P. Vakharia, "Teaching-learning-based optimization: a novel optimization method for continuous non-linear large scale problems", Inform. Sci. Vol. 183, pp. 1–15, 2012.