Optimal Score Level Fusion using Modalities
Reliability and Separability Measures
Anzar S.M.
Electronics and Communication Engineering National Institute of Technology Calicut
India, Pin: 673601
Sathidevi P.S.
Electronics and Communication Engineering National Institute of Technology Calicut
India, Pin: 673601
ABSTRACT
This paper presents two optimal fusion techniques using reliability and separability measures for a multibiometric system, employing fingerprints and voice. In the first method, reliabilities of fingerprint and voice modalities are measured and the integration weights are computed as the ratio of these two reliabilities. The computed reli-ability ratio is then optimized against the recognition accuracy. The optimizing parameter is estimated in the training/validating phase. Latter is a multi-normalization based fusion scheme, where the sep-arability measures are used as the integration weights to improve the performance of the biometric system. The inter/intra class sepa-rability measures and the d-prime sepasepa-rability measures, under var-ious noise conditions are estimated in the training/validation stage. Performance of the proposed methods are compared with that of the baseline techniques using score level fusion. Experimental stud-ies show that, the proposed methods improve global recognition rate and reduce the False Acceptance Rate (FAR) and False Re-jection Rate (FRR) over the baseline systems. The advantage of the proposed biometric techniques is that they can be easily inte-grated into any multibiometric system with score level fusion and find extremely useful in applications especially with less number of available training samples.
Keywords:
Reliability measures, Separability measures, Score level fusion, score normalization, noise robustness
1. INTRODUCTION
Data variations are considered as one of the main problems in multimodal fusion. In this paper, the focus is on improving the score level fusion of fingerprint and voice biometrics, under varying noise conditions [2]. Even though the recognition accuracy of the voice biometric is high in clean conditions, its weakness is mainly due to their inability to cope robustly with audio corruptions. Audio corruptions can arise from various sources such as environmental noises or voice interference, reverberation effects or transmission channel distortion etc. Voice features show large intra-class differences, inter-class similarities and may vary with environmental and physiological factors as well as time [10]. When a biometric measure obtained from one modality is corrupted by noise, the evidence presented by a comparatively reliable trait is used for the more accurate de-termination of identity. Noisy Biometric may not be successfully matched with the respective stored template in the database, re-sulting in genuine user being incorrectly rejected or an impostor accepted as a genuine [20]. A reliability ratio based integration weight optimization scheme is proposed here to determine the optimal weight factor for the complementary modalities, under
different noise conditions. As the feature vector varies with the amount of noise, the quality of score level fusion heavily depends on the reliability of the unimodal sources. Reliability measure gives the degree of trust in the recognition result drawn from individual subsystems [12]. The performance of biometric fusion can be improved if we could use the score-based relia-bility measures to find the best integration weight. Determining proper weights for the individual modalities is crucial for robust recognition as it determines the contribution of each modality towards the final decision. At high SNR (Signal to Noise Ratio), the voice matcher outperforms the fingerprint matcher and the final decision heavily relies on the score values of the voice matcher. When the voice biometric is contaminated by noise, the fingerprint matcher outperforms the voice matcher. In this case, the score values of the fingerprint matcher contribute more to the final decision. Therefore, it is crucial to estimate the best weight factor dynamically, to combine both the modalities for better performance, otherwise the system will show attenuating fusion [17]. Estimation of reliability measures and the fusion strategy are detailed in section 4. We estimated the optimizing parameter in the training/validation stage using Leave-One-Out Cross Validation technique (LOOCV). The optimal weight estimated in the training/validation stage is subsequently used in the fusion module for testing with the unknown input samples.
2. RELATED WORK
Jain et al. in 1999 introduced a multimodal biometric system that integrates face, fingerprints and voice [9]. Kar-Ann Toh in 2003 proposed a generalized reduced multivariate polynomial model for combining fingerprint and speaker verification decisions [23]. Wang et al. in 2004 combined fingerprint and voiceprint bio-metrics [26]. Lewis et al. in 2004 shed some light on audio-visual speech recognition systems using dispersion measures as the integration weights [13]. Toh et al. in 2005 combined fin-gerprint and speaker verification decisions in the match score level using functional link network [24]. Poh et al. in 2005 pro-posed a margin derived confidence measure while fusing two system opinions [16]. Jain et al. in 2005 examined the effect of different score normalization techniques on the performance of multimodal biometric system [8]. Kryszczuk et al. in 2007 pro-posed a method of performing multimodal fusion using face and speech data combining signal quality measures and reliability es-timates [11]. Sarkar et al. in 2008 fused fingerprint, face, voice and gait [21]. Bendris et al. in 2009 introduced quality measures in audio-visual identity verification [5]. Alsaade et al. in 2009 showed that score normalization and quality-based fusion im-proves the accuracy of multimodal biometrics [3]. Optimal inte-gration weight estimation using least squares technique was re-ported in [23]. Reliability based optimal integration weight esti-mation for audio-visual decision fusion was reported in [17, 18]. We were motivated by [8, 10, 17] to develop a bimodal system, with fingerprint and voice biometrics, that is more robust to en-vironmental and sensor noise. The focus here is to determine the
best integration weightβusing reliability and separability mea-sures. The proposed integration weight proves to be simpler and gives robust and improved recognition accuracy at varying noise conditions. To the best of our knowledge, the proposed score level fusion of fingerprints and voice using reliability and sep-arability measures has not been attempted until now.
3. INDIVIDUAL CLASSIFIERS
3.1 Fingerprint Classifier
We considered the minutiae-based fingerprint matching using ridge counting, as this approach is more robust against finger-print distortions [27]. Given two sets of minutiae from the tem-plate (T) and the input fingerprint (I) images, the matching al-gorithm compares the minutiae points in the two images and re-turns a degree of similarity [15]. Each minutiae is represented as
a tripletm={x, y, θ}that indicates the x, y minutiae location
coordinates and the minutiae angleθ. A minutiaemiin T and a
minutiaem0jin I are considered matching, if the spatial distance
(sd) between them is lesser than a given tolerancer0and the
di-rection difference (dd) between them is lesser than an angular toleranceθ0[15].
sd(m0j, mi) =
q
(x0j−xi)2+ (y 0
j−yi)2≤r0 (1)
dd(m0j, mi) = min(|θ
0
j−θi|,3600− |θ 0
j−θi|)≤θ0 (2)
Elastic matching algorithm is used to perform matching between the two fingerprints [27]. Match score formula for the reference and the test print is given by [28],
M atchingscore= 100Npair
max{M, N} (3)
whereNpairis the number of matched minutiae,Mis the
num-ber of minutiae in the template set, andNis the number of
minu-tiae in the test set. Maximum similarity criterion is used for fin-gerprint pattern classification.
3.2 Voice Classifier
Short-time spectral analysis is used to characterize the quasi-stationary voice samples. To represent the voice samples in a parametric way, we considered the MFCC representation as they were proved to be efficient and compact [19]. The number of mel cepstrum coefficients, is chosen as 16 (here). Gaussian mixture model (GMM) is considered here for representing the acous-tic feature vectors. The complete Gaussian mixture model is parametrized by the mean vectors, covariance and the mixture weights. These parameters are collectively represented by [19],
λ={ai, µi,Σi}, i= 1..., M (4)
So, by using the MFCC feature vectors and the statistical GMM,
each enrolled speaker is uniquely represented by a specificλ.
In the training stage itself, each enrolled speakers ing, where
bf g={gˆ1,gˆ2, ...,gˆG}is represented by a unique GMM
0
s (λ0s).
In the testing stage, the features from the unknown speaker0s
ut-terances are compared with statistical models of the voices of speakers known to the system. The Bayes rule suggests to allo-cate the test samples to the classgˆk, having the highest posterior
probability, that is [19],
ˆ
gk=arg max
1≤k≤Gp(X|λk) (5)
wherep(X|λk)is thea posterioriprobability for a given
obser-vation sequence. In this case, maximum likelihood classifier is used.
4. OPTIMAL FUSION USING RELIABILITY
MEASURES
One of the popular approaches among various integration weight computation schemes is the reliability ratio based method. Reli-ability estimation has shown to be an efficient and accurate way for reducing the classification errors in both unimodal and mul-timodal systems [11]. Reliability measure can be used as an aux-iliary quality information for the score level fusion. In this ap-proach, the integration weight is determined from the relative re-liability of the two modalities. The rere-liability parameters of each modality are captured from the matching score matrix. When the voice samples does not contain any noise, there are large differ-ences in the matching score values. As the voice samples be-come noisy, these differences tend to bebe-come small. Considering this observation, the reliability of a modality is defined in several ways as mentioned in [13]. The modalities reliability parameters are estimated based upon the variances of the matching scores. The usual measure is to calculate the variance around the best or the least score rather than the mean or median. The reliability ratio can be calculated as follows [12, 17].
γ= SV
SV+SF
(6)
whereSV andSF are the reliability measures of the voice and
fingerprint modality, respectively. This can be obtained from the respective matching score matrices using
Sm=
1 N
N
X
n=1
(sm
n −min(s m n))
2
(7)
where ‘N’ is the number of test samples considered from all the classes and ’m’ stands for the reliability of either fingerprint(F) or voice (V) modality. This quantity measures the dispersion of the score values to the least score rather than the mean. Even though the integration weight using equation 6 can improve noise robustness under certain noise conditions, it is not always the
optimal. Hence, a modified integration weightβgiven by
Table 1. Training/ Validation Accuracy of Individual Classifiers
Modality Voice Fingerprints
SNR in dB Set.No. -10 -5 0 5 10 15 20 Clean
[image:3.595.354.493.318.450.2]Val.1 9.3478 16.087 33.9130 50.6522 65.6522 87.1738 94.5652 95.6522 Val.2 4.3478 6.7391 25.8696 44.7826 70.2174 86.5217 96.5218 91.3043 Val.3 6.7391 20.0000 27.6087 42.1739 66.9565 84.5652 99.1304 91.3043 Accuracy Val.4 8.2609 12.8261 18.4783 33.9130 58.0435 87.8260 100.0000 86.9565 Val.5 7.8261 20.2174 21.9565 30.2174 59.3478 76.0869 95.2174 60.8696 Val.6 4.3478 4.5652 23.9131 51.5217 81.0870 95.2174 100.0000 86.9565 Val.7 9.7825 13.2609 16.3044 45.6522 74.7826 95.4348 98.2609 95.6522 Average 7.2360 13.3851 24.0062 42.7019 68.0124 87.5465 97.6708 86.9565
Table 2. Optimal Integration Weights estimated using LOOCV
No SNR Baseline System Proposed reliability based method
in dB GSβ GAβ γ GSxopt GAxopt PSOxopt GSβ GAβ PSOβ
1 20 0.7071 0.8087 0.7421 0.8174 0.9612 0.9664 0.6066 0.7133 0.7172
2 15 0.6928 0.7387 0.7086 0.7446 0.9410 0.9800 0.5276 0.6668 0.6944
3 10 0.6500 0.6605 0.7035 0.7444 0.8722 0.9868 0.5237 0.6136 0.6942
4 5 0.1255 0.1255 0.6875 0.600 0.7796 0.8662 0.4125 0.5360 0.5955
5 0 0.0000 0.0000 0.6720 0.4165 0.2674 0.2722 0.2799 0.1797 0.1829
6 -5 0.0000 0.0000 0.6518 0.0677 0.1915 0.0500 0.0441 0.1248 0.0326
7 -10 0.0000 0.0000 0.6365 0.0528 0.1568 0.0148 0.0336 0.0998 0.0094
conditions [17].
β=xopt×
h SV
SV +SF
i
(8)
wherexoptis the scaling factor which needs to be optimized. In
order to emphasize or deemphasize the scores obtained from the unimodal systems, the integration weight factor must be adaptive and optimal. That is, the weights must be very appropriate and self adapted to the fluctuating inputs. So, we propose linear pro-gramming and stochastic optimization techniques to obtain the appropriate integration weights for fusion. The optimal integra-tion weight was obtained in the training/ validaintegra-tion stage using LOOCV. The min-max normalized match scores from the two modalities were combined by the weighted sum rule to produce
the final decision. Given the speaker scoresS(sc)and the finger
scoresS(f c), the fused scores can be obtained by linearly
com-bining the two scores.
S(f us) = βS(sc)+ (1−β)S(f c) (9)
The weighting factorβ(0≤β≤1)determines how much each
modality contributes to the final decision. The proposed method
systematically chooses the best scaling factorxopt from a
de-fined domain(0≤xopt≤1) so as to maximize the objective
function (recognition accuracy). The objective function is given by:
RecognitionAccuracy=−
P
diag(CM at)
P P (CM at)
×100 (10)
whereCM at is the confusion matrix. The performance of the
proposed scheme is compared with that of equal weight bimodal biometric system and the method proposed by [4]. To show the effectiveness of the proposed technique, we evaluated the perfor-mance of the system with a direct search optimization method like Grid Search (GS) and random search optimization methods such as Genetic Algorithm (GA) and Particle Swarm Optimiza-tion (PSO).
5. FUSION USING MULTI-NORMALIZATION
AND SEPARABILITY MEASURES
The global recognition rate of the multibiometric system could be improved by incorporating the separability measures as inte-gration weights in the fusion module. Here, we considered in-ter/intra class distance measure from the feature space and the d-prime separability measure from the matching score space.
1 2 5 10 20 40 60 80 90 95 98 99 1
2 5 10 20 40 60 80 90 95 98 99
False Accept Rate (in %) →
F
a
lse
R
e
je
ct
io
n
R
a
te
(i
n
%
)
→
[image:3.595.360.493.493.622.2]Fusion with 20 db SNR Fusion with 15 db SNR Fusion with 10 db SNR Fusion with 5 db SNR Fusion with 0 db SNR Fusion with -5 db SNR Fusion with -10 db SNR
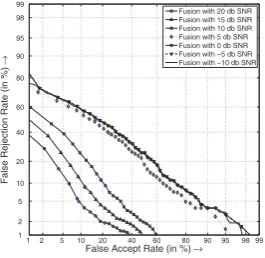
Fig. 1. System With Equal Weighting (Baseline)
1 2 5 10 20 40 60 80 90 95 98 99
1 2 5 10 20 40 60 80 90 95 98 99
False Accept Rate (in %) →
F
a
lse
R
e
je
ct
io
n
R
a
te
(i
n
%
)
→
Fusion with 20 db SNR Fusion with 15 db SNR Fusion with 10 db SNR Fusion with 5 db SNR Fusion with 0 db SNR Fusion with −5 db SNR Fusion with −10 db SNR
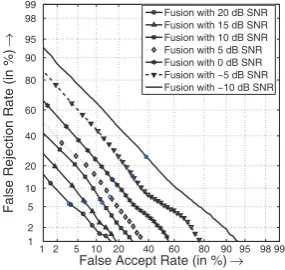
Fig. 2. GS Based Optimization (Baseline)
5.1 Estimation of Inter/Intra Class Distance
The inter/intra class distance based on Euclidean norms gives an indication of how well the classes in the feature space can be discriminated. Here, the basic assumption is that the class de-pendent distributions are such that the expectation vectors of
different classes are discriminating [25]. LetTS is a labelled
training set withNS feature vectors. The classesωk are
rep-resented by subsetsNk ⊂ NS, each class havingNkfeatures
(P
Nk=NS). Feature vectors inTSwithout reference to their
classes are denoted byzn. Feature vectors in Tk (i.e. vectors
coming from the classωk) are denoted byzk,n. In order to
Table 3. Recognition Accuracy with Baseline and Reliability based methods
No SNR Individual Classifiers Baseline Systems Proposed Method
in dB Fingerprint Voice Equal Weightage Grid Search Genetic Grid Search Genetic PSO
1 20 95.6522 98.6956 97.8261 100.0000 100.0000 100.0000 100.0000 100.0000
2 15 95.6522 91.4493 97.6812 97.8261 97.8261 100.0000 100.0000 100.0000
3 10 95.6522 69.4203 95.6522 97.2464 97.1015 97.8261 97.8261 98.0507
4 5 95.6522 33.1884 95.6522 95.6522 95.6522 96.8116 96.8116 96.5290
5 0 95.6522 23.1884 85.6522 95.6522 95.6522 93.4783 93.4783 93.2826
6 -5 95.6522 9.1304 68.6956 95.6522 95.6522 93.4783 93.4783 92.2464
7 -10 95.6522 5.6521 57.3913 95.6522 95.6522 93.4783 93.4783 92.0942
Table 4. Combining the Weight Factors from the Feature and Score space
No. SNR in dB d0
F d
0
V W1 ρF ρV W2 (W1+W2)/2 W1×W2 Adaptive weight
1 20 0.8823 2.1176 0.7059 0.0166 0.0314 0.6358 0.6799 0.4615 0.6799
2 15 0.8823 1.8633 0.6786 0.0166 0.0305 0.6479 0.6633 0.4397 0.6633
3 10 0.8823 1.5593 0.6386 0.0166 0.0263 0.6128 0.6257 0.3913 0.6257
4 5 0.8823 1.2692 0.5899 0.0166 0.0252 0.6033 0.5966 0.3559 0.5966
5 0 0.8823 0.9403 0.5159 0.0166 0.0159 0.4886 0.5023 0.2521 0.2521
6 -5 0.8823 0.6222 0.4136 0.0166 0.0079 0.3236 0.3686 0.1338 0.1338
7 -10 0.8823 0.2503 0.2210 0.0166 0.0038 0.1855 0.2033 0.0410 0.0410
1 2 5 10 20 40 60 80 90 95 98 99
1 2 5 10 20 40 60 80 90 95 98 99
False Accept Rate (in %) →
F
a
lse
R
e
je
ct
io
n
R
a
te
(i
n
%
)
→
[image:4.595.371.514.304.439.2]Fusion with 20 db SNR Fusion with 15 db SNR Fusion with 10 db SNR Fusion with 5 db SNR Fusion with 0 db SNR Fusion with −5 db SNR Fusion with −10 db SNR
Fig. 3. GA Based Optimization (Baseline)
scatter matrices. Scatter matrices gives some information about the dispersion of the feature vectors around their mean. The
sam-ple mean of classωkis given by
ˆ
µk=
1
Sk
Sk
X
n=1
zk,n (11)
The sample mean of the entire training set is given by
ˆ
µ= 1
SN
SN
X
n=1
zn (12)
Matrix that describes the scattering of vectors from classωkis
Sk=
1
Nk
Nk
X
n=1
(zk,n−µˆk) (zk,n−µˆk) T
(13)
Skprovides information about the average distance of the
scat-tering for classωk. LetSw andSb are the within class scatter
matrix and between class scatter matrix respectively.Sw gives
the average scattering within the classes. In order to obtainSw,
we find the scattering of all the classes and take the average.
Sw=
1
NS
K
X
k=1
NkSk (14)
Sb gives the scattering of the class dependent sample means
around the overall average.
Sb=
1
NS
K
X
k=1
Nk( ˆµk−µˆ) ( ˆµk−µˆ) T
(15)
1 2 5 10 20 40 60 80 90 95 98 99 1
2 5 10 20 40 60 80 90 95 98 99
False Accept Rate (in %) →
F
a
lse
R
e
je
ct
io
n
R
a
te
(i
n
%
)
→
[image:4.595.99.234.304.436.2]Fusion with 20 dB SNR Fusion with 15 dB SNR Fusion with 10 dB SNR Fusion with 5 dB SNR Fusion with 0 dB SNR Fusion with −5 dB SNR Fusion with −10 dB SNR
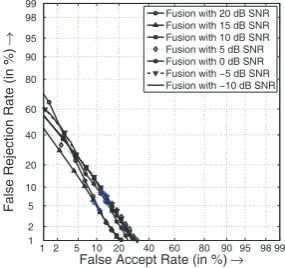
Fig. 4. Reliability Based GS (Proposed)
The performance measure well suited to express the separability of classes is the ratio between interclass and intraclass distance [25]. That is,
JIN T ER
JIN T RA
= trace(Sb)
trace(Sw)
(16)
JIN T ERdenotes the fluctuations of the conditional expectations
around the overall expectation, i.e. the fluctuations of the signal,
whileJIN T RA measures the fluctuations due to noise. Hence
JIN T ER
JIN T RA can be considered as ‘signal-to-noise-ratio’ [25]. This
measure is estimated from the feature space of both the finger-prints and voice modalities. The separability measures thus ob-tained in the training stage are used as the integration weights for fusion in the testing stage.
5.2 Score Normalization
Score normalization is essentially a transformation technique, that effectively normalizes for any unwanted peculiarities in-volved in the raw similarity computations. Various score nor-malization techniques were proposed in the literature [1, 8, 22]. For a good normalization scheme, the estimates of the location and scale parameters of the matching score distribution must be robust and efficient. All the normalization techniques are not equally suited for the different match score distributions. Here we use cohort and tanh normalization techniques for the finger-print and voice similarity scores, to enhance the efficiency and the robustness of the system, under varying noise conditions. Tanh (TH) normalization is one of the robust and efficient nor-malization methods. This nornor-malization method transforms the genuine scores to a distribution with a mean of 0.5 and standard
Table 5. Recognition Accuracy with Separability Measures
No. SNR Accuracy of Classifiers SMIW MNSMIW
in dB Fingerprint Voice Average Product Adaptive Average Product Adaptive 1 20 95.6522 98.6956 100.0000 97.8261 100.0000 100.0000 100.0000 100.0000 2 15 95.6522 91.4493 97.8261 95.6522 97.8261 100.0000 100.0000 100.0000 3 10 95.6522 69.4203 96.5217 95.6522 96.5217 100.0000 100.0000 100.0000
4 5 95.6522 33.1884 95.2174 95.6522 95.6522 100.0000 100.0000 100.0000
5 0 95.6522 23.1884 85.9420 93.4783 93.4783 100.0000 100.0000 100.0000
6 -5 95.6522 9.1304 82.1739 93.4783 93.4783 100.0000 100.0000 100.0000
7 -10 95.6522 5.6521 87.5362 92.3188 92.3188 100.0000 100.0000 100.0000
1 2 5 10 20 40 60 80 90 95 98 99 1 2 5 10 20 40 60 80 90 95 98 99
False Accept Rate (in %) →
F a lse R e je ct io n R a te (i n % ) →
[image:5.595.111.254.213.348.2]Fusion with 20 dB SNR Fusion with 15 dB SNR Fusion with 10 dB SNR Fusion with 5 dB SNR Fusion with 0 dB SNR Fusion with −5 dB SNR Fusion with −10 dB SNR
Fig. 5. Reliability Based GA (Proposed)
1 2 5 10 20 40 60 80 90 95 98 99 1 2 5 10 20 40 60 80 90 95 98 99
False Accept Rate (in %) →
F a lse R e je ct io n R a te (i n % ) →
Fusion with 20 dB SNR Fusion with 15 dB SNR Fusion with 10 dB SNR Fusion with 5 dB SNR Fusion with 0 dB SNR Fusion with −5 dB SNR Fusion with −10 dB SNR
Fig. 6. Reliability Based PSO (Proposed)
0 0.5 1 1.5 2
0 0.1 0.2 0.3 0.4
Fused Score for 20 db (y)→
p(y)
→
Genuine Scores Impostor Scores
0 0.5 1 1.5 2
0 0.1 0.2 0.3 0.4
Fused Score for 10 db (y)→
p(y)
→
Genuine Scores Impostor Scores
0 0.5 1 1.5 2
0 0.1 0.2 0.3 0.4
Fused Score for 5 db (y)→
p(y)
→
Genuine Scores Impostor Scores
0 0.5 1 1.5 2
0 0.1 0.2 0.3 0.4
Fused Score for 0 db (y)→
p(y)
→
Genuine Scores Impostor Scores
0 0.5 1 1.5 2
0 0.1 0.2 0.3 0.4
Fused Score for −5 db (y)→
p(y)
→
Genuine Scores Impostor Scores
0 0.5 1 1.5 2
0 0.1 0.2 0.3 0.4
Fused Score for −10 db (y)→
p(y)
→
Genuine Scores Impostor Scores
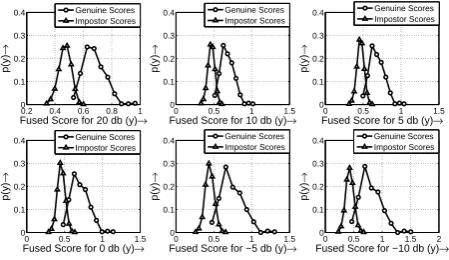
Fig. 7. Density Plot: Equal Weighting (Baseline)
scores to a range (0,1). Given a set of matching scores s ={si},
i = 1,2,...,n, the normalized scores0iis obtained by,
s0i = 1
2
tanh
α(si−mean(s))
std(s)
(17)
0 0.5 1
0 0.1 0.2 0.3 0.4
Fused Score for 20 dB (y)→
p
(y)
→
Genuine Scores Impostor Scores
0 0.5 1
0 0.1 0.2 0.3 0.4
Fused Score for 10 dB (y)→
p
(y)
→
Genuine Scores Impostor Scores
0 0.5 1
0 0.1 0.2 0.3 0.4
Fused Score for 5 dB (y)→
p
(y)
→
Genuine Scores Impostor Scores
0 0.5 1
0 0.1 0.2 0.3 0.4
Fused Score for 0 dB (y)→
p
(y)
→
Genuine Scores Impostor Scores
0 0.5 1
0 0.1 0.2 0.3 0.4
Fused Score for −5 dB (y)→
p
(y)
→
Genuine Scores Impostor Scores
0 0.5 1
0 0.1 0.2 0.3 0.4
Fused Score for −10 dB (y)→
p
(y)
→
[image:5.595.111.254.393.527.2]Genuine Scores Impostor Scores
Fig. 8. Density Plot: Reliability GA (Proposed)
1 2 5 10 20 40 60 80 90 95 98 99
1 2 5 10 20 40 60 80 90 95 98 99
False Accept Rate (in %) →
False Rejection Rate (in %)
→
Fusion with 20 db SNR Fusion with 15 db SNR Fusion with 10 db SNR Fusion with 5 db SNR Fusion with 0 db SNR Fusion with −5 db SNR Fusion with −10 db SNR
Fig. 9. Fusion With Separability Measures (Proposed)
In Cohort (C) normalization method a given query/test-sample is compared with the claimed as well as the cohort (neighbours) of the claimed identity[1]. Lets(x, λ)is the similarity score of the
query with the claimed identity,s x,λ¯is the similarity score
of the query with the cohort, where x is the query template,λ
is the claimant class andλ¯represents the background class
(U-λ), where U represents the universal set. The normalized scores
c(x, λ)can be calculated by,
c(x, λ) = s(x, λ)
s x,¯λ (18)
Assuming the cohort to a size of k,s x,¯λcan be determined
using the max-rule [1].
s x,λ¯ = maxs x, λ1
, s x, λ2
, ...s x, λk (19)
s(x, λ1), s(x, λ2), ...s x, λk
is the set of similarity score
of the query with the cohortλj’s for the enrolled identityλ. j=
[image:5.595.383.523.394.529.2] [image:5.595.77.298.567.694.2]0.2 0.4 0.6 0.8 1 0
0.1 0.2 0.3 0.4
Fused Score for 20 db (y)→
p(y)
→
Genuine Scores Impostor Scores
0 0.5 1 1.5
0 0.1 0.2 0.3 0.4
Fused Score for 10 db (y)→
p(y)
→
Genuine Scores Impostor Scores
0 0.5 1 1.5
0 0.1 0.2 0.3 0.4
Fused Score for 5 db (y)→
p(y)
→
Genuine Scores Impostor Scores
0 0.5 1 1.5
0 0.1 0.2 0.3 0.4
Fused Score for 0 db (y)→
p(y)
→
Genuine Scores Impostor Scores
0 0.5 1 1.5
0 0.1 0.2 0.3 0.4
Fused Score for −5 db (y)→
p(y)
→
Genuine Scores Impostor Scores
0 0.5 1 1.5 2
0 0.1 0.2 0.3 0.4
Fused Score for −10 db (y)→
p(y)
→
[image:6.595.75.300.101.231.2]Genuine Scores Impostor Scores
Fig. 10. Density Plot: MNSMIW (Proposed)
5.3 Estimation of d-prime Separability Measure
The d-prime separability measures gives the ratio of separation
to spread (Separation/spread) of the genuine and the
impos-tor score distributions. Separation gives the indication that how much mean of the distributions are separated and the spread gives an indication of the overlap. d-prime gives a measure how well the non-match score probability density and the match score
probability density are separated. thed0is defined as [6],
d0=pµm−µn
(σ2 m+σ2n)
(20)
whereµm= mean of genuine scores;σ2m= variance of genuine
scores;µn= mean of impostor scores;σ2n= variance of impostor
scores. A higher d-prime indicates that the Genuine scores can be more readily detected. Thus, the discriminability of a class depends both on the separation and the spread of the Genuine and impostor score distribution curves.
5.4 Fusion Using Separability Measures
We combined the separability measures from the feature space and the score level phase using sum rule and product rule. Let
ρF and ρV denote the inter/intra class distance measures
ob-tained from the fingerprint and voice modality respectively.d0
F
andd0
V denote the d-prime separability measures obtained from
preprocessed similarity scores of fingerprints and voice modality respectively. The results are shown in Table 4 and it is evident from the table that the separability measure decreases with the increase in noise. Following parameters are defined to obtain the fused scores and Table 3.2 depicts their numerical values.
ρ= ρV
ρF +ρV
(F eature space) (21)
d0= d
0
V
d0
F+d
0
V
(Score space) (22)
β= 1
2
ρV
ρF+ρV
+1
2 d0
V
d0
F+d
0
V
(Average) (23)
β=
ρV
ρF+ρV
×
d0V
d0
F+d
0
V
(P roduct) (24)
We performed an adaptive score level fusion using the separabil-ity measures. It is experimentally found that for normal
condi-tions the weighted average of the separability measures12ρ+1
2d
0
provides optimal weighting (improves the recognition accuracy) while for the extreme noise conditions the product of the
separa-bility measuresρd0 improves the recognition accuracy. In order
to derive the advantages of combining the separability measures using sum and product rule, under normal and extreme condi-tion, we use an adaptive approach for the score level fusion. Un-der normal noise conditions from 20 dB SNR to 5 dB SNR we
combined the separability measures using sum rule and for ad-verse conditions from 0 dB SNR to -10 dB SNR the separability measures are combined using the product rule. This strategy can improve the overall recognition accuracy as well as the robust-ness of the system. The results are shown in Table 5.
6. SIMULATION RESULTS AND DISCUSSIONS
Finger images from the FVC2002 fingerprint database [14] and voice samples from ELSDSR database [7] have been employed for the experimentation. We took nine samples per person from the fingerprint and the speaker database. Out of these nine sam-ples from each biometric, seven samsam-ples were used for training the individual classifiers and two samples were used for test-ing. As the fingerprint biometric is more robust, the performance of the system under varying noise conditions was not consid-ered. The performance of the weak, voice biometric system un-der varying noise conditions was investigated by artificially de-grading the test samples with additive white Gaussian noise. The output of the two classifiers were consolidated into a single vec-tor of scores using the sum rule of fusion.
6.1 Fusion With Baseline Systems
6.1.1 Fusion with equal weights. In this case a constant value
ofβ= 0.5was assigned as an integration weight at all SNR
lev-els as discussed in [4]. This technique will not favour one modal-ity over another. More over the combined recognition accuracy may not be maximum always. The training accuracy of the base-line system is shown in Table 3. Further insight could be obtained from Fig. 1 and Fig. 7.
6.1.2 Fusion With Optimal Integration Weight Without Relia-bility Information. We compared the proposed reliability based integration weight optimization technique with a non-reliability based integration weight estimation scheme as discussed in [4]. The overall testing accuracy of the non-reliability based inte-gration weight estimation scheme is presented in Table 3. This method shows improved accuracy than any of the unimodal sys-tems in the normal operating conditions and maintained the ac-curacy of the better unimodal ones for all the extreme noise con-ditions. Further insight could be obtained form the DET plots (Fig. 2 and Fig. 3). The disadvantage of the method is at the extreme noise conditions the fusion module contributed zero weighting to the voice modality. In these conditions, the over-all performance depends solely on the fingerprint matcher.
6.2 Fusion With The Proposed Methods
6.2.1 Fusion with reliability based optimal integration weight.
From the training/validation stage (using LOOCV), we obtained
optimal integration weights (β0s) for different noise conditions
from -10dB to 20 dB. We have applied one dimensional Grid Search method and the stochastic optimization techniques; GA and PSO for optimizing the relaiability-based integration weight. The overall validation accuracy of the individual classifiers for various SNR conditions is shown in the Table 1. The relative re-liability ratio estimates of the two modalities and the rere-liability-
reliability-based optimal integration weight β estimated for the various
SNR conditions are shown in the Table 2. Theβvalues thus
qual-ity measure for finding the optimal integration weight. This is because a higher reliability measure positively correlates with the chance of making a correct classification decision. The score density plot in Fig. 8 indicates that the effective overlap between the genuine and impostor score distributions get considerably re-duced with the proposed method, making the system more robust to the fluctuating inputs. So we could demonstrate the advantages of using unimodal reliability information to find the best integra-tion weights for score level fusion.
6.2.2 Fusion With Separability Measures as Integration Weights. The inter/intra class separability measures are derived from the feature space of the two modalities. The inter/intra class
measures for voice modality(ρV)at different noise conditions
are obtained by artificially degrading the training samples with AWGN from 20 dB SNR to -10 dB SNR. The separability mea-sures thus obtained are used as the integration weights for fu-sion in the testing stage. The d-prime separability measures for various noise conditions (20 dB SNR to -10 dB SNR) are ob-tained from the genuine and impostor scores during the train-ing/validation stage using LOOCV strategy. Table 4 shows the d-prime statistic for the finger print (d0
F) and voice (d
0
V)
biomet-rics. We combined the separability measures from the feature space and the matching score space using sum rule, product rule and an adaptive approach as described in section 5.4. Table 5 shows the recognition accuracy of the method, with Separability Measures as Integration Weights (SMIW). To improve the global recognition rate of the multibiometric system, the scores ob-tained from the degraded modality are pre-processed using score normalization. Fingerprint similarity scores are preprocessed us-ing cohort normalization. To perform cohort normalization we divided the genuine scores with the maximum of the impostor scores. This transformation, increases the separability between the genuine and impostor scores, which in turn improves the overall performance of the biometric system. In order to im-prove the robustness of the noisy, voice modality the similarity scores are transformed using tanh normalization technique. We observed that better performance could be obtained by this multi-normalization technique. Table 5 shows the recognition accu-racy of the proposed method. (MNSMIW - Multi-normalization with Separability Measures as Integration Weights). Separabil-ity measures combined with sum and product rule shows similar performance in terms of accuracy, FAR and FRR. Further in-sight could be obtained from the DET plots (Fig. 1 and Fig. 9) and the score density plots (Fig. 7 and Fig. 10). The DET plot of Fig. 9 show that the proposed method considerably reduces the FAR and FRR and the score density plot of Fig. 10 show that the overlap between the genuine and the impostor score dis-tributions reduces with the multi-normalization and separability measures. Hence, the proposed score level fusion using separa-bility measures and score preprocessing techniques outperforms the baseline fusion technique under various noise conditions.
7. CONCLUSION
In the first part of this paper, an optimum reliability ratio based integration weight optimization scheme for fingerprint and voice modalities is proposed and implemented. The performance of the multibiometric system is evaluated under various noise conditions. By estimating the optimal integration weight using stochastic optimization strategies and LOOCV techniques, we could automate the process and make the system more robust to fluctuating inputs. This method effectively reduces FAR and hence it will be highly suitable for applications like sharing net-worked computer resources, granting access to nuclear facilities, performing remote financial transactions or boarding a commer-cial flight. One drawback of this method is that it gives attenu-ating fusion under extreme noise conditions. A new weighting strategy is proposed in the second part of this paper by
com-bining the separability measures from the feature space and the match score space. An efficient preprocessing on the raw vec-tor of scores using multi-normalization is employed, to improve the performance of the system. The proposed method is robust and could successfully eliminate the attenuating fusion even at low SNR conditions while reducing the FRR considerably. As the FRR is low, this method can be very effectively implemented in a multibiometric system for forensic applications like criminal investigation, parenthood determination etc.
8. REFERENCES
[1] G. Aggarwal, N.K. Ratha, R.M. Bolle, and R. Chellappa. Multi-biometric cohort analysis for biometric fusion. In
Acoustics, Speech and Signal Processing, 2008. ICASSP 2008. IEEE International Conference on, pages 5224– 5227. IEEE, 2008.
[2] Harbi Almahafzah and Maen Zaid Alrwashdeh. Article:
A survey of multibiometric systems. International
Jour-nal of Computer Applications, 43(15):36–43, April 2012. Published by Foundation of Computer Science, New York, USA.
[3] F. Alsaade, A. Ariyaeeinia, A. Malegaonkar, and S. Pillay. Qualitative fusion of normalised scores in multimodal
bio-metrics.Pattern Recognition Letters, 30(5):564–569, 2009.
[4] S.M. Anzar and P.S. Sathidevi. Optimization of integration weights for a multibiometric system with score level
fu-sion. InAdvances in Computing and Inform. Technology,
AISC 177, pages 833–842. Springer-Verlag Berlin Heidel-burg, 2012.
[5] M. Bendris, D. Charlet, and G. Chollet. Introduction of quality measures in audio-visual identity verification. In
Acoustics, Speech and Signal Processing, 2009. ICASSP 2009. IEEE International Conference on, pages 1913– 1916. IEEE, 2009.
[6] R. Bolle.Guide to biometrics. Springer-Verlag New York
Inc, 2004.
[7] L. Feng and L.K. Hansen. A new database for speaker
recognition. IMM, Informatik og Matematisk Modelling, DTU, 2005.
[8] A. Jain, K. Nandakumar, and A. Ross. Score
normaliza-tion in multimodal biometric systems.Pattern recognition,
38(12):2270–2285, 2005.
[9] AK Jain, L. Hong, and Y. Kulkarni. A multimodal
biomet-ric system using fingerprint, face and speech. In
Proceed-ings of 2nd Int’l Conference on Audio-and Video-based Biometric Person Authentication, Washington DC, pages 182–187, 1999.
[10] HB Kekre and VA Bharadi. Ageing adaptation for mul-timodal biometrics using adaptive feature set update
al-gorithm. InAdvance Computing Conference, 2009. IACC
2009. IEEE International, pages 535–540. IEEE, 2009. [11] K. Kryszczuk, J. Richiardi, P. Prodanov, and A. Drygajlo.
Reliability-based decision fusion in multimodal biometric
verification systems.EURASIP Journal on Applied Signal
Processing, 2007(1):74–74, 2007.
[12] J.S. Lee and C.H. Park. Robust audio-visual speech
recog-nition based on late integration.Multimedia, IEEE
Trans-actions on, 10(5):767–779, 2008.
[13] T.W. Lewis and D.M.W. Powers. Sensor fusion
weight-ing measures in audio-visual speech recognition. In
Pro-ceedings of the 27th Australasian conference on Computer science-Volume 26, pages 305–314. Australian Computer Society, Inc., 2004.
InPattern Recognition, 2002. Proceedings. 16th Interna-tional Conference on, volume 3, pages 811–814. IEEE, 2002.
[15] D. Maltoni, D. Maio, A.K. Jain, and S. Prabhakar.
Hand-book of fingerprint recognition. Springer-Verlag New York Inc, 2009.
[16] N. Poh and S. Bengio. Improving fusion with margin-derived confidence in biometric authentication tasks. In
Audio-and Video-Based Biometric Person Authentication, pages 347–356. Springer, 2005.
[17] Rajavel R. and Sathidevi P.S. A new GA optimised Relia-bility Ratio based integration weight estimation scheme for
decision fusion Audio-Visual Speech Recognition.
Interna-tional Journal of Signal and Imaging Systems Engineering, 4(2):123–131, 2011.
[18] Rajavel R. and Sathidevi P.S. Adaptive reliability measure and optimum integration weight for decision fusion
audio-visual speech recognition. Journal of Signal Processing
Systems, pages 1–11, 2011.
[19] D. Reynolds. Gaussian mixture models.Encyclopedia of
Biometric Recognition, 2008.
[20] A.A. Ross, K. Nandakumar, and A.K. Jain.Handbook of
multibiometrics, volume 6. Springer-Verlag New York Inc, 2006.
[21] S. Sarkar and P. Mohanty. Globally linear embedding of
biometric scores: An empirical study. InBiometrics:
The-ory, Applications and Systems, 2008. BTAS 2008. 2nd IEEE International Conference on, pages 1–6. IEEE, 2008. [22] S.Thangasamy and L.Latha. Article:efficient approach to
normalization of multimodal biometric scores.
Interna-tional Journal of Computer Applications, 32(10):57–64, October 2011. Published by Foundation of Computer Sci-ence, New York, USA.
[23] K.A. Toh. Fingerprint and speaker verification decisions
fu-sion. In Image Analysis and Processing, 2003.
Proceed-ings. 12th International Conference on, pages 626–631. IEEE, 2003.
[24] K.A. Toh and W.Y. Yau. Fingerprint and speaker
verifica-tion decisions fusion using a funcverifica-tional link network.
Sys-tems, Man, and Cybernetics, Part C: Applications and Re-views, IEEE Transactions on, 35(3):357–370, 2005. [25] F. Van der Heijden, R.P.W. Duin, D. De Ridder, and DMJ
Tax.Classification, parameter estimation and state
estima-tion. Wiley Online Library, 2004.
[26] Y. Wang, Y. Wang, and T. Tan. Combining fingerprint and voiceprint biometrics for identity verification: an
experi-mental comparison.Biometric Authentication, pages 289–
294, 2004.
[27] Wuzhili.Fingerprint Recognition. Honors Thesis, 2002.
[28] N. Yager and A. Amin. Fingerprint verification based on
minutiae features: a review. Pattern Analysis &