Performance Evaluation of Centralized Multicasting
Network over ICMP Ping Flood for DDoS
Ashish Kumar, Ajay K Sharma, Arun Singh
Dr. B R Ambedkar
National Institute of Technology, Jalandhar India
ABSTRACT
This paper evaluates the performance of Centralized multicasting network with two sources and four receivers, attacked by five attacker. Attackers attacked the source 1 in network by ICMP Ping Flood. Here we execute the simulation and draw network throughput between source 1 and source 2, queuing transmission delay and drop out data packets at source 1 for ping packet size of 16, 64 and 96 Bytes for 500, 1500 and 2500 ping packets per second. Simulation is done using Network Simulator (NS2) on Linux and the graphs are drawn using xgraph.
Keywords
PIM-DM, Drop Tail, DDoS, PING Flood, Data Multicasting, NS2
1.
INTRODUCTION
Multicasting is a widely used service in today’s computer networking system; it is mostly used in Streaming media, Internet television, video conferencing and net meeting etc. Routers involved in multicasting packets need a better management over stacking system of packets to be multicast. Quality of service (QOS) is also dependent on the availability of the system. It is a very critical issue for the growth of the society.
The ―availability‖ of services means that the information, the systems and the security controls are all accessible and operable in committed state at some random point of time [1].However, the inherent vulnerabilities [2] of the internet architecture provides opportunities for a lot of attacks on the services. Distributed denial-of-service (DDoS) attack is one of such kind which is a threat to the availability of the services. It reduces or completely disrupts services to legitimate users by expending communication and or computational resources of the target [2]. DDoS attacks are amplified form of DoS attacks where attackers direct hundreds or thousands of compromised hosts called zombies against single target [3, 4].
Ping flooding [5] is one of the kinds of DDoS attacks. ICMP ECHO_REQUEST message is send to host system to check the connectivity and it expects ECHO_REPLY. In ping flooding many systems is used to send multiple request to the target system. Ping Flood attacks attempt to saturate a network by sending a continuous series of ICMP echo requests (pings) over a high bandwidth connection to a target host on a lower-bandwidth connection to cause it to send back an ICMP echo reply for each request. Ping Flood attacks can slow down a network or even disable network connectivity [6].
Centralized multicast (CM) is a technique that separates control and data flow for Internet multicast routing. The control structure consists of root controllers at the highest
level and a gateway per domain at the next level. Routers are managed by control elements and are simply used for data forwarding [7]. All the data is forwarded to the core and then the core forwards the data to the members of the multicast group. The queuing algorithm used in simulation is Drop Tail. Drop Tail object, which implements First in First out (FIFO) scheduling and drop-on-overflow buffer management typical of most present day Internet routers [8].
2.
SYSTEM DESCRIPTION
2.1
Topology
Pl A network of six nodes is created and UDP protocol is used to send constant bit rate (CBR) packets. Bandwidth is 0.5Mbps between node (2 – 4), node (4 – 5), node (4 – 6) and node (5 – 6) , and all other connections have a bandwidth of 0.3Mbps, delay of 10ms; node 1 and node 2 is the data source and multicast protocol will be put into effect at 0.4s and 2s respectively in the two node; receiver nodes 3, 4, 5 and 6 will be effective at 0.6s, 1.3s, 1.6s, and 2.3s respectively; node 4 and node 3 will leave the group at 1.9s and 3.5s.
The node 1 and node 2 is the source node which refers to node 0 and node 1 in the topology and can be seen from the topology is as fig 1.Other nodes are marked as receivers, the topology is coded in ns2 TCL as,
# Topology Layout
$ns duplex-link $n(1) $n(2) 0.3Mb 10ms DropTail
$ns duplex-link $n(2) $n(3) 0.3Mb 10ms DropTail
$ns duplex-link $n(2) $n(4) 0.5Mb 10ms DropTail
$ns duplex-link $n(2) $n(5) 0.3Mb 10ms DropTail
$ns duplex-link $n(3) $n(4) 0.3Mb 10ms DropTail
$ns duplex-link $n(4) $n(5) 0.5Mb 10ms DropTail
$ns duplex-link $n(4) $n(6) 0.5Mb 10ms DropTail
$ns duplex-link $n(5) $n(6) 0.5Mb 10ms DropTail
#Group Activity
$ns at 0.6 "$n(3) join-group $rcvr $group"
$ns at 1.3 "$n(4) join-group $rcvr $group"
$ns at 1.6 "$n(5) join-group $rcvr $group"
$ns at 1.9 "$n(4) leave-group $rcvr $group"
$ns at 2.3 "$n(6) join-group $rcvr $group"
$ns at 3.5 "$n(3) leave-group $rcvr $group"
$ns duplex-link $n(4) $n(7) 0.5Mb 10ms DropTail
$ns duplex-link $n(7) $n(12) 0.5Mb 10ms DropTail
$ns duplex-link $n(7) $n(8) 0.5Mb 10ms DropTail
$ns duplex-link $n(7) $n(9) 0.5Mb 10ms DropTail
$ns duplex-link $n(7) $n(10) 0.5Mb 10ms DropTail
[image:2.595.53.289.161.427.2]$ns duplex-link $n(7) $n(11) 0.5Mb 10ms DropTai
Figure 1 Network Topology Design
2.2
Multicasting [9]
The basic principle of multicast routing is that routers must interact with each other to exchange information about neighbouring routers. In order to distribute the multicast data, the designated routers need to establish distribution trees and connect all of the members of a multicast group. The distribution trees specify the forwarding path from the source to each of the members of the multicast group. There are a number of different distribution trees, but the two most basic types are source specific trees and shared or centre specific trees.
Source specific trees find the shortest path from the source to the receivers. Source specific trees build multiple delivery trees, which emanate from the sub networks that are directly connected to the source.
Shared or centre specific trees use distribution centres and build a single tree that is shared by all members of a group. In the shared tree approach, multicast traffic is sent and received over the same path regardless of the sources of the data.
2.2.1 Multicast routing protocols
Multicast routing protocols facilitate the exchange of information between routers and are responsible for constructing distribution trees and forwarding multicast packets. There are a number of different routing protocols, but they generally follow one of two basic approaches— dense mode or sparse mode.
2.2.2 Dense mode protocols
Dense mode protocols are based on the assumption that there are a number of multicast group members densely distributed across a network. Because of this, these protocols periodically
flood the network with multicast traffic to establish and maintain the distribution tree. Dense mode protocols are best suited to environments where there are a number of hosts that want to or must receive the multicast data and the bandwidth to cope with the flooding of the network.
2.2.3 Sparse mode protocols
The sparse mode protocols are based on the assumption that group members wanting to receive multicast data are sparsely distributed across a network and that bandwidth is not necessarily widely available. Because the group members are spread sparsely throughout the network, flooding would waste bandwidth and could cause performance problems. Sparse mode protocols therefore are more selective about how they distribute multicast data. They start with empty distribution trees and only add branches when they receive join requests. Core Based Trees and Protocol Independent Multicast Sparse Mode (PIM-SM) are two of the more common sparse mode protocols.
2.3
Centralized Multicast
Centralized Multicast is a multicast routing protocol. It uses Rendezvous Point (RP) to control the multicasting centrally. It uses prune messages to prevent future messages from propagating to routers without group membership information, which is actually not simulated in ns2.
A Rendezvous Point rooted shared tree is built for a multicast group. A centralized multicast computation agent is used to compute the forwarding trees and set up multicast forwarding state. Data packets from senders to a group are unicast to the RP even if there is no receiver [8]. The method to start centralized multicast routing in simulation as done in NS2 TCL is,
#Selecting Multicast protocol set mproto CtrMcast
#Allocate Group Address set group [Node allocaddr]
#All Nodes will contain multicast protocol agents set mrthandle [$ns mrtproto $mproto]
#set the RPs
$mrthandle set_c_rp $n(2)
Node 2 is used a RP in the simulation environment.
The prune messages are used to notify the sender to prune of the node from sending the data. It has a life time set with it. Once the lifetime expires, multicast datagram will be forwarded again to the previously removed/pruned branches.
Graft messages are used when a new member for a group appears in a pruned area. The router sends a graft message toward the source for the group to turn the pruned branch back into a forwarding branch for multicast messages.
2.4
Queuing Method
discarding/dropping the packet until the queue has enough room for new packets.
2.5
DDoS Attack
Distributed denial of service (DDoS) [11] is a major threat to the availability of Internet services. The goal of a DDoS attack is to completely tie up the resources of a server, which prevents legitimate users from accessing the service [12] or providing legitimate service.
There are several types of attacks are there in DDoS, some of these [13]
1) SYN Attack:
A SYN flood attack occurs when a network becomes so overwhelmed by SYN packets initiating incomplete able connection request that it can no longer process legitimate connection requests, resulting in a denial of service (DoS).
2) ICMP Flood:
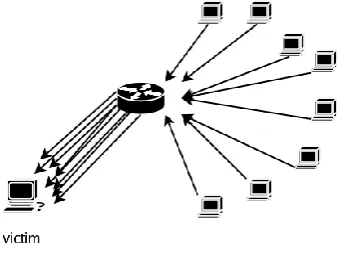
[image:3.595.318.539.212.407.2]An ICMP flood occurs when ICMP pings overload a system with so many echo requests that the system expends all its resources responding until it can no longer process valid network traffic. These packets request reply from the victim and this has as a result the saturation of the bandwidth of the victim’s network connection [14, 15]. When enabling the ICMP flood protection feature, administrators can set a threshold that once exceeded invokes the ICMP flood attack protection feature.
Figure 2 Ping Request flow
3) UDP Flood:
[image:3.595.64.270.401.488.2]Similar to the ICMP flood, UDP flooding occurs when UDP packets are sent with the purpose of slowing down the system to the point that it can no longer handle valid connections. After enabling the UDP flood protection feature, administrators can set a threshold that once exceeded invokes the UDP flood attack protection feature. (The default threshold value is 1000 packets per second.)
Figure 3 DDoS Attack
Figure 2 show the ping request flow in the network. ICMP echo request is sent by host a and ICMP echo reply is send by host b. Figure 3 depicts an attack situation where multiple systems are compromised to send attack traffic to a target host. In our work ICMP ping packets are used as attack traffic.
2.6
Attack Scenario for evaluation Purpose
We have used three different sizes of packet and different intensity i.e. rate of sending ping packets. The table 1 shows the varying packet size with number of ping packets.
Table 1 Intensity and size of ping packets
Scenario 1 Scenario 2 Scenario 3
500 pkt/sec
Pkt. Size: 16 bytes
1500 pkt/sec
Pkt. Size: 16 bytes
2500 pkt/sec
Pkt. Size: 16 bytes
500 pkt/sec
Pkt. Size: 64 bytes
1500 pkt/sec
Pkt. Size: 64 bytes
2500 pkt/sec
Pkt. Size: 64 bytes
2500 pkt/sec
Pkt. Size: 96 bytes
2500 pkt/sec
Pkt. Size: 96 bytes
2500 pkt/sec
Pkt. Size: 96 bytes
3.
SIMULATION RESULT
3.1
Without Attack Traffic
[image:3.595.326.554.495.626.2]Figure 4 shows the throughput graph of data packets when there is no attack on the network. The throughput gained is 0.3Mb/s which is the allocated rate of source 1.
Figure 4 Throughput for source 1
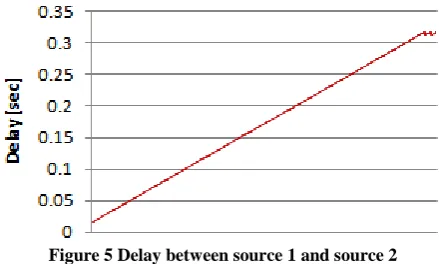
[image:3.595.87.257.614.742.2]Figure 5 Delay between source 1 and source 2
In case of no attack traffic there is no packet drop at source 1since the complete bandwidth is used to send the legitimate data.
3.2
With attack traffic
1) Throughput
[image:4.595.324.543.79.211.2]During a DDoS attack, attacking traffic fills the bottleneck link to drop most of the legitimate packets. In this explanation, we concentrate on the attack period which is started at 0.6s and stoped at 3.9s.
[image:4.595.326.548.313.453.2]Figure 6 shows the throughput at source 1 for data packets of size 16 byte, when source 1 is attacked by 500, 1500 and 2500 ping packets. The graph shows increase in throughput with decrease in number of attack packets at source 1. Maximum throughput achieved is 0.25576Mb/s for attack intensity of 500pkts/sec, whereas throughput is 0.19136Mb/s and 0.11224Mb/s for intensity of 1500pkts/sec and 2500pkts/sec, respectively. Simulation shows large throughput for less number of attack packets, as time passes this throughput becomes almost constant for 500 and 1500 number of attack packets but decreases drastically for 2500 number of attack packets which is 0.00368Mb/s.
[image:4.595.62.277.467.597.2]Figure 6 Throughput between source 1 and source2 at 16 bytes packet
Figure 7 shows the throughput at source 1 for data packets of size 64 byte, when source 1 is attacked by 500, 1500 and 2500 ping packets. The graph shows increase in throughput with decrease in number of attack packets at source 1. Throughput at attack intensity 1500pkts/sec and 2500pkts/sec is same throughout the simulation. Maximum throughput of 0.1564Mb/s is achieved with attack intensity of 500pkts/sec, whereas achieved throughput of 0.12328Mb/s with attack intensity of 1500pkts/sec and 2500pkts/sec. Simulation shows large throughput for less number of attack packets, as time passes this throughput decreases to 0.10304Mb/s for 1500 and 2500 number of attack packets.
Figure 7 Throughput between source 1 and source2 at 64bytes packet
Figure 8 shows the throughput at source 1 for data packets of size 96 byte, when source 1 is attacked by 500, 1500 and 2500 ping packets. Throughput at all attack intensity is same throughout the simulation. Maximum throughput achieved is 0.13984Mb/s with the all attack intensity whereas minimum is 0.11408Mb/s.
Figure 8 Throughput between source 1 and source2 at 96 bytes packet
2) Queuing Transmission Delay
Figure 9 shows queuing transmission delay of data packet transmission between source 1 and source 2 for 500, 1500 and 2500 number of attack packets at source 1. With different number of successfully forwarded packets average queuing transmission delay at attack intensity 500pkts/sec, 1500pkts/sec and 2500pkts/sec is 0.101435, 0.0585219 and 0.0407063 seconds respectively. This delay of transmission is always large for small number of attack packets. The delay of transmission decreases with increase in number of attack packets.
[image:4.595.324.533.613.741.2]Figure 10 shows queuing transmission delay of data packet transmission between source 1 and source 2 for 500 1500 and 2500 number of data packet attack at source 1. With different number of successfully forwarded packets average queuing transmission delay at attack intensity 500pkts/sec, 1500pkts/sec and 2500pkts/sec is 0.127702, 0.108601 and 0.108601 seconds respectively. The delay in transmission for attack intensity 1500 and 2500 packets per second is same as we can see from the graph below. This delay of transmission is always large for small number of attack packets.
Figure 10 Queuing transmission delay between source 1 and source2 at 64 bytes attack packets
Figure 11 shows queuing transmission delay of data packet transmission between source 1 and source 2 for 500 1500 and 2500 number of data packet attack at source 1. With same number of successfully forwarded packets average queuing transmission delay at attack intensity 500pkts/sec, 1500pkts/sec and 2500pkts/sec is 0.15441 seconds.
Figure 11 Queuing transmission delay between source 1 and source2 at 96bytes attack packet
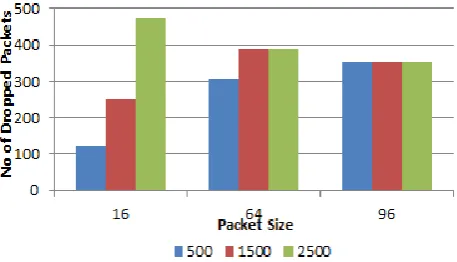
3) Drop Of Data Packets
Figure 12 shows the number of drop out packets at source 1. In the entire three situations the number of generated packets is 642. The table 2 shows the number of packets dropped at source 1 in the entire situation.
Table 2 Number of drop out packets at source 1 Packet size(bytes)
/Intensity(pkts/sec) 500 1500 2500
16 123 249 473
64 305 391 391
96 351 351 351
Figure 12 Drop of packets at source 1
4.
CONCLUSIONS
The results depicts that we got maximum throughput of 0.25576 Mb/s with data packet of size 16 Bytes with attacking intensity of 500 ping packets per second. This throughput decreases with increase in attack packet size and attacking intensity.
The maximum transmission delay of 0.15441 seconds is calculated for attack packet size of 96 Bytes with all attacking intensity. This delay will decrease with decrease in data packet size and increase in attacking intensity.
Drop out data packets are maximum for 16 Bytes at attacking intensity of 2500 ping packets per second. This drop of data packets increases with increase in attack packet size and becomes constant for all attack intensity for 96 bytes attack packets.
5.
REFERENCES
[1] Monika Sachdeva, Krishan Kumar, Gurvinder Singh, Kuldip Singh, ―Performance Analysis of Web Service under DDoS Attacks‖, 2009 IEEE International Advance Computing Conference (IACC 2009) Patiala, India, 6-7 March 2009.
[2] J. Mirkovic, D-WARD: Source-End Defense Against Distributed Denial-of-service Attacks, Ph.D. Thesis, University of California, Los Angeles, 2003.
[3] J. Mirkovic and P. Reiher, "A Taxonomy of DDoS Attack and DDoS Defense Mechanisms," ACM SIGCOMM Computer Communications Review, Volume 34, Issue 2, pp. 39-53, April, 2004.
[4] R.K.C. Chang, "Defending against Flooding-Based Distributed Denial-of-Service Attacks: A Tutorial," IEEE Communication Magazine, pp. 42-51, 2002.
[5] Ping Flooding, can be found at: http://tomicki.net/ping.flooding.php
[6] Ping Flood (ICMP Echo) Detection, Can be found at: http://www.daxnetworks.com/Technology/TechDost/TD-
101304-Ping%20Flood(ICMP%20Echo)%20Detection.pdf
[7] S.Keshav and S.Paul, ―Centralized Multicast‖, IEEE Network Protocols, 1999. (ICNP '99) Proceedings, 31 Oct.-3 Nov. 1999.
[image:5.595.63.274.192.336.2] [image:5.595.65.269.426.554.2][email protected], Editor, May 9, 2010, page no 73, Page no 267.
[9] Multicasting White paper ,Allied Telesis,Can be found at http://www.alliedtelesis.com/media/pdf/multicasting_wp. pdf
[10] Arash Dana and Ahmad Malekloo,―Performance Comparison between Active and Passive Queue Management‖ ,IJCSI International Journal of Computer Science Issues, Vol. 7, Issue 3, No5, May 2010
[11] Distributed Denial of Service (DDoS),can be found at http://www.cert.org/homeusers/ddos.html
[12] Shigang Chen, Member,IEEE, and Qingguo Song, (2005), Perimeter– based Defense against Bandwith DDoS Attacks, IEEE Transactions on parallel and Distributed systems, Vol.16,No.6, Digital Object Identifier: 10.1109/TPDS.2005.74.
[13] S.Gavaskar, R.Surendiran, Dr.E.Ramaraj, ―Three Counter Defense Mechanism for TCP SYN Flooding Attacks‖, International Journal of Computer Applications (0975 – 8887) Volume 6– No.6, September 2010.
[14] Christos Douligeris, Aikaterini Mitrokotsa, ―DDoS attacks and defense mechanisms: classification and state-of-the-art‖, Elsevier, Computer Networks 44 (2004) 643– 666.
[15] P.J. Criscuolo, Distributed Denial of Service Trin00, Tribe Flood Network, Tribe Flood Network 2000, and Stacheldraht CIAC-2319, Department of Energy Computer Incident Advisory (CIAC), UCRL-ID-136939, Rev. 1, Lawrence Livermore National Laboratory, February 14, 2000, Available from <http://ftp.se.kde.org/pub/security/csir/ciac/ciacdocs/ciac 2319.txt>.
6.
AUTHORS PROFILE
Ashish Kumar is an M.Tech. Student in computer science & engineering department of Dr. B R Ambedkar National Institute of Technology .He has completed his B.Tech. Degree in 2007 from Vivekananda Institute Of Technology Bangalore affiliated to Visvesvaraya Technological University (Belgaum). His research area is Computer Networks, Distributed System and Operating System.
Ajay k Sharma. received his BE in Electronics and Electrical Communication Engineering from Punjab University Chandigarh, India in 1986, MS in Electronics and Control from Birla Institute of Technology (BITS), Pilani in the year 1994 and PhD in Electronics Communication and Computer Engineering in the year 1999. His PhD thesis was on ―Studies on Broadband Optical Communication Systems and Networks‖. From 1986 to 1995 he worked with TTTI, DTE Chandigarh, Indian Railways New Delhi, SLIET Longowal and National Institute of technology (Erstwhile Regional Engineering College), Hamirpur HP at various academic and administrative positions. He has joined National Institute of Technology (Erstwhile Regional Engineering College) Jalandhar as Assistant Professor in the Department of Electronics and Communication Engineering in the year 1996. From November 2001, he has worked as Professor in the ECE department and presently he is working as Professor in Computer Science & Engineering in the same institute. His major areas of interest are broadband optical wireless communication systems and networks, dispersion compensation, fiber nonlinearities, optical soliton transmission, WDM systems and networks, Radio-over-Fiber (RoF) and wireless sensor networks and computer communication. He has published 237 research papers in the International/National Journals/Conferences and 12 books. He has supervised 12 Ph.D. and 36 M.Tech theses. He has completed two R&D projects funded by Government of India and one project is ongoing. Presently he was associated to implement the World Bank project of 209 Million for Technical Education Quality Improvement programme of the institute. He is technical reviewer of reputed international journals like: Optical Engineering, Optics letters, Optics Communication, Digital Signal Processing. He has been appointed as member of technical Committee on Telecom under International Association of Science and Technology Development (IASTD) Canada for the term 2004-2007 and he is Life member of Indian Society for Technical Education (I.S.T.E.), New Delhi..
![Figure 1 Network Topology Design Multicasting [9]](https://thumb-us.123doks.com/thumbv2/123dok_us/8126787.795720/2.595.53.289.161.427/figure-network-topology-design-multicasting.webp)