Munich Personal RePEc Archive
How Does Privatization Work in China?
Bai, Chong-En and Lu, Jiangyong and Tao, Zhigang
August 2007
Online at
https://mpra.ub.uni-muenchen.de/6599/
How Does Privatization Work in China?
Chong-En Bai
School of Economics and Management, Tsinghua University
Jiangyong Lu
Department of Business Strategy & Policy and Center for China in the World Economy, Tsinghua University
Zhigang Tao
School of Business, University of Hong Kong
August 2007
Abstract
Using a comprehensive panel data set of China’s state-owned enterprises, we investigate the impacts of privatization, of different time sequences and extent of non-state
ownership, on social welfare and firm performance. Attention has been focused on the sources of gain in firm performance and the long-run impacts of privatization. It is found that the privatization of China’s state-owned enterprises was achieved with limited compromise on social welfare responsibilities, and significant gain in firm performance was obtained by motivating the management and reducing agency cost at the
management level.
JEL classification codes: L21; L33; D21; P31
Keywords: Organizational Changes; Privatization; Social welfare responsibilities; Agency costs
Corresponding author: Chong-En Bai, Department of Economics, School of Economics
and Management, Tsinghua University, Beijing, 100084, China. Telephone: 86-10-62773183; fax: 86-10-62785562; email: [email protected].
Jiangyong Lu: Department of Business Strategy & Policy, and Center for China in the World Economy, Tsinghua University, Beijing, 100084, China. Telephone: 86-10-62792726; email: [email protected].
How Does Privatization Work in China?
AbstractUsing a comprehensive panel data set of China’s state-owned enterprises, we investigate the impacts of privatization, of different time sequences and extent of non-state
ownership, on social welfare and firm performance. Attention has been focused on the sources of gain in firm performance and the long-run impacts of privatization. It is found that the privatization of China’s state-owned enterprises was achieved with limited compromise on social welfare responsibilities, and significant gain in firm performance was obtained by motivating the management and reducing agency cost at the
management level.
1. Introduction
An issue of perennial research interest is why certain organizations persist over time
despite of their inefficiency. A case in point is China’s state-owned enterprises.
State-owned enterprises have poor financial performance as compared with China’s private
enterprises and foreign-invested enterprises operating in China.1 The existence of some of
these state-owned enterprises cannot be justified, even from a social welfare point of
view. Yet China’s state-owned enterprises are slow to undergo privatization.2 It is
understood that an organization, once in existence, will lead to the formation of various
interest groups, and any organizational change is resisted by those groups whose interests
would be adversely affected. Thus, the key to understanding organizational changes lies
in the proper delineation of relevant interest groups and analysis of their payoff changes
in the process of change.3 Using a comprehensive panel data set of Chinese enterprises,
we investigate how the interests of various parties affiliated with state-owned enterprises
are affected during the privatization process. It is found that privatization of China’s
state-owned enterprises was achieved with little compromise on social welfare
1 Indeed, studies have shown that reform and privatization of China’s state-owned enterprises have led to
significant improvements in efficiency and performance (Gordon and Li, 1995; Groves, Hong, McMillan, and Naughton, 1994, 1995; Li, 1997; Li and Xu, 2004; Zhang, Zhang, and Zhao, 2001). See Djankov and Murrell (2002) for a survey of enterprise restructuring in the transition economies, and Megginson and Netter (2001) for a survey of privatization in both developed and developing economies.
2 There are studies focusing on the incentives for the Chinese central and local governments to privatize its
state-owned enterprises (Bai, Lu, and Tao, 2005; Bai, Lu, and Tao, 2006; Guo and Yao, 2005; Li and Lui, 2004).
3 For a recent study on the role of interest parties for and against privatization in the telecom sector, see Li
responsibilities, and much gain in post-privatization firm performance was achieved by
motivating management and reducing the agency cost at the management level.
In general, an enterprise has various interest groups affiliated with it: suppliers, customers,
and governments. Suppliers (including those of labor services, management services,
capital inputs, and other inputs) would like the enterprise to pay higher prices for the
inputs, customers prefer the enterprise to set lower prices for the outputs, and the
governments seek to collect more taxes from the enterprise. However, the owners of the
enterprise are the key stakeholders, with an objective of profit maximization. They
manage the enterprise themselves or delegate the management to professionals. Any
agency cost arising from the separation of ownership and management, as in the case of
publicly held firms, could be dealt with through monitoring by the board members, proxy
fights by the shareholders, or corporate takeovers in the capital market. State-owned
enterprises in China are very much like the publicly held firms of the developed
economies in the sense that their ownership is widely held by all people in the society,
but the de facto control of the state-owned enterprises is held by the State Assets Agency
– the equivalent of a board of directors. What is different in China is that the owners (all
people in the society) do not have any direct authority in choosing the members of the
State Assets Agency and appointing the management of state-owned enterprises.4 The
State Assets Agency may have social welfare objectives other than profit maximization
(Bai, Li, Tao, and Wang, 2000), and the management appointed by the State Assets
Agency is neither motivated nor disciplined for profit maximization. So long as senior
management staff meets the social welfare objectives of the State Assets Agency, they
are free to pursue their personal interests, thereby resulting in severe agency costs.
Privatization of state-owned enterprises will lead to a change in payoffs for the suppliers,
customers, governments, and owners. In this paper, we use a panel data set of 15,496
enterprises from 1998 to 2003 to examine in detail how privatization of China’s
state-owned enterprises affects the interests of the concerned parties. All the firms in the
4 It is the ruling party of China – Chinese Communist Party – that decides on the membership of the State
sample were 100% state-owned in 1998, and 2,866 (18.50%) of them had privatization of
different degrees during the sample period. The data-set provides information on firm
operation, performance, and productivity. It also provides information on the social
welfare responsibilities of state-owned enterprises, such as size of employment, wages
and benefits per employee, prices of main products, and government taxes. Clearly, the
data is rich enough for us to measure how payoffs change for various interest groups
affiliated with China’s state-owned enterprises: customers, suppliers (employees and
management), and governments.
In this study, we look at the following indicators of firm performance and social welfare
responsibilities. There are: (1) social welfare indicators on labor (size of employment,
wage per employee, and welfare per employee), consumers (price index), and
governments (tax payments, inclusive and exclusive of value-added taxes), (2) indicators
on firm profitability and productivity (logarithm of total assets, logarithm of sales,
operating income to sales, operating income to total assets, operating income per
employee, and sales per employee), and (3) individual components of the operating
income to sales (profits from main products to sales, profits from other products to sales,
managerial expenses to sales, and financial expenses to sales).
Our results show that the extent of labor layoffs in China’s privatization is not as
significant as in many other countries (for example, Mexico, as studied by La Porta and
Lopez-de-Silanes, 1999). While those who lost their jobs are worse off in the
privatization process, those retained have actually benefited from higher wages and better
welfare. Regarding the impact of privatization on other social welfare objectives, we find
that price index decreases with the extent of privatization (i.e., consumers benefit from
the privatization) while there is no statistically significant change in tax payments. Both
firm profitability and productivity are found to increase in the percentage of non-state
ownership or the extent of privatization. In addition, much of the improvement in the
“operating income to sales” comes from the reduction in “managerial expenses to sales”
(53.85%) and the decrease in “financial expenses to sales” (35.91%). To conclude, our
limited compromise on social welfare responsibilities, and much of the improvement in
firm performance comes from the reduction in agency costs at the management level.
Anecdotal evidence does suggest that state-owned enterprises generally have bloated
management structure with an excessive amount of managerial expenses. This is because
the State Assets Agency has social welfare objectives, and so long as the management
meets those objectives, it is neither motivated nor disciplined for profit maximization.
Hence, the challenge for privatization of state-owned enterprises lies in transferring the
control of state-owned enterprises from the State Assets Agency to shareholders, and then
introducing incentive and/or disciplinary mechanisms for the management to pursue
profit maximization. Given that the size of employment decreased with the extent of
privatization, the other challenge for privatization of state-owned enterprises is to protect
the interests of those unlucky workers and maintain social stability (Bai, Li, Tao, and
Wang, 2000).
Unlike the former Soviet Union and the Eastern European countries, China has taken a
gradual approach to privatizing its state-owned enterprises. Therefore there might be
subsequent privatization after the initial (partial) privatization. Indeed in our sample there
are firms that underwent up to four rounds of partial privatization. It is therefore
important to know how well the first partial privatization works and if the subsequent
rounds of privatization add any value. It is also interesting to know if there is any
threshold level of non-state ownership (say, 50%) above which there will be significant
effects of privatization. We find that the first privatization has the largest impact on
profitability (operating income to total assets and operating income to sales) and
productivity (operating income per employee and sales per employee). The second
privatization still has some impact, but subsequent ones do not. The combined extent of
privatization in the first and second rounds could be either above or below 50%.
Consistently, we find that privatization – including privatization that reduced state
ownership below 50% and the one that kept state ownership more than 50% – has
significant impacts on firm profitability and productivity, though the former has stronger
An important indicator for the success of organizational changes such as the privatization
of China’s state-owned enterprises is sustained performance improvement in the long run.
Under-reporting financial performance prior to privatization does not lead to sustainable
success in the long run; nor do one-time government subsidies at the time of privatization
(Frydman, Gary, Hessel, and Rapaczynski, 1999; Song and Yao, 2004). To address this
concern, we look at the long-run performance of privatized firms, and find that there is
sustainable improvement in the profitability and productivity up to four years after the
privatization. Furthermore, the main source of sustained performance improvement
remains the reduction of managerial expenses. This suggests that once a state-owned
enterprise is privatized through either management buyout or by outside investors, there
emerge real (not nominal) and active shareholders who would put pressure on the State
Assets Agency, or the board of directors, to pursue profit maximization. Incentive and/or
disciplinary systems are then put in place to streamline and motivate the management,
which leads to sustainable performance improvement in the long run.
In establishing the impact of privatization on firm performance, we need to control for a
potential selection bias problem: that firms undergoing privatization may have some
unobserved characteristics explaining their superior post-privatization performance. As
China has taken a gradual and selective approach to privatizing its state-owned
enterprises (Cao, Qian, and Weingast, 1999), the selection bias problem is a serious
concern. To deal with this issue, we use the firm fixed-effect estimation method in case
there are unobserved firm-specific time-invariant factors influencing firm performance.
There could also be unobserved time-variant factors affecting firms that underwent
privatization differently than those that did not. To control for this possibility, we focus
on a sub-sample of 2,866 firms that all had privatization in the sample period (i.e., from
1999 to 2003), and compare the performance in the time period of 1998 to 2002 of those
enterprises privatized from 1999 to 2002 with those that did not have privatization until
2003. The firm fixed-effect model, together with the refinement of the sample, helps us to
The structure of the paper is as follows. In Section 2, we describe our sample of Chinese
state-owned enterprises, and offer some summary statistics. The method of econometric
analysis and the results are presented in Section 3. The paper concludes with Section 4.
2. Data
Our data is based on the annual surveys of manufacturing and mining firms conducted by
the National Bureau of Statistics of China from 1998 to 2003. These annual surveys
cover all state-owned enterprises, and those non-state-owned enterprises that had five
millions or more RMB (Chinese currency) annual sales. The number of enterprises
covered in the surveys varied from approximately 162,000 to approximately 196,000.5
The data contain enterprise identification information, and their operation and
performance information extracted from balance sheets and income statements.
We first use the enterprise identification code, uniquely assigned to each enterprise by the
National Bureau of Statistics of China, to search for those enterprises that appeared in
each year of the sample period (1998-2003) and come up with a balanced panel data-set
of 61,163 enterprises.6 As our objective is to understand how privatization works in
China, we focus on a sub-sample of enterprises that were 100% state-owned in 1998.7
Among the 61,163 enterprises in the balanced panel, 17,126 of them were 100%
state-owned in 1998. There are enterprises in which the state ownership first decreased from
100% and then went up during the sample period; after deleting these reversal cases the
5 The numbers of firms surveyed from 1998 to 2003 are, respectively, 164,981, 161,888, 162,755, 171,117,
181,428, and 196,222.
6 We use the panel data-set to examine whether subsequent privatization adds any value to the initial
privatization, and also investigate the long-run impacts of partial privatization.
7
sample size is reduced to 15,496.8 Among the 15,496 enterprises that were 100%
state-owned in 1998, 12,630 of them remained fully state-state-owned until 2003 and 2,866 of them
were privatized to various degrees by 2003.9
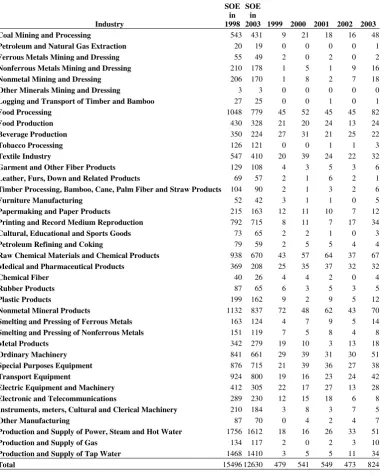
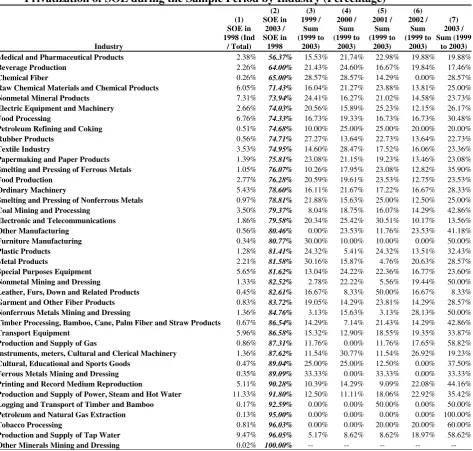
Our sample of 15,496 enterprises is highly comprehensive, as it covers all of the 39
mining and manufacturing industries and all of the 31 Chinese regions. For each industry,
Tables 1a and 1b show, respectively, the absolute number and percentage of first
privatization during the entire sample period. Medical and pharmaceutical products had
the highest percentage of first privatization (43.63%), followed by beverage production
(36%), chemical fiber (35%), raw chemical materials and chemical products (28.57%),
and nonmetal mineral products (26.06%). Other minerals mining and dressing was the
only industry that had no privatization at all during the sample period, followed by
production and supply of tap water (3.95%), tobacco processing (3.97%), petroleum and
natural gas extraction (5%), and logging and transport of timber and bamboo (7.41%).
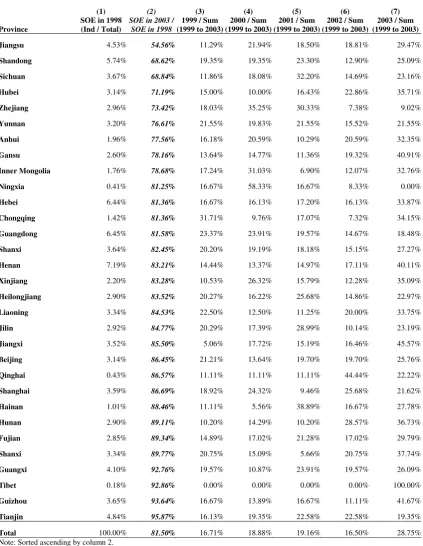
For each of the 31 Chinese regions, Tables 1c and 1d show, respectively, the absolute
number and percentage of first privatization during the sample period. Jiangsu province
had the highest percentage of first privatization (45.44%), followed by Shandong
(31.38%) and Sichuan (31.16%). Tianjin had the lowest percentage of first privatization
(4.13%), with Guizhou (6.36%) and Tibet (7.14%) being the second and third lowest of
the 31 Chinese regions.
Among the 15,496 enterprises that were 100% state-owned in 1998, 2,866 had (first-time)
privatization during the remaining sample period (i.e., 1999-2003). Four hundred
seventy-one of the 2,866 enterprises had a subsequent (second-time) privatization; 90 out
of the 471 enterprises had a third-time privatization; and finally, 13 out of the 90
8 The reversal cases are not considered, as the rationales for this type of organizational changes could be
quite different from those of gradual and increasing privatization.
9 Any decrease in state ownership is referred to as privatization. Here we do not further classify
enterprises had a fourth-time privatization. See Table 2 for details. Sixty-five percent of
the first privatizations was complete privatization (i.e., zero state-ownership), with the
corresponding numbers for the second, third and fourth privatization being 54%, 51%,
and 54%, respectively. Seventy-five percent of the first privatizations led to majority
control by non-state ownership (i.e., less than 50% state-ownership), with the
corresponding numbers for the second, third, and fourth privatization being 74%, 73%,
and 85%, respectively.
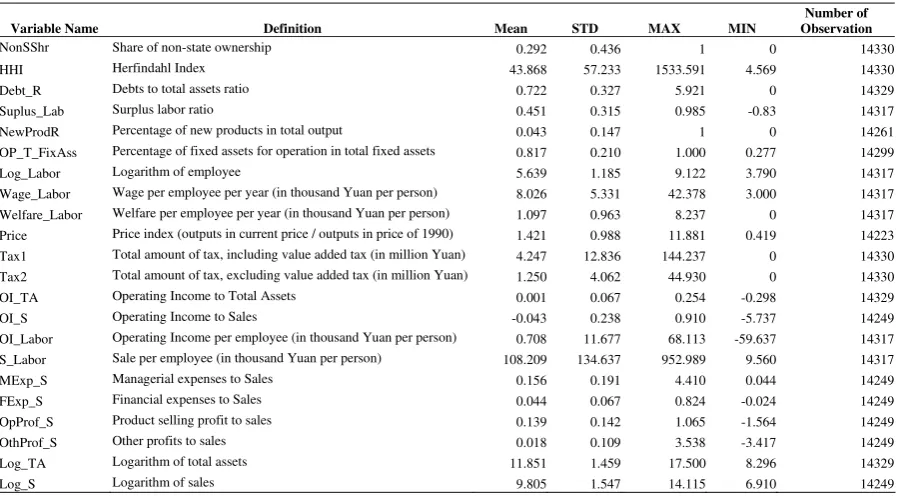
We examine the impact of privatization using two sets of indicators: one for social
welfare responsibilities and the other for firm performance. The set of indicators for
social welfare responsibilities measure the effects of privatization on labor (logarithm of
employment, wage per employee, and welfare per employee), consumers (price index),
and governments (tax payments), where price index is the ratio of current value of total
output to constant value (in 1990 price) of total output, and tax payments are those
inclusive of value-added taxes and those exclusive of value-added taxes.10 The set of
indicators for firm performance include: size of operation (logarithm of total assets, and
logarithm of sales), profitability (operating income to total assets and operating income to
sales), and productivity (operating income per employee and sales per employee). To
investigate further the sources for the increase in firm profitability, we decompose
operating income to sales into four components: profits from main products, profits from
other products, managerial expenses to sales, and financial expenses to sales.11
The definition of the above indicators on social welfare responsibilities and firm
performance is summarized in Table 3.
10 As value-added taxes tend to fluctuate with inventories across years, the tax payments both inclusive and
exclusive of the value-added taxes are used to measure the contributions made by the enterprises to government tax revenue.
11 Operating income is the sum of profits from main products and profits from other products, minus the
3. Econometric analysis
3.1. The impact of privatization on social welfare and firm profitability
To establish the exact effect of privatization on firm performance, we need to control for
the potential selection bias problem. China has taken a gradual and selective approach to
privatizing its state-owned enterprises. This raises the issue of whether the performance
change of privatized firms really comes from their ownership change or if it is due to
some unobserved features of those state-owned enterprises selected for privatization.12
Ideally, all aspects of privatized firms, both time-variant and time-invariant, need to be
taken into consideration before the residue in performance is assigned to the ownership
effect. In practice, we do not have the complete list of time-variant and time-invariant
variables, and we compensate that by using two estimation strategies. First, privatized
firms may have some unobserved firm-specific and time-invariant characteristics that
could explain their superior performance. To address this concern, we follow Frydman,
Gray, Hessel and Rapaczyski (1999) and Gupta (2005) by estimating firm fixed-effect
models that could account for those unobserved firm-specific and time-invariant
characteristics. Second, it is also possible that there are some time-variant characteristics
separating state-owned firms that were privatized from those that were not. To address
this concern, we restrict our sample to those state-owned enterprises that were privatized
from 1999 to 2003, and compare the performance of those that were privatized from 1999
to 2002 with those that didn’t get privatized until 2003, over the time period 1998-2002.
Presumably, state-owned enterprises that were privatized in later years may share some
time-variant characteristics with those privatized in earlier years, and therefore they are a
better comparison group than those never privatized in the sample period. To summarize,
we first estimate the following benchmark model using a sample of 2,866 enterprises that
were state-owned in 1998 but were privatized in the remaining sample period
(1999-2003).
12 Similarly, in deciding whether to privatize state-owned enterprises, China’s local and central
, 0 , 1 , 2 , ,
i t i t t i t i t j t i t
y =α α+ Year +α X +α NonSShr +α HHI +ε , (1)
where yi t, is the performance indicator of firm i in yeart, Xi t, is a set of time-variant
firm-specific factors that could explain the performance indicator, Yeartis a set of year
dummies capturing possible differences in the macroeconomic environment during the
sample period, HHIj t, is Herfindahl Index of 2-digit industry jin year t,
,
i t
NonSShr indicates the percentage of non-state ownership in year t, αicaptures
time-invariant firm-specific fixed effect, andεi t, is the error term.
All the performance indicators (yi t, ) considered in this study are listed in groups 1-3 of
Table 3, corresponding to the indicators on social welfare responsibilities, firm
performance, and individual components of the operating income to sales. The set of
time-variant firm-specific factors (Xi t, ) include: surplus labor ratio, debt equity ratio,
percentage of new products in total output, and percentage of fixed assets for operation in
total fixed assets. 13,14 The summary statistics ofyi t, ,Xi t, , NonSShri t, , andHHIj t, are
given in Table 3. Throughout the following analysis, we will focus on the impact of
non-state ownership (or its variations) on the performance indicators. The effects of Xi t,
andHHIj t, on the performance indicators will not be formally discussed.
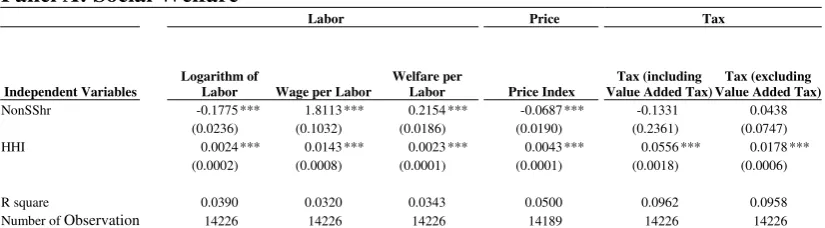
Table 4 summarizes the estimation results of the benchmark model (1). Panel A is about
the impact of privatization on the social welfare responsibilities of state-owned
enterprises. It is found that the size of employment decreases with the extent of
13 Surplus labor ratio is defined as the percentage of workers who would be laid off if the company were
operating at the industry-average level of sales per capita. It is equal to
i i i
S S
L ) L L
( − ∗ where Lior Siis firm
'
i s employment (or sales), and L (or S) is the industry-average employment (or sales) calculated at the 2-digit industry level using annual surveys on manufacturing firms of yeart; debt assets ratio equals total liabilities over total assets of firmiin yeart; new products ratio is the percentage of new products in total outputs. Under China’s statistical classification, a product is considered new if it is produced for the first time in an industry or a region, and such status is given only for the first four years of production.
14 In regressions on performance indicators which are relevant to labor, we exclude the surplus labor ratio
privatization (the percentage of non-state ownership), while both the wage per employee
and welfare per employee increase with the extent of privatization. Thus, concerning the
interests of workers, there are both winners (those retained) and losers (those laid off).
Price index is found to decrease with the extent of privatization, suggesting that
consumers are better off in the privatization process. This is in contrast to the result from
the literature that once privatized, former state-owned enterprises are no longer subject to
government regulations and hence tend to raise prices for their products and services (La
Porta and Lopez-de-Silanes, 1999). Besides the social welfare responsibilities to workers
and customers, state-owned enterprises are also expected to provide a significant share of
tax revenue for governments to undertake public-good projects. Studies have also
revealed that, even with the same tax rates, state-owned enterprises have much less
incentive to hide business activities and evade taxation than privately-owned companies
(Cai, Liu and Xiao, 2005). It is thus conjectured that the tax payments shall decrease with
the extent of privatization. However, our estimation results show that privatization has no
statistically significant effect on the tax payments, both inclusive and exclusive of
value-added taxes. To the extent that privatization leads to greater sales and higher operating
income, our results still lend support to the conjectured decrease in the tax payments.
Panel B is about the impact of privatization on firm performance. The logarithm of sales
increases with the extent of privatization, but the logarithm of total assets decreases with
the percentage of non-state ownership. Two measures of profitability, operating income
to sales and operating income to total assets, are increasing in the percentage of non-state
ownership, both with the 1% statistical significance. In addition, two measures of labor
productivity, operating income per employee and sales per employee, are also increasing
with the extent of privatization, again both with the 1% statistical significance. Taken
together, the results summarized in panels A and B reveal that privatized firms employ
fewer workers and work with fewer assets, but they manage to achieve higher sales and
operating income. Clearly, privatization leads to significant improvements in firm
For owners of the privatized firms, operating income to sales is one of the most important
measures of firm performance. To better understand the sources of gain in operating
income to sales, we examine its individual components: (1) profits from main products to
sales, (2) profits from other products to sales, (3) managerial expenses to sales, and (4)
financial expenses to sales. The operating income to sales is the sum of (1) and (2), minus
(3) and (4). As shown in Panel C, higher (post-privatization) operating income to sales
comes from lower managerial expenses to sales, lower financial expenses to sales, higher
profits from main products to sales, and lower profits from other products to sales, with
the first three being 1% statistically significant and the last one being 10% statistically
significant. More importantly, the reduction in the managerial expenses to sales and that
in the financial expenses to sales contributed, respectively, 53.85% and 35.91% of the
gain in the operating income to sales. In contrast, the profits from main and other
products to sales contributed a combined 10.24% of the gain in the operating income to
sales. These results reveal that much of the inefficiency of state-owned enterprises lies in
agency cost at the management level. China’s state-owned enterprises, though nominally
owned by all people in the society, are actually controlled by the State Assets Agency,
which has multiple social welfare objectives other than profit maximization and appoints
management to meet those objectives. The management of state-owned enterprises is
neither motivated nor disciplined to pursue profit maximization. Without legitimized
ownership to the cash flows of state-owned enterprises, the management cares more
about the size of the operation than the bottom line, and enjoys the perks accompanying
with the scale of the operation, resulting in severe agency cost at the management level.
With privatization, however, there emerge real (not nominal) and active shareholders,
who put pressure on the State Assets Agency or the board of directors to pursue profit
maximization and motivate management for that objective.
From the estimation results of benchmark model (1), we can conclude that privatization
of China’s state-owned enterprises was achieved with limited compromise on the social
welfare responsibilities, and much gain was obtained by motivating and monitoring
3.2. Partial privatization
China has taken a gradual approach to privatizing its state-owned enterprises. Initial
privatization tends to be partial in scope, and is often followed by subsequent
privatization. It is thus interesting to know how well the first (often partial) privatization
works in terms of its impact on social welfare and firm performance, or whether the
subsequent privatization adds any value to the first privatization. To investigate the
effects of initial and subsequent privatizations, we replace the percentage of non-state
ownership of model (1) – a key independent variable representing the extent of
privatization – by four indicator variables for the privatization sequence. The revised
econometric model is as follows:
, 0 , 1 _ , 2 _ , 3 _ , 4 _ , 5 , ,
i t i t t i t i t i t i t i t j t i t y = +α αYear+α X +αFirst priv +αSecond priv +αThird priv +αFourth priv +αHHI +ε
……….(2)
,
_ i t
First priv equals one for yeartand the years thereafter if firmiwas privatized in yeart
for the first time, and zero otherwise. Second_privi t,,Third_privi t,, andFourth_privi t, are defined similarly. Here, only four indicator variables are introduced because firms in our
sample went through at most four rounds of partial privatization.
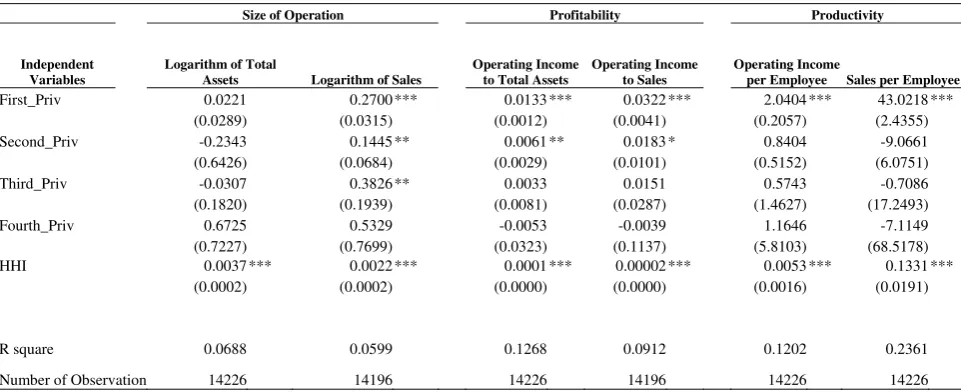
Table 5 summarizes the estimation results of model (2). The signs and statistical
significance of First_Priv in Table 5 are almost the same as those of the percentage of
non-state ownership in Table 4. Specifically, with the first privatization, (1) the size of
employment decreases, but both the wage per employee and welfare per employee
increase, (2) the logarithm of sales increases, (3) both the operating income to total assets
and the operating income to sales increase, (4) both operating income per employee and
sales per employee increase, and (5) much of the gain in the operating income to sales
comes from the reduction in the managerial expenses to sales and the reduction in the
The results on price index and the logarithm of total assets are no longer statistically
significant. The only different and statistically significant result is that the tax payments,
both inclusive and exclusive of the value-added taxes, actually increased after the first
privatization. Thus we can conclude that the first privatization works very effectively no
matter how partial it is. As for the benefits of subsequent privatization, we find that the
second-time privatization still adds value in terms of greater operation (logarithm of
sales), higher firm profitability (operating income to total assets and operating income to
sales) and higher firm productivity (operating income per employee). With the
second-time privatization, the size of employment reversed its decline and started to increase, but
the wage and welfare per employee continued to increase. The tax payments (both
inclusive and exclusive of value-added taxes) also continued to increase. Our results,
however, show that any further (third-time or fourth-time) privatization adds little value
in almost all performance indicators.
The results of the first and subsequent privatization seem to suggest that the scope of
privatization is not critically important in the case of China. One may argue, however,
that in our sample 75% of the state-owned enterprises undergoing the first privatization
were no longer state-controlled (i.e., less than 50% state ownership) and an additional
45% of the state-owned enterprises undergoing the second privatization were controlled
by non-state owners (see Table 2 for details). Thus the question of whether it is important
to have more than 50% non-state ownership in order to have any impact of privatization
must be addressed.15 To address this question, we replace the percentage of non-state
ownership in model (1) by two indicator variables about whether the state still has
majority control after the privatization. The modified estimation model is as follows:
, 0 , 1 _ , 2 _ , 3 , ,
i t i t t i t i t i t j t i t
y =α α+ Year +α X +α NonSShr Maj +α NonSShr Min +α HHI +ε
……….. (3),
15 Using data on telecom sector privatization around the world, Li and Xu (2004) found that only full
whereNonSShr_Maji t,equals 1 if non-state ownership in firmiis higher than fifty
percent in yeart and zero otherwise; NonSShr_Mini t, equals 1 if non-state ownership in
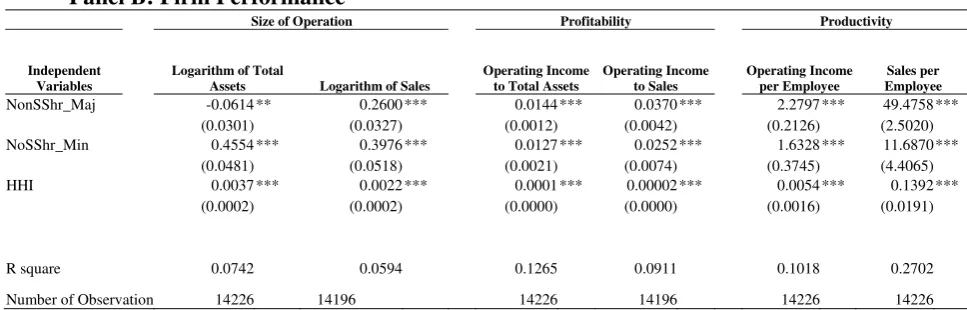
firmiis lower or equal to fifty percent in yeart and zero otherwise. As shown in Table 6,
firm profitability (measured by operating income to total assets and operating income to
sales) improves after the privatization, regardless of who has majority control; so do the
two measures of productivity (operating income per employee and sales per employee).
However, judging by the size of coefficients, privatization that resulted in majority
control by non-state owners has a bigger impact on firm profitability and productivity
than privatization with the state retaining more than 50% ownership. For privatization
with majority non-state ownership, much of the gain in the operating income to sales still
comes from the reduction of managerial expenses to sales, reduction of financial
expenses to sales, and profits from main products (in the decreasing order of importance);
but the reduction of managerial expenses to sales is no longer a major source of gain for
privatization with minority non-state ownership. On social welfare responsibilities, both
privatization with majority non-state ownership and that with minority non-state
ownership have positive impacts on the wage and welfare per employee. However, the
size of employment increased and the price index also increased under privatization with
minority non-state ownership, while both decreased under privatization with majority
non-state ownership. On the tax payments, only privatization with minority non-state
ownership has positive and statistically significant impact.
Taken together, our results on partial privatization (first versus subsequent privatization,
and privatization with the state retaining more than 50% ownership versus that with less
than 50% state ownership) suggest that, no matter how limited the scope of the
privatization is, it introduces real (not nominal) and active shareholders who put pressure
on the State Assets Agency or the board of directors to pursue profit maximization
instead of some social welfare objectives. Incentive systems are then put in place to
motivate management to streamline the management structure (i.e., reducing the agency
3.3. Long-run impact of privatization
The analysis in the previous two sections has found significant impact of privatization on
firm performance and social welfare responsibilities. The estimation models (1)-(3) used
in the analysis, however, impose a restriction of uniform impact of privatization (the
percentage of non-state ownership) across the sample period. There is anecdotal evidence
that state-owned enterprises tend to take actions of short-term and transitory effects, such
as under-reporting their financial performance prior to privatization or receiving large
one-off subsidies during the privatization process. However, the success of China’s
state-owned enterprises privatization hinges upon the sustained impact on firm performance
and social welfare responsibilities. To investigate the long-run impact of privatization, we
modify model (1) by replacing the percentage of non-state ownership by four interaction
terms between the percentages of non-state ownership with dummy variables indicating
the number of years after the initial privatization (Song and Yao, 2005). The revised
estimation model is as follows:
4
, 0 , 1 , ,
1
_ *
i t i t t i t k k t j t i t
k
y α αYear α X αYear AfterPriv NoSShr βHHI ε
=
= + + +
∑
+ +………. (4),
The year of initial privatization is defined as year 1 after privatization.
_
k
Year AfterPrivis equal to 1 for the year in which firmihas been privatized forkyears.
Since the earliest possible privatization in our sample occurred in 1999 and the time
period examined for firm performance and social welfare responsibilities runs from 1998
to 2002, the highest number of years after initial privatization (or subscript k) is 4. In
model (4), privatization is allowed to have differential impacts across the sample period.
Assume that a state-owned enterprise had a partial privatization of 10% non-state
ownership in 1999. Then the same percentage of non-state ownership (10%) could have
impact α1 on a performance indicator of year 1999, impact α2 on the performance
α4 on the performance indicator of year 2002. If the impact of non-state ownership on the
performance indicator decreases across the sample period (i.e., αk decreasing with respect
to k), then there is limited long-rum impact of privatization.
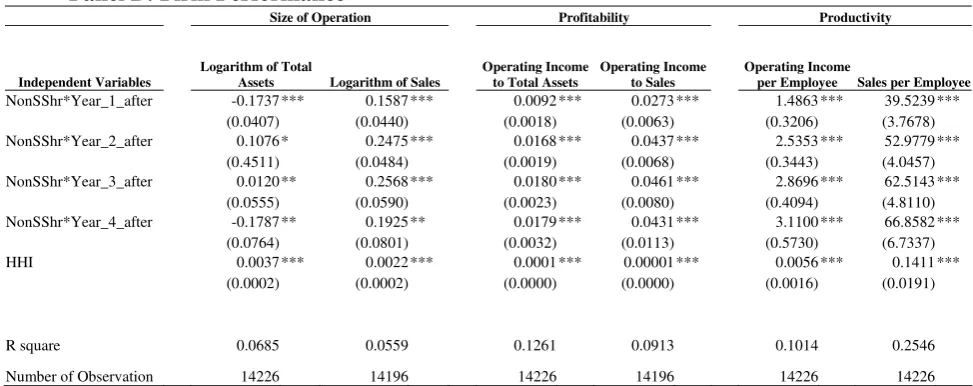
As shown in Table 7, the negative impact of non-state ownership on the size of
employment was steady and significant up to four years after the privatization, while the
positive effects of non-state ownership on the wage and welfare per employee increased
throughout the post-privatization period. The price index did not have any statistically
significant change in the first year of privatization, but then had a pronounced decrease
up to four years after the privatization. As in our benchmark case (model (1)), the impact
of non-state ownership on the tax payments was insignificant and remained so in the
post-privatization period.
The increase in firm profitability (operating income to total assets and operating income
to sales) was significant in the first two years after privatization, and then became steady.
Possibly due to the steady decrease in the size of employment, the improvement in firm
productivity (operating income per employee and sales per employee) was significant and
increasing throughout the post-privatization period. As in our benchmark case (model
(1)), much of the gain in the operating income to sales comes from the reduction in the
managerial expenses to sales and the reduction in the financial expenses to sales, not
from the increase in the profits from main products. More significantly, the decreases in
the managerial expenses to sales and in the financial expenses to sales were significant
and widening throughout the post-privatization period. In contrast, the increase in the
profits from main products was significant only up to two years after the privatization.
With a survey data of 218 privatized and state-owned enterprises in the Czech Republic,
Hungary and Poland, Frydman, Gary, Hessel and Rapaczynski (1999) found immediate
but no sustained impact of privatization. Based on a data-set of over 6,000 privatized and
state-owned enterprises in Bulgaria, the Czech Republic, Hungary, Poland, Romania, the
Slovak Republic and Slovenia, Claessens and Djankov (2002) found that the impacts of
privatization were small at the beginning but then grew over time. Song and Yao (2004)
sustained effects of privatization. Our analysis shows that there was both immediate and
sustained improvement in firm profitability and productivity throughout the
post-privatization period, and it lends strong support to the success of China’s state-owned
enterprises privatization.
4. Conclusion
Since China started its economic reform in the late 1970s, its economy has experienced
some of the most spectacular growth in its history. Much of China’s economic growth,
however, has been driven by its private enterprises, even though property rights
protection was not formally written into China’s constitution until March 2004, and
multinationals operating in China. State-owned enterprises have been losing their
competitive position in the market place, and yet the Chinese government has been slow
in privatizing those enterprises. It has been suggested that China’s state-owned
enterprises are maintained for serving various social welfare objectives (consumer
welfare, government tax revenue, and workers’ interests) rather than profit maximization.
China’s state-owned enterprises are theoretically owned by all people in the society, but
they are effectively controlled by the State Assets Agency, who has multiple social
welfare objectives. The management of a state-owned enterprise – appointed by the State
Assets Agency – needs to meet the social welfare objectives, but beyond that the
management is neither motivated nor disciplined to pursue profit maximization. Instead,
the management may pursue its private benefits from control – resulting in severe agency
cost. Thus privatization of China’s state-owned enterprises could well be resisted by the
various interest parties (social welfare groups and management) whose payoffs might be
adversely affected by the process.
With the objective of understanding why inefficient organizations such as China’s
state-owned enterprises may persist over time, we use a comprehensive panel data-set of 2,866
Chinese state-owned enterprises to investigate the impact of privatization on social
state-owned enterprises was achieved with limited compromise on the social welfare
responsibilities: (1) privatization had a negative impact on the size of employment, but
those employees who retained their jobs had their wage and welfare increased, (2) the
price index decreased with the extent of privatization, suggesting that consumers
benefited from the process, and (3) there was no statistically significant impact on the tax
payments, both inclusive and exclusive of the value-added taxes. We found that
privatization had a significant impact on firm performance: (1) logarithm of total assets
decreased but the logarithm of sales increased with the extent of privatization, (2) both
operating income to sales and operating income to total assets increased with the
percentage of non-state ownership, and (3) both operating income per employee and sales
per employee increased with the extent of privatization. The gain in the operating income
to sales – a key measure for firm performance – was found to come from, in order of
decreasing importance, (1) the decrease in the managerial expenses to sales, (2) the
decrease in the financial expenses to sales, and (3) the increase in profit from main and
other products. We also examined the robustness of our results to the sequence and extent
of privatization, and investigated if there was any sustained impact of privatization on
social welfare responsibilities and firm performance in the long run. Our analysis
suggests there are two obstacles in the privatization of China’s state-owned enterprises:
how to ensure the interests of those unlucky workers who were laid off in the
privatization process, and how to replace the management’s private benefit (managerial
expenses or agency cost) with incentive mechanisms that motivate the management to
Reference
Bai, C., D. Li, Z. Tao and Y. Wang (2000). "A Multitask Theory of State Enterprise Reform." Journal of Comparative Economics 28(4): 716-738.
Bai, C., J. Lu, and Z. Tao (2005). " Divergent Interests between Central and Local Governments: Testing Theories of Public Ownership." Working Paper, Hong Kong Institute of Economics and Business Strategy.
Bai, C., J. Lu, and Z. Tao (2006). “The Multitask Theory of State Enterprise Reform: Empirical Evidence from China.” American Economic Review Papers and Proceedings 96(2), 353-357.
Cai, H., Q. Liu and G. Xiao (2005). Does competition encourage unethical behavior? the case of corporate profit hiding in China. Working Paper.
Cao, Y., Y. Qian and B. Weingast (1999). "From federalism, Chinese style, to privatization, Chinese style." Economics of Transition 7(1): 103-131.
Claessens, S. and S. Djankov (2002). "Privatization benefits in Eastern Europe." Journal of Public Economics 83(3): 307-324.
Djankov, S. and P. Murrell (2002). "Enterprise restructuring in transition: a quantitative survey." Journal of Economic Literature 25(3): 739-792.
Frydman, R., C. Gary, M. Hessel and A. Rapaczynski (1999). "When Does Privatization Work? The Impact of Private ownership on Corporate Performance in the Transition Economies." Quarterly Journal of Economics 114(4): 1153-1191.
Gordon, R. H. and W. Li (1995). "The Change in Productivity of Chinese State Enterprises, 1983--1987." Journal of Productivity Analysis 6(1): 5-26.
Groves, T., Y. Hong, J. McMillan and B. Naughton (1994). "Autonomy and Incentives in Chinese State Enterprises." Quarterly Journal of Economics 109(1): 183-209.
Groves, T., Y. Hong, J. McMillan and B. Naughton (1995). "China's Evolving Managerial Labor Market." Journal of Political Economy 103(4): 873-892.
Guo, K. and Y. Yao (2005). "Causes of privatization in China-Testing several hypotheses." Economics of Transition 13(2): 211-238.
Gupta, N. (2005). "Partial Privatization and Firm Performance." Journal of Finance 60(2): 987-1015.
La Porta, R. and F. Lopez-de-Silanes (1999). "The Benefits of Privatization: Evidence from Mexico." Quarterly Journal of Economics 114(4): 1193-1242.
Li, D. D. and T. F. Lui (2004). Why Do Governments Dump State Enterprises? Evidence form China. Governance, Regulation, and Privatization in the Asia-Pacific Region. I. Takatoshi and A. O. Krueger, The University of Chicago Press. 12.
Li, H. and S. Rozelle (2000). "Saving or Stripping Rural Industry: an Analysis of Privatization and Efficiency in China." Agricultural Economics 23(3): 241-252.
Li, W. (1997). "The Impact of Economic Reforms on the Performance of Chinese State-Owned Enterprises." Journal of Political Economy 105(5): 1080-1106.
Li, W. and L. C. Xu (2002). "The Political Economy of Privatization and Competition: Cross-Country Evidence from the Telecommunications Sector." Journal of Comparative Economics 30: 439-462.
Li, W. and L. C. Xu (2004). "The Impact of Privatization and Competition in the
Telecommunications Sector around the World." Journal of Law & Economics 47(2): 395-430.
Megginson, W. L. and J. M. Netter (2001). "From State to Market: A Survey of Empirical Studies on Privatization." Journal of Economic Literature 39(2): 321-389.
Song, L. and Y. Yao (2004). Impacts of Privatization on Firm Performance in China. Working Paper.
Sun, Q. and W. H. S. Tong (2003). "China Share Issue Privatization: The Extent of Its Success." Journal of Financial Economics 70: 183-222.
Wang, X., L. C. Xu and T. Zhu (2004). "State-owned enterprises going public: The case of China." Economics of Transition 12(3): 467-487.
Table 1
Definition and Summary Statistics of Variables
This table reports annual summary statistics for state-owned enterprises used in econometric analyses for the period 1998-2002, including firms privatized between 1999 and 2002 and firms privatized in 2003. The number of firms is 2866. The maximum number of observations is 14330.
Variable Name Definition Mean STD MAX MIN
Number of Observation
Table 2A
Privatization of SOE during the Sample Period by Industry (Number of Firms)
Privatized for the first time in year
Industry
SOE in 1998
SOE in
2003 1999 2000 2001 2002 2003
Coal Mining and Processing 543 431 9 21 18 16 48
Petroleum and Natural Gas Extraction 20 19 0 0 0 0 1
Ferrous Metals Mining and Dressing 55 49 2 0 2 0 2
Nonferrous Metals Mining and Dressing 210 178 1 5 1 9 16
Nonmetal Mining and Dressing 206 170 1 8 2 7 18
Other Minerals Mining and Dressing 3 3 0 0 0 0 0
Logging and Transport of Timber and Bamboo 27 25 0 0 1 0 1
Food Processing 1048 779 45 52 45 45 82
Food Production 430 328 21 20 24 13 24
Beverage Production 350 224 27 31 21 25 22
Tobacco Processing 126 121 0 0 1 1 3
Textile Industry 547 410 20 39 24 22 32
Garment and Other Fiber Products 129 108 4 3 5 3 6
Leather, Furs, Down and Related Products 69 57 2 1 6 2 1
Timber Processing, Bamboo, Cane, Palm Fiber and Straw Products 104 90 2 1 3 2 6
Furniture Manufacturing 52 42 3 1 1 0 5
Papermaking and Paper Products 215 163 12 11 10 7 12
Printing and Record Medium Reproduction 792 715 8 11 7 17 34
Cultural, Educational and Sports Goods 73 65 2 2 1 0 3
Petroleum Refining and Coking 79 59 2 5 5 4 4
Raw Chemical Materials and Chemical Products 938 670 43 57 64 37 67
Medical and Pharmaceutical Products 369 208 25 35 37 32 32
Chemical Fiber 40 26 4 4 2 0 4
Rubber Products 87 65 6 3 5 3 5
Plastic Products 199 162 9 2 9 5 12
Nonmetal Mineral Products 1132 837 72 48 62 43 70
Smelting and Pressing of Ferrous Metals 163 124 4 7 9 5 14
Smelting and Pressing of Nonferrous Metals 151 119 7 5 8 4 8
Metal Products 342 279 19 10 3 13 18
Ordinary Machinery 841 661 29 39 31 30 51
Special Purposes Equipment 876 715 21 39 36 27 38
Transport Equipment 924 800 19 16 23 24 42
Electric Equipment and Machinery 412 305 22 17 27 13 28
Electronic and Telecommunications 289 230 12 15 18 6 8
Instruments, meters, Cultural and Clerical Machinery 210 184 3 8 3 7 5
Other Manufacturing 87 70 0 4 2 4 7
Production and Supply of Power, Steam and Hot Water 1756 1612 18 16 26 33 51
Production and Supply of Gas 134 117 2 0 2 3 10
Production and Supply of Tap Water 1468 1410 3 5 5 11 34
Table 2B
Privatization of SOE during the Sample Period by Industry (Percentage)
Industry (1) SOE in 1998 (Ind / Total) (2) SOE in 2003 / SOE in 1998 (3) 1999 / Sum (1999 to 2003) (4) 2000 / Sum (1999 to 2003) (5) 2001 / Sum (1999 to 2003) (6) 2002 / Sum (1999 to 2003) (7) 2003 / Sum (1999 to 2003)
Medical and Pharmaceutical Products 2.38% 56.37% 15.53% 21.74% 22.98% 19.88% 19.88%
Beverage Production 2.26% 64.00% 21.43% 24.60% 16.67% 19.84% 17.46%
Chemical Fiber 0.26% 65.00% 28.57% 28.57% 14.29% 0.00% 28.57%
Raw Chemical Materials and Chemical Products 6.05% 71.43% 16.04% 21.27% 23.88% 13.81% 25.00%
Nonmetal Mineral Products 7.31% 73.94% 24.41% 16.27% 21.02% 14.58% 23.73%
Electric Equipment and Machinery 2.66% 74.03% 20.56% 15.89% 25.23% 12.15% 26.17%
Food Processing 6.76% 74.33% 16.73% 19.33% 16.73% 16.73% 30.48%
Petroleum Refining and Coking 0.51% 74.68% 10.00% 25.00% 25.00% 20.00% 20.00%
Rubber Products 0.56% 74.71% 27.27% 13.64% 22.73% 13.64% 22.73%
Textile Industry 3.53% 74.95% 14.60% 28.47% 17.52% 16.06% 23.36%
Papermaking and Paper Products 1.39% 75.81% 23.08% 21.15% 19.23% 13.46% 23.08%
Smelting and Pressing of Ferrous Metals 1.05% 76.07% 10.26% 17.95% 23.08% 12.82% 35.90%
Food Production 2.77% 76.28% 20.59% 19.61% 23.53% 12.75% 23.53%
Ordinary Machinery 5.43% 78.60% 16.11% 21.67% 17.22% 16.67% 28.33%
Smelting and Pressing of Nonferrous Metals 0.97% 78.81% 21.88% 15.63% 25.00% 12.50% 25.00%
Coal Mining and Processing 3.50% 79.37% 8.04% 18.75% 16.07% 14.29% 42.86%
Electronic and Telecommunications 1.86% 79.58% 20.34% 25.42% 30.51% 10.17% 13.56%
Other Manufacturing 0.56% 80.46% 0.00% 23.53% 11.76% 23.53% 41.18%
Furniture Manufacturing 0.34% 80.77% 30.00% 10.00% 10.00% 0.00% 50.00%
Plastic Products 1.28% 81.41% 24.32% 5.41% 24.32% 13.51% 32.43%
Metal Products 2.21% 81.58% 30.16% 15.87% 4.76% 20.63% 28.57%
Special Purposes Equipment 5.65% 81.62% 13.04% 24.22% 22.36% 16.77% 23.60%
Nonmetal Mining and Dressing 1.33% 82.52% 2.78% 22.22% 5.56% 19.44% 50.00%
Leather, Furs, Down and Related Products 0.45% 82.61% 16.67% 8.33% 50.00% 16.67% 8.33%
Garment and Other Fiber Products 0.83% 83.72% 19.05% 14.29% 23.81% 14.29% 28.57%
Nonferrous Metals Mining and Dressing 1.36% 84.76% 3.13% 15.63% 3.13% 28.13% 50.00%
Timber Processing, Bamboo, Cane, Palm Fiber and Straw Products 0.67% 86.54% 14.29% 7.14% 21.43% 14.29% 42.86%
Transport Equipment 5.96% 86.58% 15.32% 12.90% 18.55% 19.35% 33.87%
Production and Supply of Gas 0.86% 87.31% 11.76% 0.00% 11.76% 17.65% 58.82%
Instruments, meters, Cultural and Clerical Machinery 1.36% 87.62% 11.54% 30.77% 11.54% 26.92% 19.23%
Cultural, Educational and Sports Goods 0.47% 89.04% 25.00% 25.00% 12.50% 0.00% 37.50%
Ferrous Metals Mining and Dressing 0.35% 89.09% 33.33% 0.00% 33.33% 0.00% 33.33%
Printing and Record Medium Reproduction 5.11% 90.28% 10.39% 14.29% 9.09% 22.08% 44.16%
Production and Supply of Power, Steam and Hot Water 11.33% 91.80% 12.50% 11.11% 18.06% 22.92% 35.42%
Logging and Transport of Timber and Bamboo 0.17% 92.59% 0.00% 0.00% 50.00% 0.00% 50.00%
Petroleum and Natural Gas Extraction 0.13% 95.00% 0.00% 0.00% 0.00% 0.00% 100.00%
Tobacco Processing 0.81% 96.03% 0.00% 0.00% 20.00% 20.00% 60.00%
Production and Supply of Tap Water 9.47% 96.05% 5.17% 8.62% 8.62% 18.97% 58.62%
Other Minerals Mining and Dressing 0.02% 100.00% -- -- -- -- --
Table 2C
Privatization of SOE during the Sample Period by Province (Number of Firms)
Privatized for the first time in year
Province
SOE in 1998
SOE in
2003 1999 2000 2001 2002 2003
Beijing 487 421 14 9 13 13 17
Tianjin 750 719 5 6 7 7 6
Hebei 998 812 31 30 32 30 63
Shanxi 564 465 20 19 18 15 27
Inner Mongolia 272 214 10 18 4 7 19
Liaoning 517 437 18 10 9 16 27
Jilin 453 384 14 12 20 7 16
Heilongjiang 449 375 15 12 19 11 17
Shanghai 556 482 14 18 7 19 16
Jiangsu 702 383 36 70 59 60 94
Zhejiang 459 337 22 43 37 9 11
Anhui 303 235 11 14 7 14 22
Fujian 441 394 7 8 10 8 14
Jiangxi 545 466 4 14 12 13 36
Shandong 889 610 54 54 65 36 70
Henan 1114 927 27 25 28 32 75
Hubei 486 346 21 14 23 32 50
Hunan 450 401 5 7 5 14 18
Guangdong 999 815 43 44 36 27 34
Guangxi 635 589 9 5 11 9 12
Hainan 156 138 2 1 7 3 5
Chongqing 220 179 13 4 7 3 14
Sichuan 568 391 21 32 57 26 41
Guizhou 566 530 6 5 6 4 15
Yunnan 496 380 25 23 25 18 25
Tibet 28 26 0 0 0 0 2
Shaanxi 518 465 11 8 3 11 20
Gansu 403 315 12 13 10 17 36
Qinghai 67 58 1 1 1 4 2
Ningxia 64 52 2 7 2 1 0
Xinjiang 341 284 6 15 9 7 20
Table 2D
Privatization of SOE during the Sample Period by Province (Percentage)
Province
(1) SOE in 1998 (Ind / Total)
(2) SOE in 2003 /
SOE in 1998
(3) 1999 / Sum (1999 to 2003)
(4) 2000 / Sum (1999 to 2003)
(5) 2001 / Sum (1999 to 2003)
(6) 2002 / Sum (1999 to 2003)
(7) 2003 / Sum (1999 to 2003)
Jiangsu 4.53% 54.56% 11.29% 21.94% 18.50% 18.81% 29.47%
Shandong 5.74% 68.62% 19.35% 19.35% 23.30% 12.90% 25.09%
Sichuan 3.67% 68.84% 11.86% 18.08% 32.20% 14.69% 23.16%
Hubei 3.14% 71.19% 15.00% 10.00% 16.43% 22.86% 35.71%
Zhejiang 2.96% 73.42% 18.03% 35.25% 30.33% 7.38% 9.02%
Yunnan 3.20% 76.61% 21.55% 19.83% 21.55% 15.52% 21.55%
Anhui 1.96% 77.56% 16.18% 20.59% 10.29% 20.59% 32.35%
Gansu 2.60% 78.16% 13.64% 14.77% 11.36% 19.32% 40.91%
Inner Mongolia 1.76% 78.68% 17.24% 31.03% 6.90% 12.07% 32.76%
Ningxia 0.41% 81.25% 16.67% 58.33% 16.67% 8.33% 0.00%
Hebei 6.44% 81.36% 16.67% 16.13% 17.20% 16.13% 33.87%
Chongqing 1.42% 81.36% 31.71% 9.76% 17.07% 7.32% 34.15%
Guangdong 6.45% 81.58% 23.37% 23.91% 19.57% 14.67% 18.48%
Shanxi 3.64% 82.45% 20.20% 19.19% 18.18% 15.15% 27.27%
Henan 7.19% 83.21% 14.44% 13.37% 14.97% 17.11% 40.11%
Xinjiang 2.20% 83.28% 10.53% 26.32% 15.79% 12.28% 35.09%
Heilongjiang 2.90% 83.52% 20.27% 16.22% 25.68% 14.86% 22.97%
Liaoning 3.34% 84.53% 22.50% 12.50% 11.25% 20.00% 33.75%
Jilin 2.92% 84.77% 20.29% 17.39% 28.99% 10.14% 23.19%
Jiangxi 3.52% 85.50% 5.06% 17.72% 15.19% 16.46% 45.57%
Beijing 3.14% 86.45% 21.21% 13.64% 19.70% 19.70% 25.76%
Qinghai 0.43% 86.57% 11.11% 11.11% 11.11% 44.44% 22.22%
Shanghai 3.59% 86.69% 18.92% 24.32% 9.46% 25.68% 21.62%
Hainan 1.01% 88.46% 11.11% 5.56% 38.89% 16.67% 27.78%
Hunan 2.90% 89.11% 10.20% 14.29% 10.20% 28.57% 36.73%
Fujian 2.85% 89.34% 14.89% 17.02% 21.28% 17.02% 29.79%
Shanxi 3.34% 89.77% 20.75% 15.09% 5.66% 20.75% 37.74%
Guangxi 4.10% 92.76% 19.57% 10.87% 23.91% 19.57% 26.09%
Tibet 0.18% 92.86% 0.00% 0.00% 0.00% 0.00% 100.00%
Guizhou 3.65% 93.64% 16.67% 13.89% 16.67% 11.11% 41.67%
Tianjin 4.84% 95.87% 16.13% 19.35% 22.58% 22.58% 19.35%
Total 100.00% 81.50% 16.71% 18.88% 19.16% 16.50% 28.75%
Table 3
Sequence of Privatization and Share of State Ownership during the Sample Period
Panel A: First-time Privatization
Year of Privatization
Type of Change in State Ownership 1999 2000 2001 2002 2003 Total
All_100%→0% 297 343 356 315 557 1868
All_100%→0%<50% 51 65 62 41 69 288
All_100%→50%=<100% 131 133 131 117 198 710
Total 479 541 549 473 824 2866
Panel B: Second-time Privatization
Year of Privatization
Type of Change in State Ownership 1999 2000 2001 2002 2003 Total
0%<50%→0% 15 28 30 24 97
0%<50%→0%<50% 10 8 8 11 37
50%=<100%→0% 25 36 39 57 157
50%=<100%→0%<50% 14 18 12 13 57
50%=<100%→50%=<100% 19 27 41 36 123
Total 83 117 130 141 471
Panel C: Third-time Privatization
Year of Privatization
Type of Change in State Ownership 1999 2000 2001 2002 2003 Total
0%<50%→0% 7 6 11 24
0%<50%→0%<50% 7 5 4 16
50%=<100%→0% 5 7 10 22
50%=<100%→0%<50% 0 2 2 4
50%=<100%→50%=<100% 2 9 13 24
Total 21 29 40 90
Panel D: Fourth-time Privatization
Year of Privatization
Type of Change in State Ownership 1999 2000 2001 2002 2003 Total
0%<50%→0% 3 2 5
0%<50%→0%<50% 1 2 3
50%=<100%→0% 0 2 2
50%=<100%→0%<50% 0 1 1
50%=<100%→50%=<100% 0 2 2
Table 4
The Impact of Non-state Ownership
This table summarizes the estimation results of model (1).
Panel A: Social Welfare
Labor Price Tax
Independent Variables
Logarithm of
Labor Wage per Labor
Welfare per
Labor Price Index
Tax (including Value Added Tax)
Tax (excluding Value Added Tax)
NonSShr -0.1775 *** 1.8113 *** 0.2154 *** -0.0687 *** -0.1331 0.0438
(0.0236) (0.1032) (0.0186) (0.0190) (0.2361) (0.0747)
HHI 0.0024 *** 0.0143 *** 0.0023 *** 0.0043 *** 0.0556 *** 0.0178 *** (0.0002) (0.0008) (0.0001) (0.0001) (0.0018) (0.0006)
R square 0.0390 0.0320 0.0343 0.0500 0.0962 0.0958 Number of Observation 14226 14226 14226 14189 14226 14226
Note: ***, **, and * represent significant at 1%, 5%, and 10% percentage, respectively.
Panel B: Firm Performance
Size of Operation Profitability Productivity
Independent Variables Logarithm of Total Assets Logarithm of Sales Operating Income to Total
Assets
Operating Income to Sales
Operating Income
per Employee Sales per Employee
NonSShr -0.1437 *** 0.2069 *** 0.0144 *** 0.0381 *** 2.2801 *** 51.5037 *** (0.0306) (0.0331) (0.0012) (0.0043) (0.2175) (2.5566) HHI 0.0037 *** 0.0022 *** 0.0001 *** 0.0000 *** 0.0055 *** 0.1403 ***
(0.0002) (0.0002) (0.0000) (0.0000) (0.0016) (0.0191) R square 0.0684 0.0557 0.1252 0.0909 0.1286 0.3164 Number of Observation 14226 14196 14226 14196 14226 14196
Note: ***, **, and * represent significant at 1%, 5%, and 10% percentage, respectively.
Panel C: Decomposition of Operating Income to Sales
Independent Variables Managerial Expenses to Sales Financial Expenses to Sales Products Selling Profits to Sales
Other Profits to Sales
NonSShr -0.0205 *** -0.0137 *** 0.0093 *** -0.0054 ** (0.0036) (0.0012) (0.0028) (0.0020) HHI 0.0003 *** 0.0000 *** 0.0002 *** 0.0001 ***
(0.0000) (0.0000) (0.0000) (0.0000)
R square 0.0456 0.0995 0.0240 0.0068 Number of Observation 14196 14196 14196 14196
Percentage in overall change of operating income to sales
NonSShr 53.85% 35.91% 24.32% -14.08%
Table 5
The Impact of Initial and Subsequent Privatization
This table summarizes the estimation results of model (2).
Panel A: Social Welfare
Labor Price Tax
Independent Variables
Logarithm of
Labor Wage per Labor
Welfare per
Labor Price Index
Tax (including Value Added Tax)
Tax (excluding Value Added Tax)
First_Priv -0.0815 ** 1.7270 *** 0.2124 *** -0.0243 0.5898 ** 0.2331 ** (0.0236) (0.0947) (0.0175) (0.0180) (0.2230) (0.0706) Second_Priv 0.0975 * 0.6959 ** 0.1255 ** -0.0021 1.6848 ** 0.6546 ***
(0.0553) (0.2439) (0.0439) (0.0449) (0.5584) (0.1767) Third_Priv 0.0679 -0.9768 -0.0937 0.2118 * -0.4789 -0.0492
(0.1245) (0.6925) (0.1248) (0.1275) (1.5856) (0.5016) Fourth_Priv 0.4121 -0.8967 -0.2346 -0.0237 -0.5377 1.9267 (0.5946) (2.7509) (0.4957) (0.5065) (6.2984) (1.9924) HHI 0.0024 *** 0.0141 *** 0.0022 *** 0.0043 *** 0.0558 *** 0.0179 ***
(0.0002) (0.0008) (0.0001) (0.0001) (0.0018) (0.0006)
R square 0.0334 0.0405 0.0392 0.0095 0.0976 0.0982
Number of Observation 14226 14226 14226 14189 14226 14226 Note: ***, **, and * represent significant at 1%, 5%, and 10% percentage, respectively.
Panel B: Firm Performance
Size of Operation Profitability Productivity
Independent Variables
Logarithm of Total
Assets Logarithm of Sales
Operating Income to Total Assets
Operating Income to Sales
Operating Income
per Employee Sales per Employee
First_Priv 0.0221 0.2700 *** 0.0133 *** 0.0322 *** 2.0404 *** 43.0218 *** (0.0289) (0.0315) (0.0012) (0.0041) (0.2057) (2.4355)
Second_Priv -0.2343 0.1445 ** 0.0061 ** 0.0183 * 0.8404 -9.0661
(0.6426) (0.0684) (0.0029) (0.0101) (0.5152) (6.0751)
Third_Priv -0.0307 0.3826 ** 0.0033 0.0151 0.5743 -0.7086
(0.1820) (0.1939) (0.0081) (0.0287) (1.4627) (17.2493)
Fourth_Priv 0.6725 0.5329 -0.0053 -0.0039 1.1646 -7.1149
(0.7227) (0.7699) (0.0323) (0.1137) (5.8103) (68.5178) HHI 0.0037 *** 0.0022 *** 0.0001 *** 0.00002 *** 0.0053 *** 0.1331 ***
(0.0002) (0.0002) (0.0000) (0.0000) (0.0016) (0.0191)
R square 0.0688 0.0599 0.1268 0.0912 0.1202 0.2361
Panel C: Decomposition of Operating Income to Sales
Independent
Variables
Managerial Expenses to
Sales
Financial Expenses to
Sales
Products Selling Profits
to Sales
Other Profits to Sales
First_Priv -0.0127 *** -0.0125 *** 0.0106 *** -0.0036 * (0.0034) (0.0012) (0.0026) (0.0019) Second_Priv -0.0079 -0.0012 0.0083 0.0009 (0.0085) (0.0029) (0.0066) (0.0048) Third_Priv -0.0169 0.0059 0.0104 -0.0065 (0.0240) (0.0083) (0.0186) (0.0136) Fourth_Priv -0.0033 -0.0052 -0.0492 0.0368 (0.0952) (0.0329) (0.0738) (0.0538) HHI 0.0003 *** 0.00004 *** 0.0002 *** 0.0001 ***
(0.0000) (0.0000) (0.0000) (0.0000)
R square 0.0447 0.0998 0.0250 0.0066