THE RELIABILITY AND THE APPLICABILITY OF
THE RESIDUAL INCOME-BASED VALUATION MODEL:
Theoretical Augmentation of the Linear Information Dynamics Model and its Validity Compared with Ohlson (1995) and Edwards-Bell-Ohlson Approaches
Thesis Submitted to Lancaster University in Fulfilment of the Requirements for the Degree o f Doctor of Philosophy in Accounting and Finance
by
YOUNG-SOO CHOI
B.A. in Business Administration (Sogang University, Korea),
MSc in Management Science (Korea Advanced Institute o f Science and Technology)
DEPARTMENT OF ACCOUNTING AND FINANCE THE MANAGEMENT SCHOOL
LANCASTER UNIVERSITY
All rights r e se r v e d INFORMATION TO ALL USERS
The q u a lity of this r e p r o d u c tio n is d e p e n d e n t u p o n the q u a lity of the c o p y s u b m itte d . In the unlikely e v e n t that the a u th o r did not sen d a c o m p l e t e m a n u scrip t
and there are m issing p a g e s , th e se will be n o t e d . Also, if m a teria l had to be r e m o v e d , a n o t e will in d ic a te the d e le t io n .
uest
P ro Q u est 11003605
Published by ProQ uest LLC(2018). C o p y rig h t of the Dissertation is held by the Author.
All rights r eserv ed .
This work is p r o te c te d a g a in s t u n a u th o riz ed c o p y in g under Title 17, United S ta tes C o d e M icroform Edition © ProQ uest LLC.
ProQ uest LLC.
7 8 9 East Eisenhow er Parkway P.O. Box 1346
To my dearest
THE RESIDUAL INCOME-BASED VALUATION MODEL: Theoretical Augmentation of the Linear Information Dynamics Model and its Validity Compared with Ohlson (1995) and Edwards-Bell-Ohlson Approaches
Young-Soo Choi B.A., MSc
Thesis Submitted to Lancaster University in Fulfilment of the Requirements for the Degree of Doctor of Philosophy in Accounting and Finance
September 2002
ABSTRACT
Following the seminal theoretical works of Ohlson (1995) and Feltham and Ohlson (1995, 1996), many researchers have tried to investigate the linear information dynamics (LID) model's validity empirically. However, empirical applications of the LID approach to residual income-based equity valuation, such as Dechow, Hutton and Sloan (1999) (DHS) and Myers (1999b), have produced estimates of firm value that are substantially lower on average than corresponding observed market values.
DHS's results that show the quite large downward bias of the value estimates based on Ohlson (1995), together with the work of Myers (1999b) that includes the RI intercept term in the pricing model, motivate me to augment the Ohlson model in order to capture the impact of the intercept terms on the residual income forecasts and firm values. I argue that the large negative bias in LID-based value estimates might be attributable to failure to deal fully with the effects of conservative accounting in projecting residual income. I term the augmented model, which incorporates residual income (RI) and 'other information' (01) intercepts into the linear information dynamics, as the 'intercept- inclusive' LID model. I also show that the Feltham and Ohlson (1995) LID model as well as the Ohlson (1995) LID model are special cases of the 'intercept-inclusive' LID model.
models: the Ohlson (1995) LID-type and the EBO-type valuation models. Using U.S. (Chapter 4) and U.K. (Chapter 6) data, I show that use of a LID that impounds the effects of conservative accounting, as reflected in analyst forecast-based residual income projections, produces value estimates that are substantially less biased than those extant Rl-based models. The thesis also addresses a potentially important issue of the different applicability under different conditions of different Rl-based valuation models in Chapter 7. This is based on the idea that the models' relative applicability can differ across various firm-specific characteristics and properties, because the implementation procedures and underlying assumptions of competing models are apparently different. Among some firm-specific ex-ante variables, eamings-to-price ratio, market-to-book ratio and analyst-based one-year ahead RI forecast-to-book ratio seem to be influential with regard to the applicability of models.
ABSTRACT i
CONTENTS iii
ABBREVATION AND NOTATION viii
LIST OF FIGURES xii
LIST OF TABLES xiii
LIST OF APPENDICES xv
ACKNOWLEDGEMENT xvi
DECLARATION xvii
CHAPTERS
1. INTRODUCTION 2
1.1. Introduction 2
1.2. Structure of the Thesis 8
2. LITERATURE REVIEW 13
2.1. Development of the Residual Income Valuation (RIV) Model 13
2.2. Empirical Content of the RIV Model 17
2.2.1. Usefulness of the RIV model 17
2.2.2. Information dynamics of the LID model 18
2.2.3. Other information in the LID model 21
2.2.4. Persistence parameters of the LID model 24
2.3. Recent Empirical Research on the RIV Model 26
2.3.1. LID approach 26
Dechow, Hutton and Sloan (1999) 26
M yers (1999b) 28
Hand and Landsman (1998, 1999) 30
2.3.2. EBO approach 31
Frankel and Lee (1998) 31
Lee, Myers and Swaminathan (1999) 32
2.4. Analysts' Earnings Forecasts 35 2.4.1. Usefulness of analysts' earnings forecasts in accounting research 35
2.4.2. Attributes of analysts' earnings forecasts 38
Evidence o f optimism 38
Determinants o f optimism 39
Revisions 40
Decline in optimism 41
2.5. Conclusions 42
Appendices 44
3. DEVELOPMENT OF THE 'INTERCEPT-INCLUSIVE' LINEAR INFORMATION DYNAMICS (LID) MODEL AND RESEARCH
DESIGN 46
3.1. Development of the 'Intercept-inclusive' LED Model 46
3.1.1. The potential need to allow for intercepts in LID models 46 3.1.2. The derivation of the 'intercept-inclusive' LED model 48 3.1.3. Implications for valuation biases reported by DHS 51 3.1.4. Special cases of the 'intercept-inclusive' LED model 53
3.2. Empirical Implementation Procedure 55
3.2.1. DHS procedure 55
3.2.2. My procedure 58
3.2.3. Special cases 63
3.2.4. Some EBO models 65
3.2.5. Pricing test of competing valuation models 67
Tables 69
Appendices 72
4. RELIABILITY OF THE 'INTERCEPT-INCLUSIVE' LINEAR
INFOMRATION DYNAMICS (LID) MODEL: U.S. EVIDENCE 82
4.1. Introduction and Motivation 82
4.2. Empirical methodology and Data 85
4.2.1. Methodology 85
4.3.1. Scaling by stock price 93
4.3.2. Scaling by book value 94
4.3.3. Effects of winsorising and trimming 100
4.4. Conclusions 102
Figures 104
Tables 106
5. U.K. DATA AND VARIABLES 116
5.1. Earnings Measures 116
5.1.1. Earnings before exceptional and extraordinary items (XI) 117 5.1.2. Full-tax adjusted earnings before exceptional and extraordinary
items (X2) 118
5.1.3. Earnings after exceptional and extraordinary items (X3) 119 5.1.4. Earnings after exceptional items, but before extraordinary items
(X4) 120
5.1.5. Other candidates for earnings measures 121
5.1.6.1/B/E/S earnings forecasts 123
5.2. Other Variables and Definitions 124
5.3. Data Collation and Sample Selection 128
5.4. Descriptive Statistics 132
Tables 136
Appendices 142
6. RELIABILITY OF COMPETING VALUATION MODELS: U.K.
EVIDNECE 160
6.1. Introduction and Motivation 160
6.2. Research Questions and Research Design 164
6.2.1. Research questions 164
Estimation o f LID parameters 164
Pricing test 166
Effects o f abnormal items on R I persistence parameters 169
Estimation o f conditional firm-specific co 170
Estimation o f O I and its persistence 172
6.3. Replication of Dechow, Hutton & Sloan (1999) - scaled by stock price 173
6.3.1. Estimation of ooand y 173
Pooled co with one lag 173
Pooled co with fo u r lags 176
Pooled co with book value 176
Firm-specific co 178
Estimation o f y 179
6.3.2. Reliability of alternative value estimates 180
6.4. Reliability of Competing Valuation Models - scaled by book value 182
6.4.1. Estimation of cdand y 182
6.4.2. Reliability of alternative value estimates 184
6.5. S ensitivity Test 188
6.5.1. S ensitivity to book value growth rate 189
6.5.2. Sensitivity to residual income growth rate 190
6.5.3. Sensitivity to discount rate 192
6.5.4. Sensitivity to benchmarking stock price 194
6.5.5. Sensitivity to consensus earnings forecasts 195
6.6. Conclusions 195
Figures 198
Tables 201
Appendices 233
7. APPLICABILITY OF COMPETING VALUATION MODELS: U.K.
EVIDENCE 235
7.1. Introduction and Motivation 235
7.2. Predictions about the Applicability of Models 242
7.2.1. Differences in competing models 242
'Historical' vs. 'Forecast' 243
'Unbiased' vs. 'Biased' (Accounting Conservatism) 245
M odel and Earnings Attributes Fit 249
M odel and Conservatism Fit 250
M odel and Growth Fit 253
M odel and Size Fit 254
M odel and Forecasted Profitability Fit 255
M odel and Industry Fit 25 6
7.3. Constructing Portfolios and Descriptive Statistics 258
Earnings-to-Price (E/P) ratio 258
Market-to-Book (P/B) ratio 259
R& D-to-Book (RD/B) ratio 259
Book value growth (BG) 260
Other variables 260
7.4. Empirical Results 261
7.4.1. Applicability of alternative valuation models 261
Across E/P 262
Across P/B 265
Across RD/B 267
Across BG 267
Across firm size 268
Across FRI/B 269
Across technology innovation and industry sectors 270
7.4.2. Determinants of valuation errors 271
7.5. Conclusions 274
Figures 277
Tables 285
Appendices 302
8. CONCLUSIONS AND IMPLICATIONS 307
8.1. Introduction 307
8.2. Summary of the Empirical Results 309
8.3. Implications and Limitations 312
ABBREVATION AND NOTATION AEX AFE AR(«) ARR bt K i bg BG BIN CA CASH CGD CL CSR CSV d t DEP DHS div DS E,[] EBD EBO E/P EXC
all abnormal items (i.e., exceptional items plus extraordinary items) absolute forecast error (AFEsp: absolute forecast error of stock price,
AFEri: absolute forecast error of residual income)
nth order auto-regression accounting rates of return
book value of equity at year t
i-year ahead expected book value of equity at year t
book value growth rate
one plus book value growth rate
'basic industries' sector classified by FTSE (level 3)
current assets
cash and cash equivalents
'cyclical consumer goods' sector classified by FTSE (level 3) current liabilities
clean surplus relation
'cyclical services' sector classified by FTSE (level 3)
net dividends at year t
depreciation and amortization expense Dechow, Hutton and Sloan (1999) dividend payout ratio
Datastream item
expectation operator conditional on the year t information earnings, book value and dividend (model)
Edwards-Bell-Ohlson (model) eamings-to-price ratio
f t+i
Ah
FCF FE
FRI/B
GIN S r
IIMR IMT ind
LID LMV Ltg
MBE M OI M RI MV
NCG NS
NSV
OA 01
z-year ahead analysts' earnings forecasts at year t
analyst-based /-year ahead residual income forecasts at year t discounted free cash flow (model)
signed forecast error (FEsp : signed forecast error of stock price) analyst-based one-year ahead residual income forecast-to-book ratio
'general industries' sector classified by FTSE (level 3) residual income growth rate
Institute of Investment Management and Research
'information technology' sector classified by FTSE (level 3) industry-specific residual income persistence measure
linear information dynamics
logarithm of market value (used as a proxy for firm size) long-term earnings growth estimate
meeting or beating earnings expectations mean 'other information'
mean residual income market value
'non-cyclical consumer goods' sector classified by FTSE (level 3) the number of ordinary shares in issue (adjusted for subsequent capital actions)
'non-cyclical services' sector classified by FTSE (level 3)
p, stock price of equity at year t p c , n
r t observed stock price at n months after the end o f the fiscal year t
P/B market-to-book ratio
PV present value
PVED present value of expected dividend (model)
q l magnitude of residual income
q2 magnitude of exceptional items (or special items in DHS)
q3 magnitude of extraordinary items (or operating accruals in DHS) q4 magnitude of all abnormal items
q5 magnitude of operating accruals
r discount rate
R one plus discount rate (r)
RD research and development expenditures RD/B R&D-to-book ratio
RI residual income
RIV residual income valuation (model)
ROA return on asset
ROE return on equity
r ° e t+i /-year ahead expected return on equity at year t RSR 'resources' sector classified by FTSE (level 3)
S scaling variable
SA full-tax adjustments after SSAP 15 sg growth rate of scaling variable
SG one plus growth rate of scaling variable
SGP sequential generating process (of future residual income)
s m o i e mean of scaled 'other information' used as an explanatory variable
s m r i d mean of scaled residual income used as a dependent variable
s m r i e mean of scaled residual income used as an explanatory variable
TA total assets
TP income taxes payable
TV terminal value
UTL 'utilities’ sector classified by FTSE (level 3)
Vt intrinsic value of equity at year t
x t earnings for the period (t-1, t)
x at residual income for the period (t-\, t)
XI earnings before exceptional and extraordinary items
X2 full-tax adjusted earnings before exceptional and extraordinary items X3 earnings after exceptional and extraordinary items
X4 earnings after exceptional items, but before extraordinary items
y 'other information' parameter in the linear information dynamics y 0 'other information' intercept parameter
y x 'other information' persistence parameter s, e unpredictable, zero mean disturbance term
v, 'other information' at year t about future residual income not in current residual income
a) residual income parameter in the linear information dynamics co0 residual income intercept parameter (in most cases)
cox residual income persistence parameter (in most cases)
A (hat) symbol indicating a parameter estimate
LIST OF FIGURES
Figure Page
4.1. Distribution of valuation errors arising from 3 different models 104 4.2. The effect of conservatism on the 'intercept-inclusive' LID-based
value estimates: pooled vs. separate (by M/B) parameter estimation 105
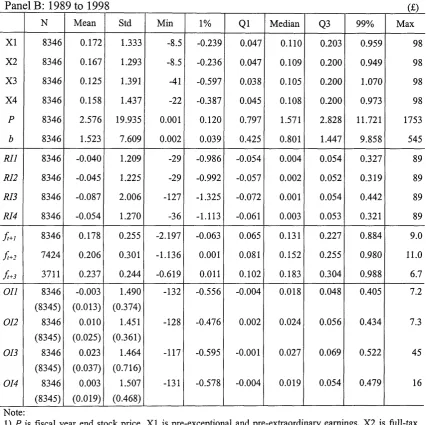
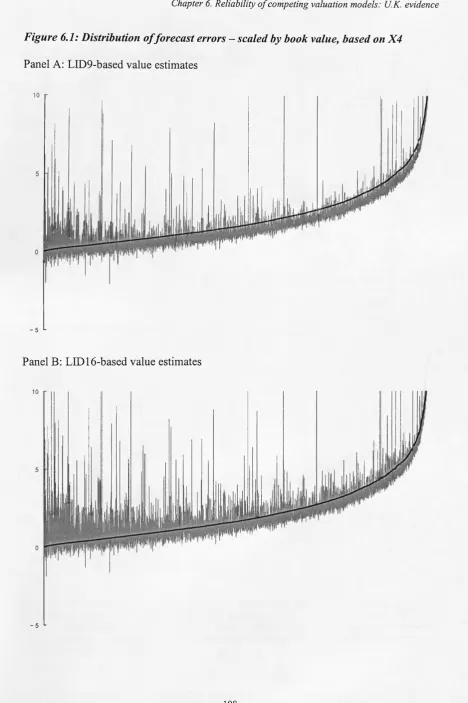
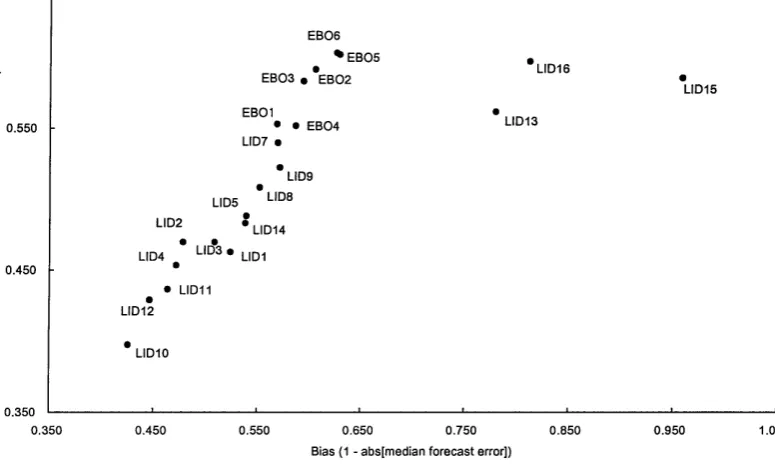
6.1. Distribution of forecast errors - scaled by book value, based on X4 198 6.2. Reliability of value estimates - scaled by book value, based on X4 200
7.1. Example of possible differences between value estimates arising from
the adoption of different RIV models 277
Table page
3.1. The competing valuation models 69
4.1. Number of available firm-years 106
4.2. Descriptive statistics 107
4.3. Bias and accuracy - scaled by stock price, r = 12% (as in DHS) 108 4.4. LID parameter estimates - scaled by book value, using pooled data 109
4.5. Bias and accuracy - scaled by book value 110
4.6. The effect of conservatism on bias and accuracy 111
4.7. The effect o f trimming extreme FE (AFE) values on bias (accuracy) 112 4.8. The effect of trimming / winsorising on parameter estimation 113 4.9. The effect of trimming / winsorising on bias and accuracy 114
5.1. Example of inconsistency in Datastream's post-SS AP 15 adjustment 136
5.2. Four earnings definitions and Datastream items 136
5.3. U.K. Gross Redemption Yield on 20 year Gilts (%) 137
5.4. Other variables and definitions 137
5.5. Number of firms and firm-year observations 138
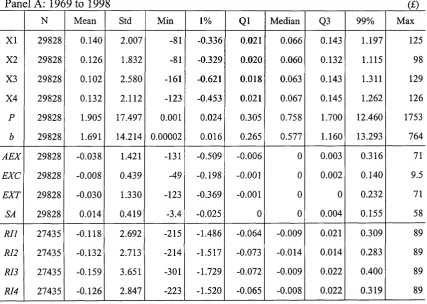
5.6. Descriptive statistics (raw variables in per-share form) 139
5.7. Descriptive statistics (ratios) - based on X4 141
6.1. Unconditional cowith one lag - scaled by stock price 201
6.2. Effects of abnormal items - scaled by stock price 202
6.3. Pooled unconditional cowith four lags - scaled by stock price 203 6.4. Pooled unconditional cowith book value - scaled by stock price 204 6.5. Firm-specific conditional co (cof ) - scaled by stock price 205
6.6. Unconditional y- scaled by stock price 207
6.7. Residual income forecasting ability - scaled by stock price 208
6.8. Reliability test - scaled by stock price 209
213 215 217 219 224
225 226
229
232
285 289 293 294 298 300 Firm-specific conditional co(cof ) - scaled by book value
Unconditional y - scaled by book value
Parameters under the restriction of co\ and/or y\ - scaled by book value Reliability test - scaled by book value
Sensitivity to book value growth rate - scaled by book value, based on X4 Sensitivity to residual income growth rate - scaled by book value,
based on X4
Sensitivity to discount rate - scaled by book value, based on X4 Sensitivity to benchmarking stock price - scaled by book value, based on X4
Sensitivity to consensus earnings forecasts - scaled by book value, based on X4
Absolute valuation errors based on the pooled sample Descriptive statistics of portfolios
Correlation between firm-specific ex-ante variables
Appendix Page
2.1. Derivation of Eq. 7 44
3.1. Derivation of the 'intercept-inclusive' LID model when regression 72 variables are scaled
3.2. Rearrangement of Eq. 3 to isolate mean RI and 01 terms 74 3.3. The 'intercept-inclusive' LID model when regression variables are
unsealed 78
5.1. Extracts from Datastream manual 142
5.2. The development o f U.K. income reporting standards 144
5.3. Examples of the relationship between four earnings measures and
the published figure 145
5.4. Examples of Datastream errors 152
5.5. SSAP 15 (Accounting for deferred tax) 153
5.6. Relations and differences between 4 earnings measures 154
5.7. Median ROA for year in the U.K. 156
5.8. Distribution of firm-year observations 157
6.1. The practical issue of estimating RI parameters when 01 is dealt with 233
ACKNOWLEDGEMENT
This thesis has benefited from many people's guidance and support that I must acknowledge in all sincerity. I am especially indebted to my supervisors, Prof. John O'Hanlon, Prof. Peter Pope and Prof. Ken Peasnell for their expert guidance. The initial inspiration behind this thesis was from Prof. Peasnell, who supervised me for the first one year. Unfortunately, I was not able to take advantage of his supervision longer for his personal reasons. I most sincerely thank Prof. O'Hanlon and Prof. Pope for their helpful comments and suggestions for the last 4 years. Without their continual support and encouragement, the thesis would be incomplete. It is really my luck to have these expert supervisors. I also truly appreciate the support provided by all staff and faculty members o f the Department o f Accounting and Finance, Lancaster University.
I would like to give special thanks to Dr. Steve Lin and my all PhD colleagues: Dr. Jose Moreira, Dr. Ashni Singh, Dr. Fatima Abdul Hamid, Dr. Vasileios Zisis, Dr. Shy Kuo Wong, Victoria Wang, Nelson Areal, Aldonio Ferreira, Imaru Arias Ramirez, Han Lin, Guilermo Benavides, Abed Abdallah, Helena Liu, Suning Shen, Helena Isidro, Eddy Pong and Jeffrey Wang for their friendship and willingness to help.
I also acknowledge the helpful comments of Prof. Jim Ohlson, Prof. Patricia Dechow, Prof. Peter Easton and participants at conferences at Lancaster University, University of Valencia and London Business School for a working paper (with John O'Hanlon and Peter Pope) based on Chapter 4. I also appreciate I/B/E/S International Inc. for providing analyst earnings forecast data.
I hereby declare that this thesis is my own work, and has not been submitted in substantially the same form for the award of a higher degree elsewhere.
CHAPTER 1. INTRODUCTION
1.1. Introduction 2
INTRODUCTION
1.1. Introduction
Recently, much empirical literature has emerged on the residual income valuation (RIV) model. From these empirical studies, value estimates based on the RIV model seem to be superior to traditional value estimates (i.e., those based on earnings, dividends, book value or free cash flows). In fact, it is very attractive that we can value a firm using tractable accounting information. Especially, if current residual income and current book value can capture much of the market's expectations as Ohlson's (1995) simple model suggests, it must be a breakthrough in accounting and finance.
Ohlson's (1995) accounting-based valuation model has been received enthusiastically by many researchers. The Ohlson model is based on the RTV relationship and the residual income (abnormal earnings) linear information dynamics (LID). The RTV relationship is just a restatement of the dividend discounting model, and it has been 're-discovered' regularly by academics. Thus, strictly speaking, the RTV relationship per se is not Ohlson's contribution.1 Ohlson's original contribution is the information dynamics, which includes a modified AR(1) residual income generating process. This information dynamics is still controversial among researchers empirically.
Chapter 1. Introduction
Recent studies have assessed the empirical validity of the RIV relationship and of Ohlson's development of the relationship (Dechow, Hutton and Sloan, 1999; Hand and Landsman, 1998; Hand and Landsman, 1999; Frankel and Lee, 1998; Myers, 1999a; Myers, 1999b; Lee, Myers and Swaminathan, 1999; Francis, Olsson and Oswald, 2000). The approach used in Frankel and Lee (1998), Myers (1999a), Lee et al. (1999), and Francis et al. (2000) is to estimate future residual income from analysts' earnings forecasts, and to use these forecasts together with assumptions about terminal value to estimate firm value.2 This is often called the Edwards-Bell-Ohlson (EBO) valuation approach. Dechow et al. (1999) (hereafter DHS) and Myers (1999b) specifically focus on the information dynamics, with its persistence parameters, which are central to Ohlson's development of the RIV relationship. The persistence parameters are not only the most difficult to estimate practically, but also the most crucial part of the Ohlson model in order to measure a firm's value. Actually, the Ohlson model's ability to summarize the present value of future residual income in terms of observable accounting variables and 'other information' follows directly from the linear information dynamics (Pope and Wang, 1999). On the other hand, Hand and Landsman (1998, 1999) test the Ohlson model without estimating persistence parameters, and compare the sign of regression coefficients with the theoretically predicted sign of them.
This research is motivated by this growing literature, particularly by the work of DHS and Myers (1999b), and addresses and develops the issues raised by these studies. Even though both empirical tests using U.S. data do not firmly support the validity of the
Ohlson model, they contribute to the empirical implementation of the RIV model in terms of the estimation of persistence parameters and the comparison of alternative models' forecasting ability for contemporaneous stock prices.
DHS estimate the persistence parameters of residual income (RI) and 'other information (01)' first, and compare the relative forecasting ability of alternative models for explaining contemporaneous stock prices. They use pooled time-series and cross- sectional regression analysis to estimate RI and 01 persistence parameters. Following a suggestion in Ohlson (2001), DHS estimate unobservable 01 from observable analysts' earnings forecasts. The definition of 01 using observable analysts' earnings forecasts gives a very important contribution to the practical implementation of the LID-based valuation models.3
DHS's results are generally supportive of Ohlson's information dynamics, but suggest that the application of those dynamics to equity pricing provides only minor improvements over traditional and much simpler valuation models that capitalise short term earnings forecasts in perpetuity. That is, Ohlson's general model is outperformed in terms of explanation of contemporaneous stock prices by a special case of the model involving the capitalisation of analysts' forecasts in perpetuity. Moreover, there are inconsistencies between the predictive ability for future residual income of assumed residual income generating processes and the ability of pricing models based on those generating processes to explain contemporaneous stock prices.
Chapter 1. Introduction
DHS's result that show the quite large downward bias of the value estimates based on Ohlson (1995), together with the work of Myers (1999b) that includes the RI intercept term in the pricing model, motivate me to augment the Ohlson model in order to capture the impact of the intercept terms on the residual income forecasts and firm values. I show that the large negative bias reported in DHS and Myers (1999b) might be attributable to a key assumption of the underlying Ohlson model. The Ohlson model, which assumes zero mean RI and 01 reverting processes, seems to fail to capture the effects of conservative accounting. Because a non-zero mean reverting process for RI and 01 could be observed in practice, the intercept terms might have a significant impact on forecasting future RI and valuing a firm. In the AR(1) RI (01) process, the mean RI (01) is approximately the same as the corresponding intercept over one minus the corresponding slope coefficient, so the non-zero intercept implies the non-zero mean RI (01). I term the augmented model, which incorporates RI and 01 intercepts into the linear information dynamics, as the 'intercept-inclusive' LID model.
zero mean 01.
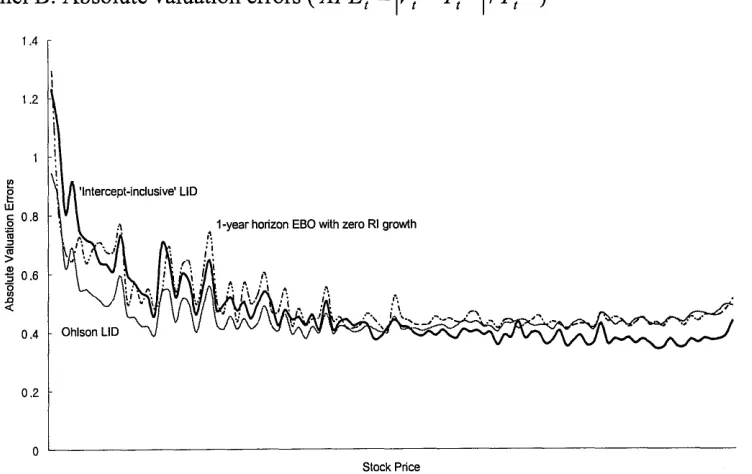
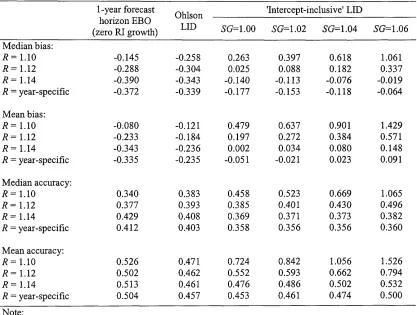
In this study, I examine the reliability of various Rl-based valuation models using large U.S. and U.K. samples. The U.S. study is motivated by the substantial negative bias, reported by DHS. It investigates whether the 'intercept-inclusive' LID model produces less biased value estimates compared to the Ohlson (1995) model and a simple model in which 1-year ahead earnings forecast is capitalised as a flat perpetuity.4 In order to facilitate comparison with DHS's results, I use data that are very similar to those used in DHS. Empirical evidence shows that value estimates based on the 'intercept-inclusive' LID approach are substantially less biased than those based on the other two approaches.
I also replicate and extend the work of DHS using U.K. data. This enables a comparison to be made between the results for two countries. The results show that the patterns of residual income persistence in my U.K. data are similar to those reported in both U.S. studies (DHS and my U.S. study), even though there are some differences in the sign and the magnitude of regression coefficients. In terms of the models' validity, the Ohlson model seems to be outperformed by the 'intercept-inclusive' LID model and some EBO models. Thus, the U.K. study provides evidence similar to that from the U.S. study. The superiority of the 'intercept-inclusive' LID model over the Ohlson model in terms o f bias and accuracy of value estimates is confirmed by various sensitivity tests.
Chapter 1. Introduction
Moreover, using U.K. data, I explore the important issue of differences in the applicability of valuation models. Despite the potential importance in equity valuation, there has been little concern about the issue of the conditions under which one model might dominate others. Because firms' accounting methods/systems and economic properties are different from each other, it is possible for a valuation model to have different applicability to different firms. In other words, bias and accuracy of value estimates might be different across firm-specific characteristics such as earnings persistence, conservatism, future potential growth and profitability, and a valuation model might not dominate other models in all circumstances. If the usefulness of a model consistently depends on some properties or characteristics, it would be evidence that the model cannot be applied universally. Thus, to explore which properties and characteristics affect the applicability of a model would be important, especially for practitioners. In general, the 'intercept-inclusive' LID model seems to perform well for firms with moderate eamings-to-price (E/P) ratio, market-to-book (P/B) ratio and one- year ahead RI forecasts-to-book (FRI/B) ratio. On the other hand, the Ohlson model (the EBO model) is likely to give relatively reliable value estimates for firms with low (high) E/P, P/B and FRI/B.
whether a certain model dominates the others. If the simpler EBO model dominates the LID models in all cases, the process for estimating persistence parameters may offer few benefits and the LED models need to be further modified.
1.2. Structure o f the Thesis
Chapter 1. Introduction
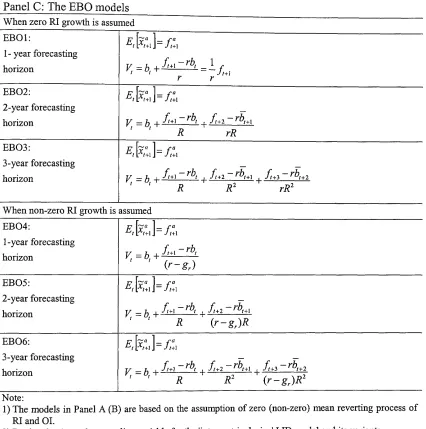
Chapter 3 presents the development of the 'intercept-inclusive' LID model, which is innovative and central to my thesis. Because Ohlson's (1995) assumption that accounting is unbiased is unlikely to be appropriate in the presence of conservative accounting, the intercepts of AR(1) RI and 01 generating equations in the Ohlson (1995) linear information dynamics seem to be non-zero. In other words, the non-zero mean expected RI, which corresponds to the accounting conservatism, is captured by the non-zero intercepts of both RI and 01 generating equations in the linear information dynamics. From the relaxation of Ohlson's implicit assumption that the unconditional mean of RI and 01 are zero, I derive the 'intercept-inclusive' LID model and show its potential impact on valuation biases. Then, some LID-based valuation models that have appeared in earlier studies, including the Feltham and Ohlson (1995) and Ohlson (1995) models, are shown to be special cases of the 'intercept-inclusive' LID model. There could be various LED-type and EBO-type valuation models according to the assumptions of LID in the first case, and various sets of forecast horizon and terminal value assumptions in the second case. In this thesis, I consider 9 Ohlson (1995) LED- based models and 7 'intercept-inclusive' LED-based models according to the assumption of 01 and/or the restriction of RI and 01 persistence parameters. According to the combination of 3 forecast horizons (1-year to 3-year) and 2 future RI growth assumptions (zero and non-zero), 6 EBO models are considered as well.
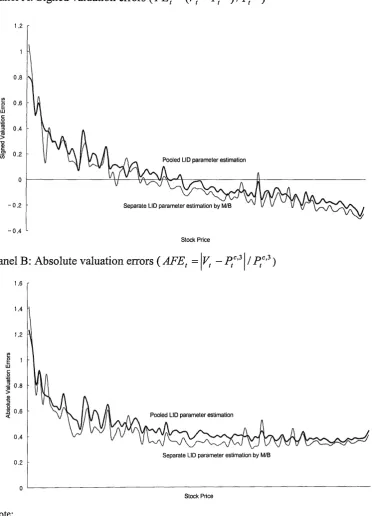
which are very similar to those used by DHS. However, practical implementation of the 'intercept-inclusive' LID approach requires a fundamental change in the scaling variable from that used by DHS. DHS deflate RI and 01 variables in the linear information dynamics by price to control for size. Because this causes the scaling variable to be an input to the 'intercept-inclusive' LID model, it causes circularity. In order to avoid this circularity problem, I use book value as a scaling variable. For a supplementary test, I investigate the effects of alternative trimming and winsorising criteria on LED parameters and value estimates.
Chapters 5 to 7 report the results of an analysis based on U.K. data from 1969 to 1998. Chapter 5 contains the definition of four alternative earnings measures together with other variables, sample selection and descriptive statistics. I use two measures of 'ordinary earnings', one measure comprising ordinary earnings and all abnormal items, and one measure comprising ordinary earnings and exceptional items. This enables me to test the robustness of the empirical results to the use of alternative earnings measures and to explore the effect of exceptional and/or extraordinary items on LED parameters and value estimates. All variables used in the U.K. study except the I/B/E/S analysts' earnings forecasts are defined in terms of Datastream items.
Chapter 1. Introduction
tests are then conducted by assuming different book value growth rates, residual income growth rates, and discount rates, and by using different benchmarking stock prices and consensus earnings forecasts. If the reliability of value estimates considerably varies by the change of a component in the valuation model, the component should be carefully estimated or assumed.
Chapter 7 investigates alternative models' applicability across various firm-specific characteristics. The issue of the conditions under which one model dominates the other models and a model performs best is explored using three approaches to Rl-based equity valuation - the Ohlson (1995) LID, the 'intercept-inclusive' LID, and the 2-year horizon EBO with the assumption of 4% future RI growth. I address differences in the implementation procedures and the underlying assumptions of three competing models first, and then develop predictions about models' applicability across firm-specific characteristics - earnings attributes, conservatism, future potential growth, firm size, future profitability, and industry membership. Bias and accuracy of value estimates in portfolios partitioned by each ex-ante proxy variable for a certain firm-specific characteristic are compared by applying statistical tests for the equality and by use of graphical illustration. Regressions of bias and accuracy on various firm-specific ex-ante variables are also conducted in order to identify determinants of models' applicability.
2.1. Development of the Residual Income Valuation (RIV) Model 13
2.2. Empirical Content of the RIV Model 17
2.2.1. Usefulness of the RIV model 17
2.2.2. Information dynamics of the LID model 18
2.2.3. Other information in the LID model 21
2.2.4. Persistence parameters of the LID model 24
2.3. Recent Empirical Research on the RIV Model 26
2.3.1. LID approach 26
Dechow, Hutton and Sloan (1999) 26
Myers (1999b) 28
Hand and Landsman (1998,1999) 30
2.3.2. EBO approach 31
Frankel and Lee (1998) 31
Lee, Myers and Swaminathan (1999) 32
Francis, Olsson and Oswald (2000) 34
2.4. Analysts' Earnings Forecasts 35
2.4.1. Usefulness of analysts' earnings forecasts in accounting research 35
2.4.2. Attributes of analysts' earnings forecasts 38
Evidence o f optimism 38
Determinants o f optimism 39
Revisions 40
Decline in optimism 41
2.5. Conclusions 42
CHAPTER 2
LITERATURE REVIEW
2.1. Development o f the Residual Income Valuation (RIV) Model
The development o f Ohlson's (1995) accounting-based valuation model starts from the assumption that firm value is 'the present value of expected dividends (PVED)', which is a widely accepted fundamental finance concept. A basic long-known accounting concept, the clean-surplus relation (CSR), is assumed as well. Under CSR, all changes in the balance sheet value of shareholders' funds other than transactions with shareholders are included in earnings. This is an important concept because it integrates the bottom-line items in the balance sheet and income statement (i.e., book value and earnings) so that all changes in assets/liabilities unrelated to dividends must pass through the income statement (Ohlson, 1995).
where Vt is intrinsic value of equity at date t, dt is net dividends at date t, R is 1 plus the discount rate (r), xt is earnings for the period (M , t), bt is book value at date t, and Et[-] is the expectation operator conditional on the date t information.
oo
(Ass. 1: PVED) r = l
d t = x t ~ ( b t ~ b t -1) (Ass. 2: CSR)
the sum of book value and the present value of future residual incomes. That is, Ass. 1, Ass. 2 and the definition of residual income (RI) yield the residual income valuation (RIV) model.
Thus, valuing a firm depends on how to estimate the second term in the right hand side of the RIV model - the present value of future cash flows not captured by the current book value (i.e., unrecorded goodwill). That is, the accuracy of estimated firm value comes from the accuracy of the estimated present value of expected future residual income. Two approaches have been developed for the estimation of the present value of future residual income. One is the future residual income generating information dynamics, and the other is the simpler Edwards-Bell-Ohlson (EBO) technique. Ohlson (1995) uses information dynamics to estimate the future residual income. The dynamics include a modified AR(1) auto-regressive process for residual income, which is called as 'residual income generating linear information dynamics (LID)'.
where v is information about future residual income not in current residual income (i.e., 'other information'), s is the unpredictable, zero mean disturbance term, co and y are fixed persistence parameters that are non-negative and less than one.
x* = x t - rbt_x (RI)
vt = b ,+ f x ‘£ , k r (RIV)
(Ass. 3: LID)
Chapter 2. Literature review
In contrast, the EBO approach is to forecast residual income for the first few years and then estimate a 'terminal value (TV)1 relating to periods beyond the forecast horizon. Consensus analysts' earnings forecasts and a long-term growth rate rather than the past earnings and book values are often used for forecasting residual income. If we assume that a firm's dividend payout ratio (div) is constant over the years, and we can get one and two year ahead analysts' earnings forecasts and a long-term earnings growth estimate (Ltg), then the future residual income can be estimated by a sequential generating process (denoted SGP) as follows:
Step 1: f°+l = £,[*,“,] = (roeM - r)b, where roeM = E,[rdeM ]= f M /b,
Step 2: / “2 = £,[*“,]= (roe,+2- r ) ^ +1
where bM =£,[&,+1]=[l + roe1+1(l-£ftV)]&, and roeM = E,[roeM }= f H llbM
Step 3: f ‘ , = E, ] = ( r o e ,- r ) ^ +M, i = 3,4,—,T
where bM_, = E, ]= [l + (1 - div)]&,+i_2 and roeM = £,[roe,„] = f M ( 1 + Ltg)‘~2 lbM_t
Step 4: = E ,[*/+/] = f , l T(1 + * , ) " , i> T + 1 (SGP) where / , +1and f t+2 are respectively one-year-ahead and two-year-ahead analysts'
earnings forecasts, f ta+i is z-year-ahead expected residual income, roet+i is /-year-ahead
rate, and Tis forecast horizon.5,6
Given the Ohlson's information dynamics in Ass. 3, the RTV model can be rewritten in terms of current book value, current residual income and 'other information' (Eq. 1). Equivalently, given CSR, this equation can be restated in terms of current book value, current earnings, dividends and 'other information'. This is why the Ohlson model is also said to be the EBD (Earnings, Book Value, Dividends) model. It is worth noting that market value is expressed partly by a weighted average o f book value and capitalized current earnings (adjusted for dividends). So this equation is also called Ohlson's weighted average model (Eq. 2). Ass. 1, Ass. 2 and Ass. 3 also lead to the returns model given in Eq. 3. On the other hand, firm value can be estimated using SGP in the EBO framework (Eq. 4). Here, terminal value is often assumed to be the present value of year-T residual income in perpetuity (i.e., TV = R~T ( f ta+T / r)), although expected post-horizon growth could also be incorporated.
Vt =bt + a xx at + a 2vt (Eq. 1)
Vt = (1 - k)bt + k(— xt - d t) + a 2vt (Eq. 2: WAEBD) r
vt + d< _ R | fl + a i)g» + a2s2( (Eq. 3)
K-, K-,
5 Lee et al. (1999) suggest a linear fade rate to the industry median ROE instead o f a long-term earnings growth rate (Ltg) for calculating ro el+i, i = 3,4, • • •, T in Step 3.
6 In Step 4, expected average residual income growth rate (gr) is assumed for the post-horizon residual
Chapter 2. Literature review
(Eq. 4: EBO)
where a, = CO R , k = r ax, and TV is terminal value. R - co’ ®2 (R -a > )(R- r )
2.2. Empirical Content o f the R IV Model
2.2.1. Usefulness o f the R IV model
As mentioned above, the RIV model is an equivalent form of the PVED model, given CSR. Dechow et al. (1999), therefore, insist that "the RIV model is interpretable in the context of the original PVED model, and the appeal to the residual income formulation of the PVED model is redundant. Thus, it provides no new empirical implications in and of itself'. Ohlson (2001) also says that RIV should not be thought of as the formula necessary to derive conclusions bearing on values and returns. He argues that key implications of the Ohlson model do not substantially depend on the RIV framework.
on the reliability of value estimates based on RIV.7 This gives a theoretically justifiable basis for using accounting concepts in firm valuation. Even if the intrinsic values based on PVED, FCF (the discounted free cash flow model), and RIV are identical in theory, the estimated values will differ in practice because the forecasted attributes and the forecasting procedures for those value estimates are different. Francis et al. (2000), Penman and Sougiannis (1998), and Courteau et al. (2000) compare these alternative value estimates to observed prices. They conclude that RIV value estimates dominate the other two theoretically equivalent value estimates in terms of their ability to approximate to observed prices and in terms of their ability to explain observed prices. Their study supports the usefulness of the RIV model from the practical viewpoint.8 Furthermore, RIV is advantageous because it compresses and streamlines the mathematics. Conclusively, the role of RIV in the Ohlson model ought not to be neglected, even if PVED and RTV theoretically yield the same solution (Ohlson, 2001).
2.2.2. Information dynamics o f the LID model
In order to perform valuation using the RIV model, future residual income should be estimated. One approach for the estimation is to construct the appropriate linear information dynamics (LID). That is, the link between current accounting and 'other' information and future residual income is an essential part of firm valuation, because it
7 There is no difference in the accuracy o f RIV value estimates for high vs. low R&D firms and high vs. low accrual firms, although there is some evidence that RIV value estimates is a little different in terms o f the explainability o f variation in stock prices according to the level o f accounting discretion.
determines the valuation formula.
Chapter 2. Literature review
However, information dynamics is still the most controversial part of the Ohlson model. Which information dynamics is most appropriate in order to make economic and accounting sense?
Ohlson (2001) says Ass. 3 is based on accounting concepts rather than analytical advantage. Even though Ass. 3 does not explicitly say anything about dividends, it implies that "dividends reduce current book value, but not current earnings" and "the evolution o f 'other information' is independent of dividends", which make sense in the economic and accounting concepts. The incorporation of 'other information' also allows for the additional information in forecasting future residual income beyond the historical accounting information in the financial statements. Consequently, the valuation implications of Ass. 3 combined with Ass.l and Ass. 2 have some attraction beyond mere simplicity in derivations via the RIV model.
relevance incremental to residual income and book value. Similarly but more generally, Pope and Wang (1999) establish the information dynamics with decomposed earnings to investigate whether the earnings components are informative and value-relevant. They contend that lagged book value and earnings components are generally relevant in predicting aggregate residual income and in valuing the firm. A bit surprisingly, even a value irrelevant earnings component can have an informative role in the information dynamics according to their analysis.
Chapter 2. Literature review
greater than the economic depreciation rate and ii) future positive NPV investment opportunities not reflected in current accounting numbers. Consequently, future residual operating income is generated by current residual operating income, current capital investment, lagged operating assets and 'other information’.
Meanwhile, Biddle et al. (2000) proposes non-linear information dynamics based on the economic intuition that capital follows profitability. They assume that current profitability guides a firm's capital investment decisions so that future residual income is generally a convex function of both current profitability and capital investment informed by current profitability.
2.2.3. Other information in the LID model
In the empirical tests of the Ohlson (1995) and the Feltham and Ohlson (1995, 1996) model, 'other information (01)' is often ignored by researchers because of the unobservable nature of 'other information'. However, Ohlson (2001) contends that "equating v to zero may be of analytical interest, but it severely reduces the model's empirical content" and "no apparent reasons suggest that one must eliminate 'other information' from the model, as long as one grants the observability of expected earnings".
is not capable of being inferred from historical earnings numbers and their time series properties. If 'other information' can be adequately incorporated into the linear information dynamics, it should be possible to improve the model's ability to forecast the next period's residual income and to explain firm value. Possible components of 'other information' are new patents, regulatory approval of a new drug for pharmaceutical companies, new long-lived contracts and order backlog (Myers, 1999b).
Despite the unobservable nature of 'other information', Ohlson (2001) suggests that analysts' consensus forecasts of next-year earnings would seem to be a reasonable proxy for expected earnings. Thus, 'other information' can be expressed as the expected residual income based on analysts' consensus earnings forecasts minus current residual income multiplied by co (Eq. 5).
If we use analyst's consensus forecasts as next-year earnings forecasts, Eq. 1 and Eq. 2 can be restated as Eq. 6 and Eq. 7, respectively;
where f t+l is one-year-ahead analysts' consensus earnings forecasts, f t+l Et
9 See Ohlson (2001) and Hand and Landsman (1998, 1999). See Appendix 2.1 for the derivation o f Eq. 7. (Eq. 5)
Vt =bt + (a, - coa2)xat + a j ta+x (Eq. 6)
(Eq. 7)9
Chapter 2. Literature review
j3 2 = --- , and ™_____
( R - co)(R - y ) (R - co)(R - y) '
Eq. 6 states that equity market value is a linear function of current book value of equity, current residual income and next year's expected residual income. And Eq. 7 expresses equity market value as a linear function of current book value, current net income, net dividends and one-year-ahead net income. Here, it is worth noting that /3X + P 2 + /?3 = 1, indicating that the dividend displacement property (i.e., d V j d d t - -1) holds in the Ohlson model (Ohlson, 2001).10 For practical purposes, we can use Eq. 6 or Eq. 7 in place of Eq. 1 or Eq. 2 when 'other information (v)' is incorporated for testing the Ohlson model.
Following a suggestion in Ohlson (2001), Dechow et al. (1999) uses I/B/E/S one-year ahead analysts' earnings forecasts to estimate 01 in their empirical implementation of the Ohlson (1995) model. Liu and Ohlson (2000) apply this idea to the Feltham and Ohlson (1995) model. They suggest that one type of OI at year t, which is a component o f the expected operating assets at year t+1, can be estimated using analysts' intermediate-term earnings growth rate forecasts.11 The other type of OI at year t, which is a component of the expected residual operating income at year t+1, is estimated as in Dechow et al. (1999) and Ohlson (2001) (i.e., using one-year ahead analysts' earnings forecasts). On the other hand, Begley and Feltham (2002) use analyst-based one- and
10 See Appendix 2.1 for the proof of /?, + /?2 + /?3 = 1 •
two-year ahead RI forecasts to estimate two kinds of OI included in the Feltham and Ohlson (1996) information dynamics. These efforts in estimating unobservable 'other information by using observable analyst-based forecasts are an important contribution to the empirical implementation of the linear information dynamics model.
2.2.4. Persistence parameters o f the LID model
In Ohlson's information dynamics (Ass. 3), co reflects the extent to which the current level of residual income is likely to persist into the future, and y reflects the extent to which 'other information' is likely to persist in the future. These persistence parameters are restricted to be non-negative and less than one, so that future residual income and 'other information' are assumed to asymptote to its mean, respectively. The unconditional means of residual income and 'other information' are zero in the Ohlson (1995) model (i.e., zero intercepts). Dechow et al. (1999) and Myers (1999b) state that the long-run residual income seems to follow a stationary and mean reverting process as Ohlson (1995) assumes. This means that the mean of the expected residual income does not depend on time, and the long-run residual income asymptotes to the mean.
Chapter 2. Literature review
simple auto-regressive process with parameter y (Eq. 9).
(Eq. 8)
v,+i
=To +T M + e 2tM (Eq. 9)Dechow et al. (1999) also suggest the conditional estimation of co. Actually, in the Ohlson model, co (as well as y) should be a firm-specific parameter. However, instead of running a time series regression (Eq. 8) firm by firm like Myers (1999b), Dechow et al. (1999) modify the regression equation and include some firm-specific attributes in
Eq. 8. They state that co (the persistence of residual income) is affected by five determinants - the magnitude of residual income (q l), the magnitude of non-recurring special items included within residual income (q2), the magnitude of operating accruals (q3), the dividend payout ratio (div) and industry specific persistence measures (ind).
Thus, a firm-specific persistence parameter can be estimated using these five conditioning variables as well as the level of residual income. An advantage of this approach over time-series-based approaches is that it is possible to allow the estimated persistence parameter to vary from period to period.
specific attributes (Eq. 11).
xt = co0 + coxxt_x + co2 {xt_xq\t_x ) + co3 (x°_xq2t_x) + co^ (x“_xq2>t_x) + co5 (x “_xdivt_x ) + co6 (xat_xindt_x ) + st (Eq. 10) o f =cox + o 2q lt + o 3q2t + o 4q3t + co5divt + co6indt (Eq. 11)
However, Myers (1999b) criticizes this effort to estimate a firm-specific persistence parameter. He argues that simply adding other variables to Eq. 8 and summing the coefficients for the conditional persistence parameter gives rise to internal inconsistency with theory and inequilibrium price. That is, to be consistent with the theory, the time series of the additional 5 variables (x°q lt,---,x“indt ) should also be estimated, and the equilibrium price should be a linear function of book value and 6 variables in Eq. 10 with complex coefficients containing up to 42 parameters.
2.3 Recent Empirical Research on the RIV Model
2.3.1. LID approach
Dechow, Hutton and Sloan (1999)
Chapter 2. Literature review
Generally, their test shows that the models incorporating 'other information' are better than the models ignoring it, in terms of prediction of next period residual income and explanation of contemporaneous stock prices. But of the models incorporating 'other information', the model using 0 = 1, y = 0) or 0 = 0, y -1) - a model that effectively capitalizes analysts' earnings forecasts for next year in perpetuity — provides the most accurate forecasts of stock prices, while the unrestricted general Ohlson model is the second most accurate.12
This result is somewhat surprising because it makes the estimation of future residual income unnecessary in firm valuation. That is, since the model using 0 = 1, / = 0) or O = 0, y = 1) gives the closest approximation to the observed stock price, rational expectations of future residual income might not be reflected in stock prices. Subsequent tests suggest that the superior explanatory power of the simple capitalization model may arise because investors over-weight information in analysts' earnings forecasts and under-weight information in current earnings and book value.
Another test is the regression of stock prices on the variables used in the valuation models. But in the case of regressions of price on book value and earnings (i.e., ignoring v), stock prices appear to place too low a weight on book value and too high a weight on earnings, compared with the value of coefficients using the historical averages of co, y , and r. In the case of regressions of price on book value, earnings and the consensus
12 When we include 'other information' in pricing models, the model when co = 1 and y = 0 is equivalent
analysts' forecasts of next year's earnings, stock prices place too low a weight on book value and too high a weight on the analysts' forecast of next year's earnings as well.
One interpretation of these results is that stock prices do not reflect rational expectations, because investors overestimate the persistence of residual income and short-term earnings forecasts. Another possibility is that the underlying theoretical model, which assumes that residual income is a (zero) mean reverting and is generated by auto-regressive process, is mis-specified.
Myers (1999b)
This study examines how well four different residual income valuation models, which are internally consistent with theory, show the predicted coefficients and the market price. In contrast to Dechow et al. (1999), Myers (1999b) estimates the firm-specific persistence parameters using a firm-specific time-series model. Before conducting his analyses, he argues that recent studies by Frankel and Lee (1998) and Dechow et al. (1999) modify the information dynamics, so violate internal consistency and the no arbitrage assumption. He then suggests four models preserving consistency with theory.
Chapter 2. Literature review
backlog (the Feltham and Ohlson (1995) LID with OI, LIM4).13 LIM2 is for capturing the conservative effect of book value, and LIM3 is for capturing the book value and income effects of conservatism. In LIM4, order backlog is added as one o f 'other information' components to incorporate non-accounting information.
While the auto-regressive parameters of residual income in all models support the hypothesized sign and magnitude, which are positive and less than one respectively, they are small (median coefficients are 0.013 to 0.234). On the other hand, the efforts to capture the conservatism effect using LIM2 and LIM3 fail to describe the time series of residual income, even when the conservative sub-sample is used. Although conservatism models (LIM2 and LIM3) tend to explain market value better than a simple model (LIM1), the value estimates of all models understate market value in a similar fashion to the results of most previous empirical studies. These results mean that these 4 models do not explain a large portion of the market's expectations of future residual income. Finally, the inclusion of order backlog (LIM4) has a trivial effect on future residual income, and is not likely to improve the accuracy of value estimates.
He explains that the failure of empirical models might come from 1) too few observations for the time-series parameters and/or 2) nonstationary time series properties. Specifically, he states that nonstationarity of time series in the residual income valuation model might be due to changes in growth rates, accounting procedures
and production technologies.
Hand and Landsman (1998, 1999)
The objective of Hand and Landsman (1998)'s paper is to test whether v is zero or not in an empirical application of the Ohlson model. Their estimating equations are Eq. 2 omitting the last term for the test without v and Eq. 7 for the test with v. Their testing results show that both cases have anomalies. If v is assumed to be zero, the regression coefficients o f book value, earnings, and dividends in Eq. 2 are predicted to be positive (0 < l-k < 1), positive (JcR/r > 0), and negative (-1 < -k< 0), respectively. However, their results show that the regression multiple relating dividends to equity market value is reliably positive. On the other hand, if v impacts future residual income via Ohlson's information dynamics, the regression coefficients of book value, earnings, dividends, and one-year-ahead forecasted earnings in Eq. 7 are respectively predicted to be positive (J3\ > 0), negative {fiiR/r < 0), positive (-/% ^ 0), and positive (/?3/r > 0). However, the regression results also show that the signs on the multiples on current earnings and net capital stock outflows (they divided net dividends into common dividends and net capital stock outflows) are opposite to the predicted ones.
Chapter 2. Literature review
property once more.
Taken together, these results conflict with value irrelevancy of dividends that the Ohlson model asserts. Hand and Landsman (1998, 1999) try to explain their empirical results through the profitability-signaling role of dividends. They also find that the positive pricing of dividends is much larger for loss firms than for profit firms. It means that managers of loss firms use dividends to signal future profitability. These further tests firmly support their assertion for the profitability-signaling hypotheses. Overall, they conclude that dividends seem to be one component of 'other information' that is available to market actors but is not yet captured by current financial statements.
2.3.2. EBO approach
Frankel and Lee (1998)
Frankel and Lee (1998) investigate the relation between accounting numbers and firm value using the EBO technique (Eq. 4) rather than the information dynamics. They directly use analysts' consensus earnings forecasts as a proxy for market expectations of future earnings and estimate future residual income through SGP. They then measure the firm's fundamentalj^alue--by-means-oLt-he-^sl-imated-future.residual income.
Through cross-sectional correlation coefficients with stock prices (P), they first show the superiority of the analysts' eamings-based EBO value measures ( ky) over the
historical eamings-based EBO value measures (Vh). Values based on analysts' forecasts explain more than 64% of the variation in prices during the sample period, while historical eamings-based values and book value explain about 49% and 36%, respectively. Next, they state that the value-to-price ratio (Vy jP ) is better than firm size and the book-to-price ratio (BIP) in terms of the predictability of cross-sectional returns, especially over longer time horizons. That is, firms that have higher Vf j P are predicted
to earn higher long-term returns. Additionally, the predictive power of Vf / P for long term returns remains strong, even when we consider its correlation with firm size and B/P.
Overall, this study shows the usefulness of the EBO model based on analysts' earnings forecasts. Thus, in addition to the estimation of persistence parameters using the information dynamics, the EBO technique also needs to be considered, when the residual income valuation model is assessed empirically.
Lee, Myers and Swaminathan (1999)
Chapter 2. Literature 7'eview
can affect value estimates are considered. JThose factors include i) forecast horizon (3 to 18 years), ii) earnings forecasting metb d (a historical time-series model vs. a model based on analysts' consensus forecasts), iii) risk premia (a market-wide time-varying risk premium, a Fama-French one or three factor industry risk premium), and iv) risk free rate (short-term T-bill yield vs. the long-term treasury bond yield). ^
For evaluating o f the tracking ability, they first examine the autocorrelations of dividend yield (DIP), eamings-to-price ratio (E/P), book-to-market ratio (B/P) and value-to-price ratio (VIP). The results show that traditional value metrics have high first-order autocorrelations, indicating that they are either nonstationary or long-term mean reverting. On the other hand, VIP measures have a lower standard deviation and a faster rate of mean-reversion (i.e., smaller first-order autocorrelations). Especially, VIP using the short-term interest rate (i.e., T-bill rate) and analysts' earnings forecasts has the lowest first-order autocorrelations, indicating that the choice of the riskless rate and earnings forecasting method play an important role for the success of V.
In addition to the evidence about the superiority of V, they rank alternative measures of VIP in terms of two dimensions - predictive ability and tracking error. Alternative
measures of V are estimated using several factors mentioned above. Conclusively, the inclusion of time-varying interest rates and analysts' earnings forecasts improve the performance o f the VIP measures, while the choice of alternative forecast horizons and risk premium are of secondary importance.
Francis, Olsson and Oswald (2000)
The objective of Francis et alls (2000) study is to examine whether three theoretically equivalent valuation models - the discounted dividend (DIV) model, the discounted free cash flow (FCF) model and the discounted abnormal earnings (AE) model - give rise to the same value estimates in practice. The motivation is related to the typical situation in which an investor has to decide which series of forecasts to use to value a firm. They argue that intrinsic value estimates derived from three models can differ becauae-of the different attributes of forecasted DIV, FCF and AE.15
The relative reliability of value estimates arising from the three models is compared in terms of their accuracy and explainability. The accuracy is defined as the absolute difference between the value estimate and the current stock price, scaled by the current stock price, while the explainability is defined as the ability of value estimates to explain cross-sectional variation in current stock prices. For the calculation of value
Chapter 2. Literature review
estimates corresponding to each model, Francis et al. (2000) use the Value Line database to get the market's expectations of the relevant elements in three models.16
The results show that the AE value estimates are more accurate and explain more of the variation in stock prices than the other two value estimates. The authors mention that the superiority of the AE value estimates might come from the more reliance of value estimates on book value and/or the greater precision of AE forecasts, and the superiority is robust regardless of different accounting practices and policies. Thus, they suggest that, under the circumstances where earnings forecasts and book values are available, there is little motivation to use DIV or FCF model by manipulating accounting data.
2.4. Analysts' Earnings Forecasts
2.4.1. Usefulness o f analysts' earnings forecasts in accounting research
Since the underlying principle that the share price of a firm is the embodiment of the market's expectations about its future prospects seems to be true, knowing and quantifying market expectations is one of the most important factors in the investment process (Rosen, 2000). In this context, the quantification of market's expectations has long been a main concern of both practitioners and capital market researchers. Following the development of databases that collect and process brokerage earnings estimates (i.e., I/B/E/S, First Call, Value Line, Zacks), it has been getting much easier