Journal of Chemical and Pharmaceutical Research, 2014, 6(6):2467-2471
Research Article
ISSN : 0975-7384
CODEN(USA) : JCPRC5
A rapid peak detection algorithm
Yanpeng Wu
1,3, Xiaoqi Peng
1,2, Jianzhi Zhang
1and Ye Zhang
11
School of Energy Science and Engineering, Central South University, Changsha, Hunan, China
2
Department of Information Science and Engineering, Hunan First Normal College, Changsha, Hunan, China
3Provincial Key Laboratory of Informational Service for Rural Area of Southwestern Hunan, Shaoyang, Hunan,
China
_____________________________________________________________________________________________
ABSTRACT
This paper presents a general method for rapid peak detection. First, the signals curve is equal divided and maximum and minima values in each segmentations are collected. The repeated maximum and minima values are removed and all fake peaks/ troughs are merged in the case of ensuring true peaks/ troughs remained. Experimental results showed that: compared with traditional methods, the proposed method is more accurate and faster in peak detection, and suitable for variety waveforms.
Key words: Savitzky-Golay filter, peak detection, peaks merge
_____________________________________________________________________________________________
INTRODUCTION
Peak detection in signals is an important step in many signals processing applications. Many different methods are now developed, including those based on traditional window-threshold technique[1], wavelet transform[2], Hilbert transform[3], artificial neural networks[4], techniques using templates[5], morphology filtering [6], nonlinear filtering[7], Kalman filtering[8], Gabor filtering[9], Gaussian second derivative filtering[10], linear prediction analysis[11], higher-order statistics[12], K-Means clustering[13], fuzzy C-Means clustering[14], Empirical Mode Decomposition[15], hidden Markov models[16], Savitzky-Golay filtering[17], or a smoothed nonlinear energy operator [18-21]. However, those methods are only effective for certain applications. Up to now, there is no general effective algorithm of peak detection.
This paper presents a general method for rapid peak detection, in which the detected peaks remain their original shape and width.
PEAK DETECTION ALGORITHM Problem posing
Assume the signals curve {Xi }(i=1,2,...m) is assembled with n consecutive peaks/troughs. The minimum width of peak / trough is β. Target: find out distribution of peaks/troughs number, height and width.
Obviously peak point must be local maximum, and trough point must be local minimum.
Figure 1: A signals curve and maximum and minimum values of each segment
There are many maximum points and also many minimum points in figure 1, where some maximum points and some minimum points are repeated. Obviously, these "maximum + minimum" points are just middle points, which should be removed.
Review on the pattern of 2 successive extreme points, including four categories: "maximum-maximum" shape, "minimum-minimum" shape, "maximum-minimum" shape, "minimum-maximum" shape. Since peaks and troughs are alternating, the smaller point should be removed in "maximum-maximum" shape while the greater point should be removed in "minimum-minimum" shape.
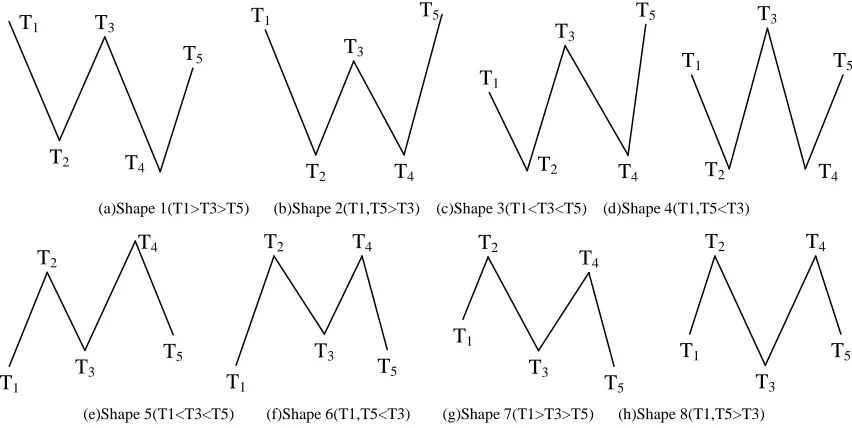
Review on the patterns of 5 successive alternating "maximum" and "minimum" points, including four categories as shown in figure 2, wherein shape 1 to 4 comprises three maximum points and two minimum points, and shape 5 to 8 comprises two maximum points and three minimum points.
(a)Shape 1(T1>T3>T5) (b)Shape 2(T1,T5>T3) (c)Shape 3(T1<T3<T5) (d)Shape 4(T1,T5<T3)
(e)Shape 5(T1<T3<T5) (f)Shape 6(T1,T5<T3) (g)Shape 7(T1>T3>T5) (h)Shape 8(T1,T5>T3)
Figure 2: The patterns of 5 successive alternating "maximum" and "minimum" points
It is easy to notice that in the shape of 1,2,3,5,6,7, if the distance between T3 and T1 or the distance between T3 and T5 is shorter than the value defined by the peak/trough, T3 should be removed. And as stated previously, T2 and T4 are turned into "maximum-maximum" shape or "minimum-minimum" shape when T3 be removed, thus we must remove one of them. In the shape of 4,8, even the distance between T3 and T1 or the distance between T3 and T5 do not satisfy the value defined by the peak/trough, we can’t determine whether T3 is peak or trough, nor T3 should be removed.
Extreme points shape processing
Set Dis(x,y) be the horizontal distance between point x, y.
The extreme points shapes are divided into four categories as follows: Class 1 be 2 consecutive maximum points; Class 2 be consecutive minimum points; Shape 1, 2, 3 be class 3 and shape 5,6,7 be 4th class; shape 4,8 be class 5;
T5 T1
T2 T4
T3 T5
T1 T2
T4
T3 T5
T1
T2 T4
T3 T5
T1 T2
T4
T3
T1
T2 T3
T5
T4 T1
T2 T3
T5
T4 T1
T2 T3
T5
T4 T1
T2 T3
T5
[image:2.595.94.520.390.604.2]other shapes as Class 6.
The extreme points shape of class 1-5 should be reshape with the priority order form high to low be 1-5. Each extreme points shape class is processed as following:
(1) Class 1
For two consecutive maximum point T1, T2, if T1> T2, then remove T2, else remove T1. (2) Class 2
For two consecutive minimum point T1, T2, if T1> T2, then remove T1, else remove T2. (3) Class 3
If Dis (T1, T3) <β or Dis (T2, T4) <β or Dis (T3, T5) <β, then remove T3, max (T2, T4). (4) Class 4
If Dis (T1, T3) <β or Dis (T2, T4) <β or Dis (T3, T5) <β, then remove T3, min (T2, T4). (5) 2 consecutive shapes of class 5
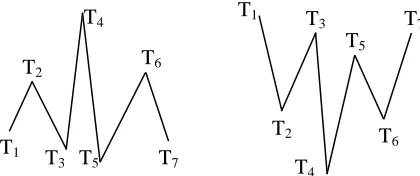
The case of consecutive 3 or more shapes of class 5 does not exist, however, the case of 2 consecutive shapes of class 5 may be found. For example, the adjacent shape 4 and 8 comprises shape 4-8 or shape 8-4, as shown in figure 3.
If Dis (T2, T3)> Dis (T4, T5), then remove T4, T5, else remove T2, T3.
[image:3.595.169.467.307.413.2](a)Shape 4-8(T1,T5<T3 and T2,T6<T4) (b)Shape 8-4( T1,T5<T3 and T2,T6<T4)
Figure 3: Example of 2 consecutive shapes of class 5
(6) Isolated shapes of class 5
Typical isolated shape of class 5, such as shape 6-4-7 comprised by the adjacent shape 6,4,7 and shape 1-8-2 comprised by the adjacent shape 1,8,2, as shown in figure 4.
Since class 3,4 are processed prior to class 5, then Dis(T2,T4)≥β, Dis(T4,T6)≥β. Therefore T4 is peak/trough candidate and T3 or T5 should be removed.
(a)Shape 6-4-7(T1,T5<T3 and T2,T6<T4) (b)Shape 1-8-2(T1,T5<T3 and T2,T6<T4)
Figure 4: Example of isolated shape of class 5
For isolated shape 4, case T3 == min (T1, T3) and T5 == min (T5, T7) is impossible. If T3 == max (T1, T3) and T5 == max (T5, T7),
if Dis (T1, T4)> Dis (T4, T7), then remove T5, T6, else remove T2, T3. else
if T3 == max (T1, T3), then remove T2, T3. if T5 == max (T5, T7), then remove T5, T6. If T3 == min (T1, T3) and T5 == min (T5, T7),
if Dis (T1, T4)> Dis (T4, T7), then remove T5, T6, else remove T2, T3. T1
T2
T3
T5 T4
T6 T1
T2 T3
T5
T4
T6
T1
T2
T4 T3
T5
T6 T7
T1 T2
T3 T5 T4
T6
[image:3.595.204.414.530.618.2]else
if T3 == min (T1, T3), then remove T2, T3. if T5 == min (T5, T7), then remove T5, T6.
Peaks merging algorithm
In summary, we get peaks merging algorithm as following:
Step 1: Divide signals curves {Xi } and collect maximum and minimum value into set {Ti}. Step 2: Remove all coincident points in set {Ti}.
Step 3: Search in {Ti} to find shapes of class 1-5, and process all matched shapes until all shapes of class 1,2 are removed and all shapes of class 3,4,5 satisfy the following conditions: Dis(T1,T3)≥β and Dis(T2,T4)≥β and Dis(T3,T5)≥β
Step 4: After processing of previous step, the rest maximum points of {Ti} are exactly target peak sand the rest minimum points of {Ti} are exactly target troughs. The results of calculating the distribution of number, height, distance of maximum/minimum points are the requested number, height and width of peaks/troughs of target signals.
SIMULATION AND ANALYSIS
The most common step of peaks detection is smoothing the signals curve first and filtering later. Savitzky-Golay filter, originally proposed in 1964 by the Savitzky and Golay and widely used in smoothing and removing noise of data stream, is famous for its strong ability of filtering noise with signals remained constant shape and width.
To compare the efficiency and accuracy of proposed method and Savitzky-Golay method, we made programs and execute in Matlab environment. Results are shown in Figure 5.
Figure 5: Results of proposed method compared to Savitzky-Golay method in peak detection
Figure 1 shows the peak detection accuracy of proposed method reach 100%. Comparing to original signals, all peaks and troughs detected by proposed method remain same shape and width. It is because of absence of smoothing and filtering operation that all peaks and troughs detected are located on the original signal curve. Though Savitzky-Golay method remove most noise by smoothing signal curve, it is hard to determine all the location of peaks and troughs, unless we execute Savitzky-Golay method to signal curve another one or more times. Furthermore, some peaks and troughs produce a small offset because of smoothing process, which will affect the accuracy of the final test results.
The complexity of the proposed method is O(t)=n, while the complexity of Savitzky-Golay method a is O(t)=n2. Obviously the proposed method is faster than Savitzky-Golay method.
The proposed method is essentially a local optimization algorithm, less affected by signals diversification and noise, and is valid for periodic signals and aperiodic signals.
CONCLUSION
The proposed algorithm has following characteristics:
(1) High accuracy in peak detection and more accurate than traditional methods.
[image:4.595.127.488.344.468.2]Acknowledgment
This work is supported by Natural Science Foundation of China (No. 61134006), Natural Science Foundation of China (No. 61273169), Hunan Province Science Foundation of China (No. 14JJ7077) and Fund of Hunan Provincial Education Department of China(13B107).
REFERENCES
[1] Excoffier J. L., Guichon G.. Chromatographia, 1982, 15(9), 543-545.
[2] Wee Andraw, David B. Grayden, Yonggang Zhu, et al. Electrophoresis, 2008, 29(20), 4215-4225. [3] Benitez D, Gaydecki PA, Zaidi A., et al. Computers in Biology and Medicine, 2001, 31(5), 399-406.
[4] G. Vijaya, Vinod Kumar, H. K. Verma. Journal of Medical Engineering & Technology, 1998, 22(4), 160-167. [5] Nhamoinesu Mtetwa, Leslie S. Smith. Neurocomputing, 2006, 69, 1366-1370.
[6] Fei Zhang, Yong Lian. Journal of Signals Processing Systems, 2011, 64(2), 187-194.
[7] Aboy Mateo, McNames James, Tran Thong, et al. IEEE Transactions on Biomedical Engineering, 2005, 52(10), 1662-1670.
[8] Nha Nguyen, Heng Huang, Soontorn Oraintara, et al. Journal of Bioinformatics and Computational Biology,
2009, 7(3), 547-569.
[9] Zhang B.; International Journal of Applied Mathematics and Statistics, 2013, 44(14), 422-430.
[10] Mattias J Fredriksson, Patrik Petersson, Bengt-Olof Axelsson, et al. Journal of Separation Science, 2009, 32(22), 3906-3918.
[11] Kang Ping Lin, Chang Walter H. IEEE Transactions on Biomedical Engineering, 1989, 36(10), 1050-1055. [12] Zhang B.; Yue H.. International Journal of Applied Mathematics and Statistics, 2013, 40(10), 469-476. [13] S. S. Mehta, D. A. Sheta, N. S. Lingayat, et al. IRBM, 2010, 31(1), 48-54.
[14] Swati Sharma,S. S. Mehta, Harleen Mehta. IJCA, 2011, 4, 19-23.
[15] Zine-Eddine Hadj Slimane, Amine Naït-Ali. Digital Signals Processing, 2010, 20, 1221-1228.
[16] Coast D. A., Stern R. M., Cano G. G., et al. IEEE Transactions on Biomedical Engineering, 1990, 37(9), 826-836.
[17] Li Kang, Yang Shaoqing. Journal of Data Acquisition & Processing, 2012, 25(S), 72-74.