International Journal of Emerging Technology and Advanced Engineering
Website: www.ijetae.com (ISSN 2250-2459, ISO 9001:2008 Certified Journal, Volume 3, Issue 6, June 2013)
236
Analysis of Van de Vusse Reactor using Model Predictive
Control
Ruchika
1, Neha Raghu
2 1Lecturer, 2PG Scholar, Department of Electrical and Instrumentation Engineering, Thapar University, Patiala, Punjab
Abstract— In this paper linear state space model predictive
control algorithm is discussed and applied to Van de Vusse reactor problem. The effect of changing the prediction horizon and model length is seen. Addition of noise to a system is also handled by model predictive control algorithm.
Keywords— Control horizon, Model Predictive Control, Prediction horizon, Receding Horizon Control, Van de Vusse reactor
I. INTRODUCTION
MPC technology was originally developed to meet the control needs of power plants and petroleum refineries. Later on, it found use in other application area like chemical industry and food processing. MPC became popular because it can handle constraints and multivariable control problems. Van de Vusse, in 1964, investigated a reaction scheme based on continuous stirred tank reactor (CSTR). In this paper, receding horizon approach is discussed and the effect of changing the prediction horizon and model length on the output of Van de Vusse reactor is seen. The noise handling capability of model predictive control algorithm is explored.
II. MODEL PREDICTIVE CONTROL
A. Basic theory
In traditional feedback controllers, control action is adjusted in response to a change in the output set-point of a system. Model predictive control (MPC) is a technique that focuses on constructing controllers that can adjust the control action before a change in the output set-point actually occurs. This predictive ability, when combined with traditional feedback operation, enables a controller to make adjustments that are smoother and closer to the optimal control action values. Fig. 1 shows the block diagram of model predictive control. A model of the process is used to predict the future evolution of the process to optimize the control signal. At each control interval, MPC algorithm attempts to optimize the future plant behavior by computing a sequence of future manipulated variable adjustments. The first input in the optimal sequence is then sent into the plant and the entire calculation is repeated at subsequent control intervals.
[image:1.612.325.558.388.546.2]The basic MPC controller can be designed with proper restrictions on the prediction horizon and model length. The prediction horizon has to be kept sufficiently larger than the control horizon. The MPC calculations are done in the prediction and controller blocks and are carried out quite often (e.g., every 1-10 minutes). The prediction block predicts the future trajectory of all controlled variables, and the controller achieves the desired response while keeping the process within limits. The targets for the MPC calculations are generated by solving a steady-state optimization problem based on a linear process model, which also finds the best path to achieve the new targets [2]. These calculations may be performed as often as the MPC calculations.
Fig. 1 Block diagram for model predictive control [1].
B. Objective
MPC is an advanced control technique which is mostly used in discrete-time applications. The overall objectives of MPC are, firstly, to prevent violations of input and output constraints. Second objective is to drive some output variables to their optimal set points while maintaining other outputs within specified ranges. And last, to prevent excessive movement of the input variables [3].
C. Comparison with traditional control
International Journal of Emerging Technology and Advanced Engineering
Website: www.ijetae.com (ISSN 2250-2459, ISO 9001:2008 Certified Journal, Volume 3, Issue 6, June 2013)
[image:2.612.50.292.282.417.2]237
PID handles only a single input and a single output (SISO systems), while MPC is a more advanced method of process control used for MIMO systems (Multiple Inputs, multiple Outputs). In traditional control, there is no knowledge of constraints whereas the primary advantage of MPC is its ability to deal with the constraints. Also, another difference is that traditional control does not require a model of process but a model is required in MPC [4]. Fig. 2 shows that set-point in traditional control is far from constraint whereas in MPC set-point is closer to constraint. MPC tries to bring the process as close as possible to constraints without violating them.Fig. 2 Comparison of traditional control with MPC [4].
III. THE RECEDING HORIZON
The control calculations are based on future predictions as well as current measurements. Future values of output variables are predicted using a dynamic model of the process and current measurements. Fig. 3 shows the concept of prediction horizon and control horizon.
Fig. 3 Basic concept for model predictive control [7].
A. Prediction and control horizons
Prediction horizon has a length equal to the number of samples in future for which the MPC controller predicts the plant output [4]. Prediction (P) is typically as far ahead as two to three times the dominant time constant of the system. Suppose the process is sampled at say one twentieth of that time constant: the output prediction horizon could then be up to some 60 steps ahead [5].
The length of control horizon is equal to the number of samples within the prediction horizon where the MPC controller can affect the control action [4].
B. Receding Horizon Approach [6]
At the kth sampling instant, the values of the manipulated variables, u, at the next M sampling instants, {u(k), u(k+1), …, u(k+M -1)} are calculated.
This set of M ―control moves‖ is calculated so as to minimize the predicted deviations from the reference trajectory over the next P sampling instants while satisfying the constraints.
Typically, an LP or QP problem is solved at each sampling instant.
Then the first ―control move‖, u(k), is implemented.
At the next sampling instant, k+1, the M-step control policy is re-calculated for the next M sampling instants, k+1 to k+M, and implement the first control move, u(k+1).
Then Steps 1 and 2 are repeated for subsequent sampling instants.
IV. OPTIMIZATION
Objective functions [3]
There are different choices for objectives functions. The first one is a standard least-squares or ―quadratic‖
objective function. The objective function is a ―sum of squares‖ of the predicted errors (differences between the set points and model-predicted outputs) and the control moves (changes in control action from step to step).
A quadratic objective function for a prediction horizon of 3 and a control horizon of 2 can be written
Φ =(rk+1 – ŷk+1)2+(rk+2– ŷk+2)2 +(rk+3 – ŷk+3)2 +wΔu2k
+wΔu2
k+1
(4.1) [image:2.612.57.276.524.673.2]
International Journal of Emerging Technology and Advanced Engineering
Website: www.ijetae.com (ISSN 2250-2459, ISO 9001:2008 Certified Journal, Volume 3, Issue 6, June 2013)
238
Φ= k+i – ŷk+i)2 + w 2k+i (4.2)
Another possible objective function is to simply take a sum of the absolute values of the predicted errors and control moves.
For a prediction horizon of 3 and a control horizon of 2, the absolute value objective function is
Φ =|rk+1 – ŷk+1|+|rk+2-ŷk+2|+|rk+3-ŷk+3|+ w|Δuk|+w|Δuk+1|
(4.3)
Which has the following general form for a prediction horizon of P and a control horizon of M:
Φ= k+I – ŷk+i| + w k+i| (4.4)
V. VAN DE VUSSE REACTOR PROBLEM
The reactor is considered at an operating point where optimal yield with respect to the desired product is achieved. There are two interesting features of this problem. First is that the steady state gain changes its sign at the operating point, therefore linear controllers will not be able to stabilize this reactor and accomplish satisfactory performance. Second is that the zero dynamics changes its properties at the operating point, therefore the qualitative behavior of CSTR differ for different set-points and disturbances [8].
Fig. 4 Schematic representation of the reactor [8].
Van de Vusse reactions are
A k1 B k2 C
2A k3 D (5.1)
Fig. 4 shows the schematic representation of the reactor. The flow F fed to the reactor contains only substance A. Main reaction is given by transformation of substance A into the product B. Substance A also reacts in unwanted parallel reaction to generate a by-product D. Furthermore, substance C is formed in an unwanted decomposition of the product B.
VI. IMPLEMENTATION IN MATLAB
The continuous state space model of the reactor,
A= [-2.4048 0; 0.8333 -2.2381];
B= [7; -1.117];
C= [0 1];
D= [0];
Where the measured state (output) is the concentration of the second component and the manipulated input is the dilution rate [3].
A. Effect of Prediction horizon
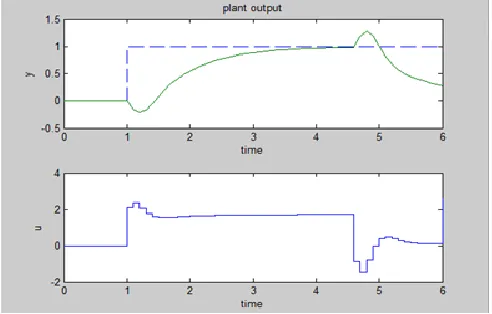
Figures 5, 6 show that a larger length of prediction horizon requires much more control action than a shorter one. If control horizon is fixed, then it is seen that the set point is being achieved in smaller time if a smaller prediction horizon is chosen.
B. Effect of Model Length
International Journal of Emerging Technology and Advanced Engineering
Website: www.ijetae.com (ISSN 2250-2459, ISO 9001:2008 Certified Journal, Volume 3, Issue 6, June 2013)
[image:4.612.320.569.120.311.2]239
Fig. 5 Output after applying MPC with P = 15 and N = 50 to Van deVusse reactor.
[image:4.612.50.294.125.304.2]C. Effect of addition of noise
[image:4.612.326.567.347.493.2]Fig. 8 shows the effect of noise and of input and output disturbance on the same problem of Van de Vusse reactor using MPC with P = 10 and N = 50. Plant output and measured output are different because measurement noise is taken into consideration. Normally, controller output signal goes into plant but here plant input signal is not the same as controller output because input disturbance is also considered.
Fig. 6 Output after applying MPC with P = 25 and N = 50 to Van de Vusse reactor.
Fig. 7 Output after applying MPC with P = 15 and N = 70 to Van de Vusse reactor.
Fig. 8 Output after adding input and output disturbance and measurement noise.
VII. CONCLUSION
[image:4.612.48.294.447.604.2]International Journal of Emerging Technology and Advanced Engineering
Website: www.ijetae.com (ISSN 2250-2459, ISO 9001:2008 Certified Journal, Volume 3, Issue 6, June 2013)
240
REFERENCES[1] Seborg, D.E., Edgar, T.F., and Mellichamp, D.A., Process Dynamics
and Control. John Wiley and Sons, Inc., New Jersey, New York, 2004
[2] Backx, Reduction and Predictive Control Design for a computational
Fluid Dynamic model, Proceedings of the 41st IEEE conference on
Decision and Control, vol. 3, 2002
[3] Bequette, B.W., Process Control - Modeling, Design, and
Simulation. New Jersey: PHI, 2003, ch.16.
[4] Hans-Petter Halvorsen, Model Predictive Control in labVIEW, Dept
of Electrical Engineering, Information Technology and Cybernetics, Telemark University College, 2011
[5] Jonathan Love, Process Automation Handbook - A guide to Theory
and Practice.
[6] Bemporad, A., Model Predictive Control: Basic concepts, Controllo
di Processo e Sistemi di Produzione, 2009
[7] Simone Loureiro De Oliveira, Model Predictive Control for
Constrained Nonlinear System, IfA, Publication No.6, pg.16
[8] Simone Loureiro De Oliveira, Model Predictive Control for
![Fig. 1 Block diagram for model predictive control [1].](https://thumb-us.123doks.com/thumbv2/123dok_us/8728626.886146/1.612.325.558.388.546/fig-block-diagram-model-predictive-control.webp)
![Fig. 2 Comparison of traditional control with MPC [4].](https://thumb-us.123doks.com/thumbv2/123dok_us/8728626.886146/2.612.57.276.524.673/fig-comparison-traditional-control-mpc.webp)