PREDICTION OF STUDENTS’ SUCCESS BY APPLYING
DATA MINING ALGORITHAMS
1
EDIN OSMANBEGOVIĆ, 2HARIS AGIĆ, 3MIRZA SULJIĆ
1
P.h.D., Faculty of Economics, University of Tuzla, Bosnia and Herzegovina
2P.h.D., Pedagogical institute, Tuzla, Bosnia and Herzegovina
3M.Sc., Coal Mine ''Kreka'', Tuzla, Bosnia and Herzegovina
E-mail: [email protected]@[email protected]
ABSTRACT
In education, an intelligent data analysis includes data mining methods which are applicable in different areas of education as a way of discovering implicit, previously unknown, and useful knowledge out of existing data with a sole goal, and it is, to make quality decisions. One of the classification methods in educational environment is prediction of students' success at the end of the second term. In this paper, we have shown survey results for a sample of 907 students who in 2011/2012 school year have attended secondary school in Tuzla Canton. We have analyzed three different models of students' success (Decision Tree, Naive Bayes and Multilayer Perceptron). We have also taken in account estimation of the variables which have influenced the students' success and we have checked them through four different filters. Cross validation is the method we used in the estimation of the classifications. To avoid unbalanced distribution of the class variable values in generating models of prediction, we have used SMOTE function and analyzed models generated from resampled data. It is possible, in our future researches, to include a greater number of input variables and increase the number of samples so it would be possible to create a more successful model, which can be the base for development of the support decision system at the secondary education level.
Keywords: Classification, Data mining, Making decision, Secondary school education
1. INTRODUCTION
The story of education can be a dramatic one in the case when the context is not respected, taken either in its narrow or broad sense [1], which does not mean that existing state in education has to be accepted. One has to struggle to reach better and high quality education.
Previous experiences have shown that even small and poor countries have found the way out of the crisis by continual investment in education (Ireland, Singapur, Israel). Government that does not understand this fact and postpones investment in education is actually incapable and irresponsible. Status quo is rather being preserved, because in that case one does not require any knowledge, only bureaucratic and autocratic behavior toward subordinates, particularly toward those who do not share their point of view. A long time ago Heraklit said ''nothing is eternal but changes'' [2]. Ratković continues with a statement that, if nothing changes in a society, it stagnates; so standing still without
progress is, according to this author, more dangerous than decline itself.
No change can be planned in advance, in a way that their effects could be observed before implementation of the change [3]. There is no recipe for successful introduction of any change. It is logical, because if there is a recipe, then all changes would be successful ones. It could be referred to other experiences, when one wants to make own decisions. It is very characteristic for education.
Changes in different systems of education are very often since they can be connected to the process of continuous improvement, which is one of the basic characteristic of the education. There are some demands from this environment for making assessment of the educational system not only by comparing students' final grade but by developing input elements in the system.
curriculum, teachers' competence, social ambient, etc. Ministries of education are faced with many problems and they have to make various decisions. Some of them are matter of death or life. The process of education is based on making tough decisions in all phases of it, starting with planning and strategically planning then testing specific areas right up to making plans of realization and then assessing the data achieved [4].
Yukl [5] puts decision making on the top of managers'/leaders' activities but [4] claims that making decision is basic role of a manager and it is based on being well informed, informational flow and predictability.
Results, obtained in this way, could have certain influence on the decision making process regarding
creation, implementation, and continuous
improvement of the policy of education. This is the case, particularly, regarding the assessment of the achieved level of educational standards.
We suggest a few possibilities:
the ratio of the age of the students and school
curriculum,
whether students live in an urban or rural area,
influence of the marital status of their parents on
the success of the students,
influence of the parental level of the education
and their employment status on the students' success,
number of the family members and their
housing status,
intensity of the school environment on the
professional orientation of the students,
whether students have to walk or travel to
school and dependence of the parental status on the professional orientation of the students.
We could try to answer to the question:
whether students' grants have either positive or
negative influence on students' success,
what is relation between the time of studying
and the students' success,
if the access to the Internet has positive effect
on the process of learning, and finally,
if there exist any influence of material status of
the student's family (average income) on the student's success.
The possibilities previously stated and answers suggested could cover any area of quality for which we need to make relevant decisions (rarely routine ones, even less intuitive, but mostly analytic) [6].
This paper, as it is stated in the beginning, has been dealing with the prediction of students'
learning results, so that the results, after being tested, could make influence on the quality of decisions in education at all levels. The aim is to predict student achievement and if possible to identify the key variables that affect educational success/failure.
As the sample in the conducted investigation was chosen systematically, i.e. social, economic and educational structure is, more or less, same in the entire territory of Bosnia and Herzegovina. The results and conclusions in the investigation can be of interest and may be valuable to those who make decisions in the area of education outside Tuzla Canton, which allows generalization of the results to the entire population.
Thus, the question is: is it possible to apply data mining algorithms for the prediction of school achievement and to which extent are those indicators adequate for building strategies for prevention of „bad reasons“ for poor school achievement ?
In order to find the answer, the impact of four algorithms for intelligent data analysis: C4.5, Random forest, Multilayer Perception and Naive
Bayes was examined. Algorithms were
implemented in order to create a model for prediction of school achievement at the end of the school year. The analysis was conducted after the algorithms were trained and tested which makes the conclusion about possible predictors for school achievement possible. Environment Weka data mining tools were used for application of chosen classifiers.
2. DATA DESCRIPTION
model of students' success keeping in mind that output variable is measured through average success. The distribution of the students' success is shown in Table I, while the input data comprise 19 variables which names and codes are shown in Table II.
Table I. Distribution of the students' success
Class Grade Student Percentage
A 5 419 46,20%
B 4 309 34,07%
C 3 167 18,41%
D 2 12 1,32%
Output variable-students' grades are grouped into five categories or classes in a way that final grade makes an entire class as shown in Tables II.
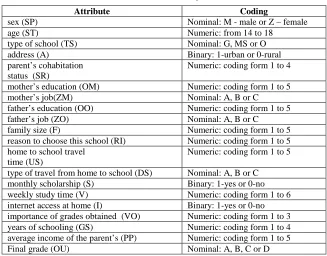
Table II. Input variables
Attribute Coding
sex (SP) Nominal: M - male or Z – female
age (ST) Numeric: from 14 to 18
type of school (TS) Nominal: G, MS or O
address (A) Binary: 1-urban or 0-rural
parent’s cohabitation status (SR)
Numeric: coding form 1 to 4
mother’s education (OM) Numeric: coding form 1 to 5
mother’s job(ZM) Nominal: A, B or C
father’s education (OO) Numeric: coding form 1 to 5
father’s job (ZO) Nominal: A, B or C
family size (F) Numeric: coding form 1 to 5 reason to choose this school (RI) Numeric: coding form 1 to 5 home to school travel
time (US)
Numeric: coding form 1 to 5
type of travel from home to school (DS) Nominal: A, B or C monthly scholarship (S) Binary: 1-yes or 0-no weekly study time (V) Numeric: coding form 1 to 6 internet access at home (I) Binary: 1-yes or 0-no importance of grades obtained (VO) Numeric: coding form 1 to 3 years of schooling (GS) Numeric: coding form 1 to 4 average income of the parent’s (PP) Numeric: coding form 1 to 5
Final grade (OU) Nominal: A, B, C or D
By choosing this formulation of the output variables we assign them to the problem of classification aiming this model to recognize students' belonging to the specific class.
3. METHODS
3.1. Knowledge Discovery from Data – KDD
Knowledge discovery from data is untrivial
process of discovering implicit, previously
unknown, potentially useful and understandable models out of the given data. It includes results, time saving, better understanding and acceptance of such projects results as KDD. This model is treated as standard process model. The process includes a lot of steps (one of the key steps is data mining) and possible retroactive connections. In other words, framing the knowledge discovery process inside the general form represents a concept of developing this specific model. The concept contains following characteristics:
the data are related to the facts,
the pattern represents a part of the data or a
model which is applicable on the data. (a model, which on a high level, describes a set of data). It also represents knowledge in the case it achieves a certain level of ''being interesting''.
untrivial means that we need to conduct
researches, conclusions; not only simple counting (for example, average value)
KDD is iterative process and it includes a few
stages
responsible steps in the data mining process by integrating and validating the best practices from
[image:4.612.92.541.137.211.2]different areas of industry. Sequential structure of the model is shown in the Figure 1.
Figure 1. The structure of Data Mining Process [8]
The CRISPM-DM (Cross Industry Standard Process for Data Mining) defines the process of knowledge discovery as an iterative one made out of a few phases and describes usual ways of dealing with specific problems used by experts from this field (Figure 2) [9]:
Figure 2. CRISP-DM model
Business understanding- it is necessary to see the problem from all angles which includes domain of the problem as well as what techniques of the data mining will be used for its solution. In both areas we try to find and understand limitations and other factors that may influence process and final results.
Data understanding - the purpose of this activity is to research basic structure of the data in order to get an idea about data values that can help us in resolving problem stated
Data preparation - in this phase, the most
critical is the choice of the observation units and variables, as well as different transformations
and data cleaning. The best information of the data is possible to get from the experts in the specific domain since they could, based on their previous experience and knowledge, show the most valuable data for model building.
Modeling - Modeling means making choice
among different modeling techniques and their application on the input data. Before modeling we decide which data are crucial for model building, which will be calibrated and which will be tested. The choice is random.
Evaluation - the assessment of the constructed models is conducted through data mining and observation problem domain. We try to reckon more important imperfections of the models and suggest ways of their removing. After revision, we establish readiness of the model for transition into final phase of knowledge discovery - results application
Deployment - this step is especially important in the case of every day’s use of the model in the resolved problem domain. Such models are very often applied on fresh data and their purpose is to monitor process, to assess data and to support decision making. In any case, it is important for a performer to be aware of the limits the model offers and all actions which are precondition for the successful application of the model.
3.2. Method of intelligent data analysis
[image:4.612.92.296.327.546.2]establish on, the data for model calibration and the data for testing of the model. To make it easy we divide the data set into three groups:
TRAINING SET - represent data on which the
model is based on,
VALIDATE SET - data needed for model
optimization and enhancing its performances,
TEST SET - data not used for model
construction but used for checking of the model.
If the data set was small, then there should be special methods for maximalisation of those data [10]. The choice of the specific observation units in the specific data set is random.
To evaluate predictive model, we have developed different functions of the grading (confusion matrix, cumulative lift charts, wrong classification possibility, square error sum). It is very important to decide if the data obtained are expression of the real state and if they are applicable. That decision is made by an expert from the field in question and the outcomes of that decision will be known after some period of time. The effects of such decision are difficult for measuring since it is very difficult to eliminate other parameters that effect final functioning of the system prearranged for data analysis. It is very important to mention that during the time from the moment of the building of the system and its use, characteristics of the model have degraded. The times span longer, the phenomenon more expressed. That's why we need to rebuild the model after some time. When we choose the methods we want to use in data analysis it is recommended to start from those simple ones. In the case we choose wrong method it is possible not to recognize some fundamental laws. For proper choice of the right method or an algorithm, we need to have an experience.
In this paper we have shown data classification, in detail. Data classification methods represent learning process of the function which mapped the date into one of some redefined classes. Each algorithm for classification based on inductive learning is given data set made of attribute value vector and their responding class. The goal of the classification techniques is to build a model that could classify future data on the premise of the specification string. We have compared three different methods for data mining: Decision Tree, Naive Bayes and Neural network.
There are many different classifications in literature and we cannot decide which is better because they differentiate in many aspects such as:
learning rate, amount of data for training, classification speed, robustness, etc. In this paper we investigated the impact of four algorithms for intelligent data analysis: C4.5, Random forest, Multilayer Perceptron and Naive Bayes. By using these algorithms we have created classification models aimed to predict the class (students' success) which the some new unidentified sample will belong to. The three chosen classification techniques are found the most suitable way to predict student's success.
The most common and today probably the most widely used decision tree algorithm is C4.5. Professor Ross Quinlan has developed a decision tree algorithm known as C4.5 in 1993; it represents the result of research that traces back to the ID3 algorithm (which is also proposed by Ross Quinlan in 1986). C4.5 has additional features such as
handling missing values, categorization of
continuous attributes, pruning of decision trees, rule derivation and others. Basic construction of C4.5 algorithms use a method known as divide and conquer to construct a suitable tree from a training set
S
of cases [11]:If all the cases in
S
belong to the same class orS
is small, the tree is a leaf labeled with the most frequent class in
S
.Otherwise, choose a test based on a single
attribute with two or more outcomes. Make this test the root of the tree with one branch for each
outcome of the test, partition
S
intocorresponding subsets
S
1,S
2,…
according to theoutcome for each case, and apply the same procedure recursively to each subset.
There are usually many tests that could be chosen in this last step. C4.5 uses two heuristic criteria to rank possible tests: information gain, which minimizes the total entropy of the subsets and the default gain ratio that divides information gain by the information provided by the test outcomes [11].
Random forest algorithm (RF) is multiply useful algorithm for data classification able to classify enormous quantity of data with high accuracy. The algorithm was originally written in Fortran 77 and the creator of the algorithm was Professor Leo Breiman of Berkeley University. Random forest algorithm is statistics method based on tree building decision. The basic idea of the algorithm is to use multitude of trees (quantifiers) instead of only one. To qualify new date out of the input vector it has to go through all the trees in the
classificatory (tree) has to make decision of the class (trees vote for a class). The forest makes the decision in favor of specific classification according the number of votes. After all the trees cast their vote the date will be classified in the class which has got the most votes. Taking in consideration that all the classificatory are mutually independent it is possible to make algorithm parallel.
Naive Bayes algorithm (NB) is a simple method for classification based on the theory of probability, i.e. the Bayesian theorem [10]. It is called naive because it simplifies problems of relying on two important assumptions: it assumes that the prognostic attributes are conditionally independent with familiar classification, and it supposes that there are no hidden attributes that could affect the process of prediction. This classifier represents the promising approach to the probabilistic discovery of knowledge, and it provides a very efficient algorithm for the data classification.
Multilayer Perceptron (MLP) algorithm is one of the most widely usable and popular neural networks. The network consists of a set of sensory elements that make up the input layer, one or more hidden layers of processing elements, and the output layer of the processing elements [10]. MLP is especially suitable for approximating a classification function (when we are not so much familiar with the relationship between input and output attributes) which set the example determined by the vector attribute values into one or more classes.
Results, got by deep analysis, can be assessed primarily on the evaluation of experimental results [12]. Classificatory evaluation refers to the measurement of its efficiency i.e. classificatory ability to regularly distribute as many samples as possible out of the test set. The specification of the data sets relevant to knowledge discovery are not class property but rather defect caused by the set choice so the test set evaluation can result in the imprecise evaluation of the error frequency. The basic way of avoiding these anomalies is multiply repeated evaluation process on the test set by using different randomly chosen learning sets and test sets, and then averaging the evaluation of the error frequency [13].
Cross validation is based on this principle with some sort of replacement of learning set and test set in each iteration. We have used 10-fold cross validation in this work. During the 10-fold cross
validation procedure we have, initially, divide the initial set in ten mutually different partitions of the approximately same size according the random choice principle. The procedure itself is iterative with the constrains that, in each iteration, nine partitions are used as learning set and one partition is used as a test set. The procedure is repeated ten times so each partition is once in the role of the test set. The average error frequency got in all ten iteration of the procedure represents the grade of the real error frequency in the classification model. During the division of the initial set into ten partitions it is usual to modify the random choice procedure in the way that best suits equal representation of the classes in each partition. This procedure is called stratification and its basic purpose is to improve the representation of each partition in the classification model. The number of the partitions, i.e. iteration of the cross validation depends on computer conducted complexity of the classification model evaluation by using this method since each iteration includes separation of construction and testing of the model.
4. EXPERIMENT RESULTS AND
DISCUSSION
In the previous chapters, we have listed the techniques used in the process of the knowledge discovery from data. The aim is to construct model, out of the data given, which will be able to predict student affiliation to the specific class in the case when the sample is unknown. We have used software WEKA (Waikato Environment for Knowledge Analysis) developed at Waikato University (New Zealand) for this research. The analysis has been conducted in the following way:
to evaluate input attribute according to predicted
attribute,
to analyses each of four algorithms for data set,
The purpose of these analyses is to decide which set of the parameters gives the best results.
4.1.Evaluations of the input attribute importance
attribute value leaning against on heuristics based on input general properties. Filter methods are more practical solution for data mining for following reasons: time needed for choice and evaluation of the data is shorter, independence of the computer studying algorithms enables its application, in combination with any technique, in data modeling.
We have applied four filter methods: Hi-square test, OneR test, InfoGain test and Gain Ratio test. The results of each test are followed by application of next terms: Attribute (name of the attribute),
Merit (measure of kindness), Merit dev
(disproportion–measure of kindness deviation), Rank (the average position of the attribute) and
Rank dev (disproportion-attribute position
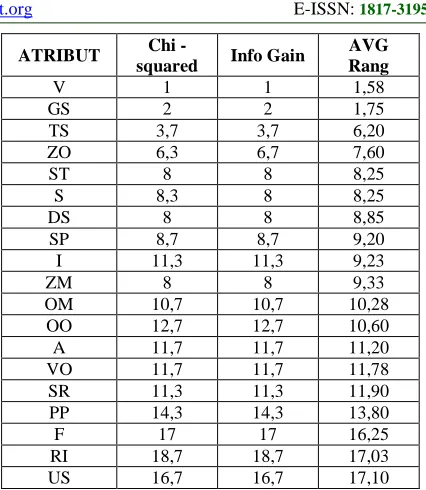
deviation). Since different methods give different results, i.e. each of them calculates attribute relevance in different way, so, as a final result of attribute rank we have taken average value of all algorithms rather than to choose one algorithm and put all our hopes in it. Table 3 shows the results got in this way with their values.
In the table like this with summary results it is not possible to use ''merit'' columns since the
algorithms applied do not use mutually
[image:7.612.307.520.77.322.2]incompatible measures. The goal of this analysis is to determine importance of each attribute taken separately. Table 3 shows that attribute V (weekly study time) influences the output variable the most, and it has shown the best performances for three out of four possible tests.
Table III. Estimation results and attribute ranking
ATRIBUT Chi
-squared Info Gain
AVG Rang
V 1 1 1,58
GS 2 2 1,75
TS 3,7 3,7 6,20
ZO 6,3 6,7 7,60
ST 8 8 8,25
S 8,3 8 8,25
DS 8 8 8,85
SP 8,7 8,7 9,20
I 11,3 11,3 9,23
ZM 8 8 9,33
OM 10,7 10,7 10,28
OO 12,7 12,7 10,60
A 11,7 11,7 11,20
VO 11,7 11,7 11,78
SR 11,3 11,3 11,90
PP 14,3 14,3 13,80
F 17 17 16,25
RI 18,7 18,7 17,03
US 16,7 16,7 17,10
4.2.Analysis of Classification Model for Students' Success Prediction
The task of the third segment of our research is the choice of most suitable data mining algorithm model. Experiment has also been conducted by application of WEKA software package. We have chosen C4.5, Random Forest, Multilayer Perception and Naive Bayes as data mining algorithms for our experiment. By using the previous experiment results we have adopted approach to remove attributes one by one from input data base for each of four different classification algorithms of data mining. The grade and comparison of results each of four different data mining algorithms has been conducted through ten-fold cross validation. We have conducted nineteen experiments for each of four chosen algorithms or, in total; we have done
seventy-six experiments with belonging
Figure 3. Algorithm comparison in aimed attribute prediction
Previous table shows how each of these models react to in dependence of the input attribute number, so it is easy noticeable that the highest percentage of right prediction for different algorithms is different too. So, we can fully claim
[image:8.612.98.517.369.440.2]that the best results are achieved for different algorithms and models with different number of data inputs. Figure 3 shows that the most accurate model of prediction is created by application of J48 classificatory.
Table IV. Classificatory comparison
CCI (%)
ICI
(%) TP FP P R FM ROC
J48 (13) 52,59 47,41 0,53 0,28 0,51 0,53 0,52 0,65
RF (17) 51,05 48,95 0,51 0,31 0,49 0,51 0,50 0,66
NB (17) 52,26 47,74 0,52 0,29 0,51 0,52 0,51 0,67
MLP (3) 52,04 47,96 0,52 0,29 0,50 0,50 0,51 0,67
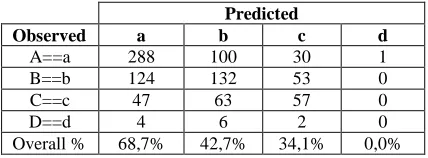
J48 classificatory has generated a model with 52.59% correctly classificated examples (CCI), accuracy of 51% (0.51) and classification above the ROC curve area (0,65>0.5). It has been generated a confusion matrix for J48 classificatory (Table 5). The four cases of nominal class attribute for final grades are labeled in letters A=excellent, B= very good, C= good, D=sufficient. The number of correctly classified examples can be found on the matrix diagonal while the other elements of the matrix mark the number wrongly classified examples which represent one of the classes left. We can see from Table V. that there is certain unbalance in the distribution of output class value, and that the smaller classes accuracy is less predictive that than of bigger classes. For example, number of the students predicted to get grade sufficient (class D) is even 288 times smaller than the number of the students who are predicted to get excellent (class A), so, accuracy of these classes are 0.0 and 68.7 respectively.
Table V. Confusion matrix of J48 classificatory
Predicted
Observed a b c d
A==a 288 100 30 1
B==b 124 132 53 0
C==c 47 63 57 0
D==d 4 6 2 0
Overall % 68,7% 42,7% 34,1% 0,0%
In the case of unbalanced data set, the examples of smaller classes are more difficult for training (knowledge discovery). To solve this problem we
have used SMOTE (Synthetic Minority
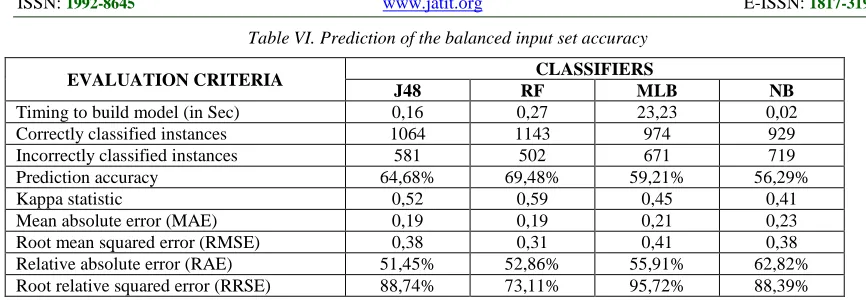
Oversampling Technique) function for data set balancing. In this way we have improved balance in data distribution that affected results of algorithms applied. Table IV. shows the prediction of
classificatory accuracy after using SMOTE
[image:8.612.307.521.464.543.2]Table VI. Prediction of the balanced input set accuracy
EVALUATION CRITERIA CLASSIFIERS
J48 RF MLB NB
Timing to build model (in Sec) 0,16 0,27 23,23 0,02
Correctly classified instances 1064 1143 974 929
Incorrectly classified instances 581 502 671 719
Prediction accuracy 64,68% 69,48% 59,21% 56,29%
Kappa statistic 0,52 0,59 0,45 0,41
Mean absolute error (MAE) 0,19 0,19 0,21 0,23
Root mean squared error (RMSE) 0,38 0,31 0,41 0,38
Relative absolute error (RAE) 51,45% 52,86% 55,91% 62,82%
Root relative squared error (RRSE) 88,74% 73,11% 95,72% 88,39%
Data analysis can confirm that prediction of the balanced input set accuracy is, in the case when we apply both classificatory, significantly enhanced, and the classification of the tree decision has created more accurate model. More detailed analysis of the data distribution is shown in the confusion matrix (Table VII).
Table VII. Confusion matrix of RF classification in percentages
Predicted (%) Observed a b c d
A==a 68,02 23,63 7,16 1,19 B==b 33,65 44,39 17,42 0,24 C==c 12,65 18,85 66,59 1,43 D==d 1,19 0,72 1,67 93,79
Analysis of Learning time attribute (V)
Table VIII. Learning time depending on correct prediction of students’ success
V>2,3 V<2,3
Grade Student Predicted Grade Student Predicted
A==5 19,52% 79,23% A==5 15,80% 50,32%
B==4 30,18% 47,26% B==4 20,39% 45,50%
C==3 20,42% 60,29% C==3 28,64% 70,11%
D==2 9,76% 90,77% D==2 35,17% 97,39%
Table VIII shows that the degree of correct grade prediction is in strong dependence of learning time attribute (V). Increase in learning time is followed by improving of correct prediction for
excellent students (V>2.3→A = 5 ; 70.11%). Such
a good results for excellent students is the consequence of small input set (1.32%) and application of SMOTE function. Reasons for such results for very good students should be looked for in additional researches aimed to establish why the dependence of the learning time attribute is the subject of so small variation.
[image:9.612.315.519.497.564.2]Analysis of Years of schooling attribute (GS)
Table IX. Dependence of years of schooling from correct students' success prediction
GS Student Average success
Predicted average success
1 29,40% 3,96 4,08
2 38,09% 3,37 3,44
3 32,62% 3,25 3,25
Table IX points on small change between real average success and predicted average success which shows that for a generated attribute model, years of schooling (GŠ) have strong influence on students' success (OU).
Type of school analysis (TŠ)
Table 10. Dependence of school type (TS) from correct students' success prediction
Class Percentage of students by TŠ
Percent of correct prediction
by Grade
A B C D
G 10,16% 65,68% 85,00% 37,78% 39,13% 0,00%
M 67,38% 69,29% 58,82% 51,58% 70,48% 95,91%
We can see in the Table 10 that the average degree of correct prediction has variation of 6.14% depending on the school type (TŠ). In a more detailed analysis of correct prediction percentage according type of school (TŠ) and students' success(OU),we notice following:
10.16% students attend grammar school: it
means that classificatory has generated model with 85% accuracy for class A(excellent students) while the other classes are classified with 39.13% of accuracy
67.38% students attend comprehensive schools;
it means that classificatory has generated model with 70.48% accuracy and 95.91% of correctly predicted classes C and D, while the accuracy of (OU) for other classes is not more than 58.82%,
22.46% attend other schools; it means that
classificatory has generated model with 74.07%, accuracy, 60.76% and 97.83% correctly predicted classes A,C and D while the accuracy for class B is 30.99%
From the data given we can see that the type of school attribute (TŠ) is very influential on the success of the students in grammar school for grade A and grades C and D in comprehensive and other schools.
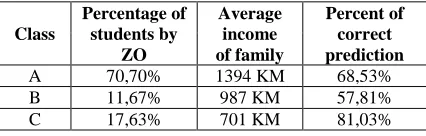
Type of paternal job attribute (ZO)
Table XI. Dependence of paternal type of job from correct students' success prediction (OU)
Class
Percentage of students by
ZO
Average income of family
Percent of correct prediction
A 70,70% 1394 KM 68,53%
B 11,67% 987 KM 57,81%
C 17,63% 701 KM 81,03%
The percentage of correctly predicted students' success (OU) expressed in relation to paternal job attribute is shown in Table 11, so we have got the following results:
70.7% fathers are employed which means that
classificatory has generated model with 68.53% correctly predicted examples
11,6% fathers work which means that
classificatory has generated model with 75.81% correctly predicted examples,
17.63% fathers are unemployed which means
that classificatory has generated a model with 81.03% correctly classified examples.
So, from all these, we can make conclusion that paternal job attribute (ZO) exercises considerable influence on students' success (OU), especially, among those whose parents are unemployed
5. CONCLUSION
Education is crucial and the biggest capital of any society. Intelligent data analyses enable a high level of knowledge extraction out of data, so it offers big possibilities in the domain of education. Conducted research has been aimed to improve efficient knowledge discovery and as such could be helpful in making quality decisions in management of education.
Despite modern technology of data mining, additional interpretation of the results are the subjects of human decisions. The experience acquired during this research shows the importance of association with experts in that domain, which makes easier getting structure and meaning of the data needed for analysis but also, speeds up and directs process of data preparation. Principally, DM methods offer an elegant and sometimes only way for discovering knowledge hidden in these data but only in the hands of experts. Finally, results of data mining get meaning in the case that they offer meaning to the final user (an expert in the specific domain), i.e. if they offer new information, and, depending of the focus of research speeds up the research directing it in the specific direction. Knowledge is the product of acceptance of algorithm results as much as the experience adopted during the collection of the data and developing of the algorithm base.
Intelligent data analysis of the input algorithms has shown that learning time, years of schooling, type of school and paternal employment are among the most important factors in prediction of students' success (OU). From the point of view of an expert, the aim of this analysis is to present a method for reducing dimensional complexity of knowledge discovery in data sets that are often found in the analysis and, in this way, point to importance of some attributes to school managements and
authorities in education. The example of
[image:10.612.88.301.472.540.2]important attributes aimed on their improvement in future research.
By applying these methodologies in education, we have considerable improved making efficient, useful and, in practice, conductible decisions in order to improve learning results with the ultimate goal of making students and decisions makers independent and responsible for own decisions. The results got could represent the basis for some future research, so with bigger number of input attributes and samples we could create more successful model that would be base for building of a support decision system at the secondary education level.
REFERENCE:
[1] A. Trnavčevič, “O kakovosti še malo drugače, Raznolikost kakovosti”, Šola za ravnatelje, 2000.
[2] M. Ratković, “Uspešan direktor škole,
strategije obrazovnih reformi”, Naučna knjiga,
Beograd, 2000.
[3] M. Fullan, “The New Meaning of educational
Change” (3th ed.), Teachers College Press, NewYork, 2001.
[4] M. Tavčar, “Strateški managemet”, Visoka
šola za management v Kopru, 2002.
[5] G. Yukl, “Leadership in organizations” 4th ed.,
Prentice-Hall, New Jersey, 2009.
[6] H. Agić, el al., “Vođenje u obrazovanju”, JU
Narodna biblioteka „Alija Isaković“ Gradačac,
Gradačac, 2006.
[7] H. Agić, “Provedenom istraživanju među
maturantima srednjih škola Tuzlanskog
kantona”, Pedagoški zavod Tuzlanskog kantona, Tuzla, Report, 2012.
[8] K.J. Cios, W. Pedrycz, R.W. Swiniarski &
L.A. Kurgan, “Data Mining: A Knowledge Discovery Approach”, Springer Science and Business Media, New York, 2007.
[9] P. Chapman, J. Clinton, R. Kerber, T. Khabaza,
T. Reinartz, C. Shearer & R. Wirth, “CRISP-DM 1.0 Step-by-step data mining guide”, ftp://ftp.software.ibm.com/software/analytics/s pss/support/Modeler/Documentation/14/UserM anual/CRISP-DM.pdf
[10]I. Witten & E. Frank, “Data Mining: Practical Machine Learning Tools and Techniques” (2nd edn), Morgan Kaufmann, San Francisco, 2005.
[11]X. Wu & V. Kumar, “The Top Ten Algoritms
in Data Mining”, Chapman and Hall, Boca Raton, 2009.
[12]M. Domazet-Lošo, “Usporedba postupaka
dubinske analize primijenjenih nad biološkim podacima”, M.Sc. Thesis, University of Zagrebu, 2006.
[13]R. Kohavi, “A Study of Cross-Validation and
Bootstrap for Accuracy Estimation and Model
Selection”, Proceedings of the 14th
![Figure 1. The structure of Data Mining Process [8]](https://thumb-us.123doks.com/thumbv2/123dok_us/8913630.960604/4.612.92.296.327.546/figure-structure-data-mining-process.webp)