M E T H O D O L O G Y
Open Access
Bayesian dose selection design for a
binary outcome using restricted response
adaptive randomization
Caitlyn Meinzer
1*, Renee Martin
1and Jose I. Suarez
2Abstract
Background: In phase II trials, the most efficacious dose is usually not known. Moreover, given limited resources, it is difficult to robustly identify a dose while also testing for a signal of efficacy that would support a phase III trial. Recent designs have sought to be more efficient by exploring multiple doses through the use of adaptive strategies. However, the added flexibility may potentially increase the risk of making incorrect assumptions and reduce the total amount of information available across the dose range as a function of imbalanced sample size.
Methods: To balance these challenges, a novel placebo-controlled design is presented in which a restricted Bayesian response adaptive randomization (RAR) is used to allocate a majority of subjects to the optimal dose of active drug, defined as the dose with the lowest probability of poor outcome. However, the allocation between subjects who receive active drug or placebo is held constant to retain the maximum possible power for a hypothesis test of overall efficacy comparing the optimal dose to placebo. The design properties and optimization of the design are presented in the context of a phase II trial for subarachnoid hemorrhage.
Results: For a fixed total sample size, a trade-off exists between the ability to select the optimal dose and the probability of rejecting the null hypothesis. This relationship is modified by the allocation ratio between active and control subjects, the choice of RAR algorithm, and the number of subjects allocated to an initial fixed allocation period. While a responsive RAR algorithm improves the ability to select the correct dose, there is an increased risk of assigning more subjects to a worse arm as a function of ephemeral trends in the data. A subarachnoid treatment trial is used to illustrate how this design can be customized for specific objectives and available data.
Conclusions: Bayesian adaptive designs are a flexible approach to addressing multiple questions surrounding the optimal dose for treatment efficacy within the context of limited resources. While the design is general enough to apply to many situations, future work is needed to address interim analyses and the incorporation of models for dose response.
Keywords: Dose selection, Response adaptive randomization, Phase II, Adaptive design, Bayesian design, Clinical trial
Background
In the context of a drug development program, the goals of a phase II clinical trial are arguably the most nebulous and most critical. In phase I, the number of subjects exposed to a drug are limited, and the goals are most often focused on assessing safety and identifying a maximum tolerated dose. As the drug progresses to phase III, the number of
*Correspondence: [email protected]
1Data Coordination Unit, Department of Public Health Sciences, Medical University of South Carolina, 135 Cannon Street, Charleston, SC, USA Full list of author information is available at the end of the article
resources (cost, sites, subjects) is significantly increased to definitively test whether the new drug is superior to a con-trol using a clinically meaningful outcome. A chasm exists between these phases in which investigators must resolve numerous scientific and practical questions, including whether the maximum tolerated dose is also the maxi-mum effective dose, and whether the selected dose shows sufficient promise to justify expending the resources for a phase III trial.
The definition of “dose” can have multiple compo-nents — intensity, duration, frequency, and whether the
drug is administered as a constant volume or some vari-able algorithm (e.g., loading and maintenance doses). Fur-thermore, the choice of dose may be defined as discrete options or on a continuous range. It is impossible to investigate all of these aspects in a single trial. Investi-gators must decide, based on the scientific premise and previously collected safety data, which dose should be evaluated for a signal of efficacy. Several approaches have been suggested in the literature, including phase I/II tri-als that search over a range of doses to identify the dose which optimizes safety and efficacy [1], methods that rank and select from a set of candidate doses [2], and hybrid designs that incorporate both aspects [3]. Regardless of the specific design, a trade-off exists between the breadth and depth of information collected about the efficacy of the doses under consideration.
Although several authors [4–6] have shown that testing more treatments with fewer subjects per arm increases the probability of identifying an efficacious treatment, this also leads to less precision in the resulting estimate of treatment effect. Response adaptive randomization (RAR) designs have been proposed as a more ethical alterna-tive by which patients are more likely to be randomized to the best performing arm [7, 8]. In the context of dose selection, RAR also allows investigators to collect more information on the dose(s) that are most likely to pro-ceed forward to phase III, though at the cost of loss of information in other regions of the dose-response curve [9, 10]. There is not, however, a consensus that RAR is an improvement over fixed allocation when comparing a single treatment to control; critics note that the adaptive algorithm results in reduced power to test a hypothe-sis comparing the selected treatment arm to the control arm [11]. As a result, several authors have proposed con-strained RAR algorithms that allow more subjects to be allocated to the best performing arm while retaining desir-able study design characteristics such as power [12–15]. Finally, note that it is assumed here that a trial using RAR is based on an endpoint which is directly relevant to patient health. (For a robust discussion on the ethics of RAR, see [16]).
The current manuscript considers a trial wherein inves-tigators wish to first select from a range of possible active doses before evaluating whether the selected dose is suf-ficiently promising when compared to a control group to warrant a phase III trial. Borrowing from the adap-tive design literature, the proposed design uses RAR to allocate subjects to the most promising dose. However, throughout the duration of the study, the number of sub-jects allocated to the active doses versus control is held constant to protect the power for a test comparing the selected active dose arm and the control arm. The pro-posed design is described in detail below. To provide context for the design, an example trial for subarachnoid
hemorrhage is described. Subsequently, different parame-terizations of the design are considered and their relative properties discussed.
Study design
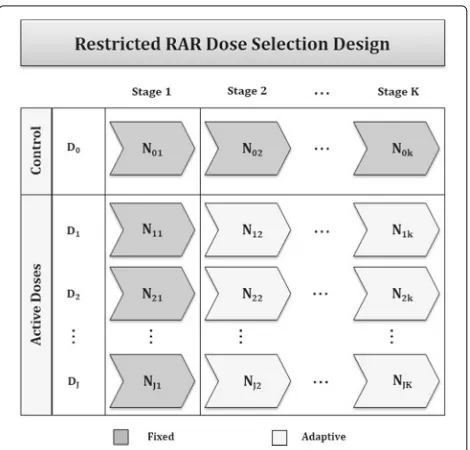
Consider a trial where investigators wish to randomize a total of N subjects to a control arm (D0) andJ active dose armsD1,. . .,DJ
at each ofKstages, with the goal of assessing whether the active treatment can reduce the proportion of bad outcomes in the disease of interest. In the proposed design (Fig. 1), the total number of subjects is partitioned in the following ways, whereNjk represent
the number of new subjects randomized to thejtharm at thekthstage.
First, the proportion of subjects randomized to the con-trol arm and the pooled active arms is held at a constant ratio throughout the trial. That is,
N01
J j=0Nj1
=. . .= N0K
J j=0NjK
=
K k=1N0k
K k=1
J j=0Njk
,
and
J j=1Nj1
J j=0Nj1
=. . .=
J j=1NjK
J j=0NjK
=
K
k=1
J j=1Njk
K k=1
J j=0Njk
.
Second, to ensure that estimates of the effect size for each active dose are stable, a burn-in period is required wherein the number of subjects allocated to each of the active doses is fixed during stage 1. This number is
[image:2.595.305.540.472.697.2]specified to reflect the desired trade-off between the risk of randomizing subjects to a suboptimal dose and the degree of flexibility in the design. Thus, for stage 1,
N11=. . .=NJ1. For stages 2 through K the number of subjects randomized to each of the active doses is:
Njk=rjkN.k, 0≤rjk≤1, J
j=1
rjk =1
where rjk is the allocation ratio to the jth active dose
at the kth stage as defined by the RAR allocation ratio, and N.k is the total number of subjects
allo-cated to the active dose arms for stage k, that is,
N.k =Jj=1Njk.
The following sections describe how to estimate the treatment effect for each arm and set the RAR algorithm, as well as how the choice of partition for active and control arms, fixed and adaptive stages, and aggressiveness of the RAR algorithm will affect the design properties. For sim-plicity, it is assumed that each of the adaptive stages are equally spaced,N02 = . . . = N0K andNj=1Nj2 = . . .=
N
j=1NjK. It is straightforward to generalize the design
to the case of interim updates that are not equally spaced.
Methods
For Bayesian trials, the fundamental unit of analysis is the posterior probability of an event for each of the arms to which a subject may be randomized,D0,. . .,DJ. From
this, secondary quantities can be derived, including the probability that each active dose yields the maximal effect, the probability that a treatment difference comparing an active dose to the control is greater than a minimal clin-ically significant difference, and the relative allocation of subjects. The approach to calculating these quanti-ties is first discussed, followed by a comparison of their application in different RAR schemes.
Posterior probability of treatment effect
The primary outcome measure is the proportion of subjects who experience an event within the follow-up period, where the goal of treatment is to reduce this proportion when compared to the proportion of events in the control arm. As is true of any trial, the treat-ment effect in each arm can be estimated using simple summary statistics (i.e., the proportion of events in each arm) or as estimates from a model, with dose mod-eled alternatively as a categorical or continuous func-tion. Here, the simple case is presented where the effect of each dose is estimated independently. Generaliza-tions to model-based methods of estimation are dis-cussed in the “More complex dose selection algorithms” section.
The prior probability of observing an event in each of the j treatment arms has an independent uniform beta distribution:
πθj
∼Beta(1, 1),j=0,. . .,J.
This distribution is chosen to be uninformative, and can be alternatively interpreted as having observed two subjects worth of data where one subject has an event and the other does not. At the kth analysis, Yj total
subjects have experienced the event of interest out ofNj
total subjects randomized to the jth arm, which can be described as a binomial likelihood whereYj and Nj are
taken to represent the sum of events up to thekthstage
i.e.,Nj=Nj1+. . .+Njk, andYj=Yj1+. . .+Yjk
. Thus, the posterior probability distribution of an event in each arm is
πθj|Yj,Nj
∼Beta1+Yj, 1+Nj−Yj
.
Given the posterior probability for each treatment arm, it is now possible to calculate the probability that each active dose is the most effective (i.e., the basis of the RAR algorithm) and the probability that a given dose, when compared to control, is sufficiently promising for further investigation (i.e., the primary outcome).
Response adaptive randomization (RAR) algorithm The goal of the RAR algorithm is to randomize the maxi-mum number of subjects to the most effective active dose,
D1,. . .,DJ. Initial estimates of the posterior probability
are made using the data observed from theNj1subjects enrolled to each of thej > 0 active doses in stage 1. For each subsequent stage,k = 2,. . .,K, the RAR algorithm updates the allocation ratiosrjk such that more subjects are randomized to the dose which has the greatest proba-bility of a favorable outcome (i.e., a smaller proportion of events).
Probability of maximum treatment effect
After each of thekstages, the probability that each active dose yields the maximum treatment effect (i.e., the great-est reduction in poor outcomes), denotedPθj=θmin
, is estimated as:
P(θ1=θmin)=
1
0 π (θ1|Y1,N1)P
θ2,. . .,θj> θ1
∂θJ. . . ∂θ2∂θ1
= 1
0 π (θ1|Y1,N1)
1
θ1π (θ2|Y2,N2)· · ·
1
θ1π
θJ|YJ,NJ
∂θJ. . . ∂θ2∂θ1
P(θ2=θmin)=
1
0 π (θ2|Y2,N2)
1
θ2π (θ1|Y1,N1)· · ·
1
θ2π
θJ|YJ,NJ
∂θJ. . . ∂θ1∂θ2
. . .
PθJ=θmin=
1
0 π
θJ|YJ,NJ
1
θJ
π (θ1|Y1,N1)· · ·
1
θJ πθ(J−1)|Y(J−1),N(J−1) ∂θ(J−1). . . ∂θ1∂θJ.
The probability is estimated through simulation from the empirical distribution. Note that the interest is in esti-mating which active dose is the most effective; as a result, it is not necessary to compare the active doses to the control group in this calculation.
RAR algorithm
Although the goal of the RAR algorithm is to allocate the majority of subjects to the most promising active dose arm, if the algorithm is overly sensitive to spurious trends in the observed outcome rates, there is an increased risk of allocating an excess of subjects to a suboptimal dose. At stagekwe define a raw weightIjkfor each active dose
arm,j > 0, as a function of the probability that the arm is the best, and the standard error of the treatment effect, where the sensitivity of the algorithm is determined by two tuning parameters,γ andλ:
Ijk =
Pθj=θmin
γ Varθj
Nj+1
λ
.
Note that this equation is comparable to other RAR algorithms currently proposed in the literature [17–19].
Once the raw weight Ijk has been estimated for each
active dose, the allocation ratio is rescaled so the final ratio
rjkfor each active dose arm sums to 1. That is, for stagek:
rjk = Ij
J j>1Ij
Whenγ,λ = 0 the RAR allocation ratios are equiva-lent to fixed equal allocation among the doses (i.e.,Ij= 1
which impliesrjk=1/(J−1)).
Primary analysis
The primary analysis is based on the posterior probability that the absolute risk difference of an event, comparing the selected dose to the control, is greater than a minimum clinically interesting difference,C. Here, the selected dose is identified as the dose most likely to reduce the number of poor outcomes. That is, define the primary analysis as
Pθj−θ0>C
, wherej = maxPθj=θmin
, and the posterior probability is calculated as:
Pθj−θ0>C
=
1 0 π (θ1|
Y1,N1)
×
θj−C
0 π (θ0|
Y0,N0) ∂θ0∂θj.
If this posterior probability exceeds the prespeci-fied cutoff, ε, the null hypothesis H0:θj−θ0>C is rejected with ε100% level of certainty. For instance,
P(θj−θ0>0) >0.8 can be interpreted as at least 80% probability that the absolute risk difference is greater than 0 (i.e., 80% probability that the selected dose is no worse than the control).
Finally, note here that while this procedure makes no explicit assumptions about the relative ranking of the effect size for each active dose, D1,. . .,Dj, it is implied
that the dose j which satisfies j = maxPθj=θmin
also maximizesP(θj− θ0 > C). This is true so long as
θ0≤ {θ1,. . .,θj}. Similarly, because the posterior
probabil-ity is one-sided, this is true regardless of whether the effect size in the control is better than some doses and worse than others (e.g.,θ1 << θ0 < θ2 < . . . < θj). However,
if the posterior probability were structured as a two-sided hypothesis (e.g.,P(θj−θ0 = C)), it would still be desir-able to select j = maxPθj=θmin
despite no longer maximizing the power to reject the null hypothesis.
ALISAH II: albumin in subarachnoid stroke
The impetus for this design is a phase II trial in sub-arachnoid hemorrhage, a common neurological emer-gency with high morbidity and mortality rates, and several common neurological complications including aneurysm rebleeding, hydrocephalus, and delayed cerebral ischemia [20]. Despite the number of patients affected by subarach-noid hemorrhage and the poor prognosis, few treatments have been developed to improve outcomes and reduce hospital stay [21]. Recent clinical trials investigating com-pounds such as endothelin-1 antagonists and magnesium sulfate have led to disappointing negative results [22–24]. The failure of these clinical trials may be due in part to the fact that most of the treatments tested are posited to have limited mechanisms of action. Given the com-plex cerebral cascade of events unleashed by subarachnoid hemorrhage, the administration of a multifunctional sub-stance with the potential to target multiple pathways is compelling. Intravenous administration of 25% human albumin (referred to hereafter as albumin) is one such potential treatment.
magnitude [25]. In this study, albumin was administered for up to 7 days, and an optimal dose of 1.25 g/kg/d of albumin was identified as safe, feasible to administer, and associated with reduced resource utilization and possible neuroprotective effects [25, 26]. However, evidence from both the ALISAH pilot trial [25] and the Albumin in Acute Stroke trial (ALIAS, Parts 1 and 2, ClinicalTrials.gov registration number NCT00235495) [27–29], which evaluated albumin in ischemic stroke patients, suggested that administration of albumin could have deleterious cardiovascular effects due to volume overload [25, 29]. Thus, although the ALISAH pilot study demonstrated that the selected dose administered for up to 7 days was tolerable, questions remain regarding the optimal efficacious duration of continuous infusion. Specifically, it is possible that a longer duration of infusion may be associated with increased adverse events (e.g., acute left heart failure due to volume overload) [25–29].
In the currently proposed study (ALISAH II), investiga-tors want to identify the optimal duration (1, 3, 5, or 7 days) of albumin to administer in subjects with subarach-noid hemorrhage and test whether there is preliminary evidence of efficacy for this optimal duration when com-pared to a saline infusion control. The goal of treatment is to reduce the proportion of subjects with poor outcome, defined as an Extended Glasgow Outcome Scale score ≤4 observed at 90 days. The proposed phase II Bayesian restricted RAR design is presented in the context of the ALISAH II trial development with specific focus on the key design considerations.
Results
To calculate the total sample size, several quantities must be specified a priori including the expected rate of events in the control group, the clinically meaningful effect dif-ference, and the desired design properties (i.e., type I error rate, power, and/or probability of correctly selecting the best dose) [30]. For simple designs, this information is sufficient. However, for the proposed design, there is no closed-form equation for the total sample size, nor is it immediately obvious how to allocate the total sample size among the arms or stages given a total sample size. Instead, an iterative approach is used to first identify a crude estimate for the total sample size, which is then optimized using a series of diagnostic measures.
Total sample size
For phase II trials, a Go, No-Go criteria is predefined as the minimum level of evidence to warrant a phase III trial. That is, for this design the study results would support progressing to phase III with the selected dose if P(θmin−θ0>C) exceeds a prespecified level. Thus, a key operating characteristic is the probability that the trial will achieve this threshold under null and alternative
distributions for treatment effect (i.e., the type I error rate and power).
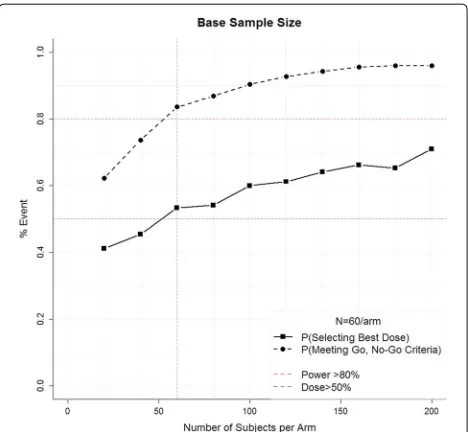
A crude estimate of the total sample size is first estimated by fixing the number of stages as K = 1 and equally allocating the total number of subjects among the four active arms and control (i.e.,N01=
N11=. . .=NJ1=N/5
. The total sample size is the minimumNthat yields the desired probability of selecting the best dose and probability of meeting the Go, No-Go criteria under the alternative hypothesis. Figure 2 demon-strates this process for ALISAH II, where investigators hypothesize that the event rate in the control group will be 28%, the clinically meaningful reduction is 10%, the effect rate among the doses is linear (i.e., 25.5%, 23%, 20.5%, 18%), and there is a minimum 50% probability of select-ing the correct dose (blue line) and an 80% probability of meeting the Go criteria (Pθj−θ0>0
> 0.8, red line). With 1000 simulations each, sample sizes ranging from 20 subjects per arm to 200 subjects per arm were considered. A total of 60 subjects per arm was identified as the minimum sample size that achieves the desired prop-erties. Note that as the sample size per arm increases, the probability of meeting the Go, No-Go criteria (i.e., power) increases until approximately 60 subjects, after which point there are diminishing returns of adding addi-tional subjects. However, if selecting the optimal dose is of higher priority, it would be reasonable to select a larger sample size regardless of the relatively minimal additional gain in power. Finally, note that for the adaptive design to be worthwhile, it must perform better than this simple approach.
[image:5.595.306.540.477.693.2]Design optimization: allocation ratio, number of stages, and burn-in
Within the constraints of total sample size (N= 60/arm) and the basic proposed design (Fig. 1), additional simula-tions were conducted to assess the global design proper-ties: ability to select the optimal dose and probability of proceeding to phase III under different specifications. A range of possible design choices for the number of stages, allocation between control and pooled active doses, and choice of tuning parameters for RAR were assessed, with each scenario repeated for 1000 iterations to obtain estimates.
Figure 3 demonstrates how different allocations of sub-jects among the stages and arms affect the probability of selecting the optimal dose (here 7 days, assuming a linear dose response) and the probability that the pri-mary analysis will reject the null hypothesis (i.e., pass
the Go, No-Go criteria and proceed to phase III). Note that a 1:4 allocation ratio would be equivalent to equally allocating among the five arms if no RAR is used; sim-ilarly, 1:2 would be equivalent to a 1 : √J allocation ratio (i.e., Dunnett’s allocation [31]). As the total number of subjects allocated to the active doses increases from 1:2 to 1:4, the probability of selecting the correct dose increases. However, the probability of meeting the Go, No-Go criteria decreases. For a given allocation ratio, the percentage of active subjects allocated to the fixed burn-in period (stage 1) is positively correlated with the proba-bility of selecting the optimal dose. However, there is not a strong correlation between the percentage of burn-in subjects and the probability of meeting the Go, No-Go criteria. Finally, the optimal number of RAR updates (i.e., increased number of stages) is strongly dependent on the other design choices, with a slight tendency towards
[image:6.595.61.538.304.691.2]increased updates yielding better properties. Given these results, a 25% burn-in andk = 4 stages offered the best balance of dose selection and power.
Design optimization: RAR algorithm
In addition to identifying the optimal allocation ratio of subjects between control and active doses, fixed and adap-tive stages, and the number of adapadap-tive updates, the choice of the RAR algorithm has a significant impact on the design properties. Figures 3 and 4 display the properties for four possible raw RAR weights,Ijk: No RAR (γ = 0, λ=0), using only the probability that an active dose yields the minimum treatment effect with tuning parameter of either 1/2 or 1 (γ = 1/2 orγ = 1,λ = 0), and a raw weight that also incorporates the variability of the esti-mate with a tuning parameter of 1/2 (γ = 1/2,λ= 1/2). When no RAR is used, the choice of number of stages or burn-in period is trivial because the number of subjects in each arm is equal under all possible specifications. For all other scenarios, the design is sensitive to the choice of
RAR; however, no general statements can be made (Fig. 3). Moreover, while the results presented here consider only the case of a linear trend, the optimal RAR algorithm will be dependent on the hypothesized shape and spread of the dose-response distribution.
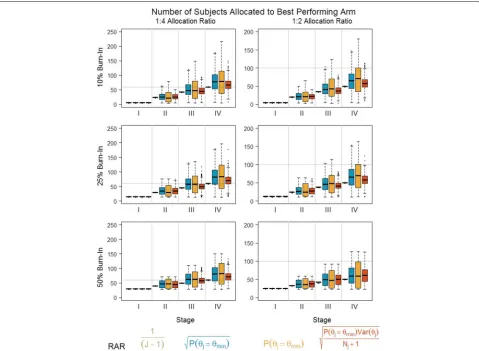
The literature notes that while frequent updates (i.e., obtained by increasing the number of stages) will increase the responsiveness to true treatment effects, there is an increased risk that subjects may be allocated to the worse performing arm due to an ephemeral treatment effect [17]. Thus, in addition to the global design properties specified above, the number of subjects assigned to each treatment arm at each stage is assessed (Fig. 4). In each plot, the horizontal line indicates the total number of subjects allocated to the control group. An optimal RAR algorithm would have a mean total number of subjects in the highest dose that yields a final ratio of 1:1, with the smallest possible variance. For the hypothesized trend, fixed allocation (i.e., no RAR, 1/(J −1)) minimizes the variability in the number of subjects allocated to the best
[image:7.595.60.539.343.694.2]arm (and thus reduces the number of subjects allocated to suboptimal doses). However, because it does not incor-porate accumulating information on the dose-response trend, it also consistently allocates the fewest number of subjects to the optimal arm relative to the other algo-rithms. The two algorithms which randomize subjects solely based on the treatment effect (γ = 1/2 orγ = 1,
λ = 0) allocate more subjects to the best dose compared to no RAR. However, particularly in the scenario with a
γ = 1 tuning parameter, the high variability suggests that it is still possible to allocate subjects to a suboptimal arm (though rarely less than if no RAR were used). The algorithm that incorporates the estimate variability (γ = 1/2,λ = 1/2) performs slightly better than no RAR; the separation between doses is insufficient to overcome the estimate of variability, and thus the optimal dose does not receive the majority of subjects. Finally, note that although there are differences in the number of subjects allocated to the optimal dose between algorithms, there are no sig-nificant differences in the probability of meeting the Go, No-Go criteria for all of the RAR algorithms except the algorithm with tuning parametersγ = 1,λ = 0 (Fig. 3). That is, unlike the two-arm scenario (but similar to other multi-arm RAR designs [32]), we do not experience a loss in power by allocating more subjects to the optimal active arm. Thus, for the linear dose trend, the algorithm that only accounts for the treatment effect but modulates the strength through aγ = 1/2 tuning parameter represents the best balance between optimal design parameters and an overly sensitive RAR algorithm.
Discussion
The motivation for the ALISAH II trial was discussed, and a design with 25% burn-in, four stages, and an RAR algorithm with tuning parameters of γ = 1/2,λ = 1/2 was selected to optimize the trial properties if the probability of poor outcome in the albumin doses was linear. The choice of an optimal design is dependent on the hypothesized magnitude and relationship of effect between the doses. A linear dose-response trend is the most difficult in terms of dose selection; thus, a design that increases the number of observations used to esti-mate the Go, No-Go criteria helps mitigate a smaller effect size if a suboptimal but still effective dose is selected. The above simulations would need to be repeated to identify the optimal design if a different dose-response relation-ship were hypothesized, though the general themes are consistent.
[image:8.595.305.538.134.206.2]The following section now considers whether the design is sufficiently optimal for additional dose-response rela-tionships and discusses further possible modifications the study team might consider. Table 1 presents four possible outcomes in the trial: (a) when all four active doses are ineffective (i.e., 28% poor outcome rate in the control, day
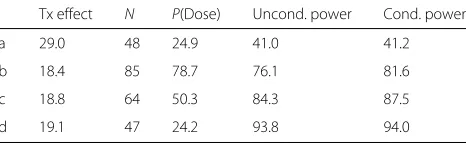
Table 1Operating characteristics for different treatment effect assumptions: (a) all four active doses are ineffective; (b) only the maximum dose duration is effective; (c) linear dose-response trend; and (d) all four active doses are equally effective
Tx effect N P(Dose) Uncond. power Cond. power
a 29.0 48 24.9 41.0 41.2
b 18.4 85 78.7 76.1 81.6
c 18.8 64 50.3 84.3 87.5
d 19.1 47 24.2 93.8 94.0
The table presents the median observed effect size for the optimal dose arm (Tx effect), the average number of subjects randomized to that arm (N) and the unconditional and conditional power defined respectively as the percentage of simulations whereP(θj−θ0>0)≥0.8 conditional and unconditional on whetherj
was the true optimal dose
1, day 3, day 5, day 7); (b) when only the maximum dose duration is effective (i.e., 28% poor outcome rate in the control, day 1, day 3, and day 5, but 18% poor outcome rate in day 7); (c) when there is a linear dose-response trend ranging from 28% in the control arm to 18% in the 7 day arm; and (d) when all four active doses are equally effective (i.e., 18% poor outcome rate). For each of these scenarios, the following statistical properties are presented: the observed treatment effect; the number of subjects allocated to the optimal dose, defined alternately as the dose with the greatest effect size or the short-est duration in the case of two or more equivalent doses (i.e., 1 day for scenarios a, d; 7 days for scenarios b, c); the probability of selecting the correct dose; the uncon-ditional power, defined as the number of scenarios where the posterior probability of a treatment effect exceeds 80% regardless of the dose selected; and finally, the conditional power defined similarly to the unconditional power but restricted to those iterations where the correct dose was selected. Each scenario was simulated for 10,000 iterations under the assumption of 100 subjects in the control arm and 200 subjects among the active arms.
(results not shown). This is desirable, as the cost of select-ing the second best dose is much less than if a dose with no efficacy were selected.
To decide whether the current evidence is sufficiently promising to continue with a future phase III trial, the Go, No-Go criteria are defined as at least 80% probabil-ity that the probabilprobabil-ity of poor outcome in the selected active dose is less than the probability of poor outcome in the control arm i.e.,Pθj−θ0<0
≥80%. This is conceptually similar to the frequentist concept of type I error if the treatments are simulated under the null (sce-nario a), or power if under the alternative (sce(sce-narios b–d). Secondly, this quantity can be evaluated conditional or unconditional on having selected the correct dose, where the former is equivalent to the assumptions made for non-adaptive trials (i.e., separate trials for dose finding and testing of efficacy), and the latter is more typical of adap-tive frameworks. Note that, by selecting for the optimal dose, the design introduces a positive bias in the treatment effect for the selected active dose [33, 34]. Although this is a well-known problem in adaptive selection designs, it is not straightforward to predict the magnitude of the bias or adjust the resulting statistics. Nevertheless, as long as the trial properties are transparent, the inflated power is still a useful quantity for decision making. Here, when at least one dose is effective, there is high conditional power to proceed to phase III. Unconditional power is similarly high but reflects the risk of selecting a suboptimal dose. In the null case, the probability of proceeding to phase III when no treatment effect exists, 40%, is higher than would normally be accepted for a phase II trial. Histori-cally, the use of type I error levels has been accepted as an immutable requirement, although more recently discus-sion in the statistical community has acknowledged that the type I error rate should reflect the trade-offs specific to a trial, and as such may be higher in certain situations [6, 35, 36]. Given the severity of the patient population and the lack of available treatment options, there is a greater harm of stopping after the phase II trial given an effec-tive treatment than to proceed to future testing with an ineffective treatment (particularly given the ability to use futility boundaries in the phase III trial). In this light, approximately 60% of futile phase III trials would be pre-vented, but only 5–20% of effective phase III trials would be lost. However, if in other disease contexts this trade-off is unacceptable, improved properties can be achieved by increasing the total sample size, increasing the minimum acceptable difference, or making the threshold to proceed to phase III more strict.
In the context of designing the ALISAH II trial, the most basic aspects of implementing the restricted RAR design have been presented. One of the strengths of this approach, however, is its flexibility. Although it is beyond the scope of the current paper to evaluate in detail how
additional modifications would affect the probability of selecting an optimal dose which also meets the Go, No-Go criteria, what follows is a discussion of the main possibilities and their expected effect.
More complex dose selection algorithms
It may be desirable to consider a more complex dose selection rule wherein, for instance, the shortest duration which achieves at least 90% of the maximum effect size is selected (i.e., an ED-90 type rule). Clinically, this would be the case if the higher dose significantly decreases the fea-sibility of implementation or is associated with increased risk of harm. To implement this rule, the dose selection criteria of selectj=maxPθj=θmin
could be replaced withj = min(j) ∈ Pθj≥0.9(θmin)
, though additional simulations would be required to identify the optimal RAR algorithm in this scenario (e.g., randomize equally to all doses meeting the ED-90 duration or proportional to a “relative-value” weight). It is anticipated that this selection rule would perform similarly to the simple rule in the case of a clear winner, but have improved ability to select the optimal dose when there are small differences in the effect size. Conversely, since a less than maximally efficacious dose may be promoted, the power may be reduced.
The model presented in the “Methods” section assumes the observed probability of poor outcomes has a sim-ple binomial distribution; however, in practice there are often covariates that modulate this effect. For instance, in ALISAH II it is anticipated that baseline stroke severity will be a significant predictor of outcome. Here, a hierar-chical logistic regression model could replace the current binomial distribution. The resulting posterior probabil-ity of poor outcome in each arm could then be com-pared using the above RAR algorithms and Go, No-Go criteria, with likely mild to moderate improvement in the design properties. It is important to note, however, that optimal methods for simultaneous covariate adaptive and response adaptive randomization are relatively new and, generally speaking, a tight balance of covariates will diminish the benefit of RAR.
this is well worthwhile, as it is likely that the resulting improvement in dose selection and power is non-trivial.
Conclusions
The proposed Bayesian adaptive phase II design is a flexible approach to balancing the need to identify the optimal dose from several possible doses and making a statement with a certain level of confidence about the relative efficacy when compared to a control group. Sev-eral design components were introduced (allocation of subjects, choice of burn-in, RAR algorithm), and simu-lation results were presented showing how these aspects can affect the resulting statistical design properties. An example design was considered for the case of albumin use for patients with subarachnoid hemorrhage. How-ever, the design is broadly applicable for trials where the primary endpoint is binary and two or more active treat-ments are available (i.e., the treattreat-ments may be doses or even different drugs). One limitation of this design is that it requires the primary endpoint to be available in a timely manner relative to the rate of recruitment, or an appropriate validated surrogate endpoint should exist. If not, too many subjects are recruited before a suffi-cient number of outcomes are observed to implement the RAR.
While the design does not include any additional fea-tures such as interim analyses for efficacy and futility, or logistic regression models that leverage the additional information available from the non-selected arms or mea-surements of the primary outcome at earlier time points, the authors posit that these additions are straight-forward, and in the case of modeling will improve the overall design properties so long as the choice of model is reason-able. Moreover, the statistical design properties presented above are conservative, and use of these additional fea-tures will likely improve the final interpretation of results.
Abbreviations
ALISAH: Albumin in subarachnoid hemorrhage; RAR: Response adaptive randomization
Acknowledgements
This work is supported by a grant from the National Institutes of Health and the National Institute of Neurological Disorders and Stroke (StrokeNET: U01NS087748).
Funding
Not applicable; the above manuscript discusses a clinical trial design. At the time of submission the design was used in the application of ALISAH II, a trial submitted for funding to the National Institute of Neurological Disorders and Stroke (NINDS).
Availability data and materials
Code to simulate the above design is provided in the form of R functions in the supplemental file “2017 JUN_TRIALS_Restricted Randomization Design.R”.
Authors’ contributions
CE and RM are responsible for development of the study concept, implementation of the simulations and analysis, interpretation of results, writing the statistical sections of the manuscript, and critical revision of the
entire manuscript. JS is responsible for development of the study concept, writing the clinical sections of the manuscript, and critical revision of the entire manuscript. All authors declare that they have read and approved the final version of this manuscript.
Competing interests
The authors declare that they have no competing interests.
Consent for publication
Not applicable; the above manuscript discusses a clinical trial design. No subjects are involved at this stage.
Ethics approval and consent to participate
Not applicable; the above manuscript discusses a clinical trial design. No subjects are involved at this stage.
Publisher’s Note
Springer Nature remains neutral with regard to jurisdictional claims in published maps and institutional affiliations.
Author details
1Data Coordination Unit, Department of Public Health Sciences, Medical
University of South Carolina, 135 Cannon Street, Charleston, SC, USA.2Division of Neurocritical Care, Departments of Anesthesiology and Critical Care Medicine, Neurology, and Neurosurgery, Johns Hopkins University, Houston, TX, USA.
Received: 29 November 2016 Accepted: 19 May 2017
References
1. Thall PF, Russell KE. A strategy for dose-finding and safety monitoring based on efficacy and adverse outcomes in phase I/II clinical trials. Biometrics. 1998;54(1):251–64.
2. Simon R, Wittes R, Ellenberg S. Randomized phase II clinical trials. Cancer Treat Rep. 1985;69(12):1375–81.
3. Bretz F, Hsu J, Pinheiro J, Liu Y. Dose finding—a challenge in statistics. Biom J. 2008;50(4):480–504.
4. Whitehead J. Designing phase II studies in the context of a programme of clinical research. Biometrics. 1985;41(2):373–83.
5. Whitehead J. Sample sizes for phase II and phase III clinical trials: an integrated approach. Stat Med. 1986;5(5):459–64.
6. Wason J, Jaki T, Stallard N. Planning multi-arm screening studies within the context of a drug development program. Stat Med. 2013;32(20): 3424–35.
7. Meurer WJ, Lewis RJ, Tagle D, Fetters MD, Legocki L, Berry S, Connor J, Durkalski V, Elm J, Zhao W, et al. An overview of the Adaptive Designs Accelerating Promising Trials Into Treatments (ADAPT-IT) project. Ann Emerg Med. 2012;60(4):451–7.
8. Legocki LJ, Meurer WJ, Frederiksen S, Lewis RJ, Durkalski VL, Berry DA, Barsan WG, Fetters MD. Clinical trialist perspectives on the ethics of adaptive clinical trials: a mixed-methods analysis. BMC Med Ethics. 2015;16(1):1.
9. Bornkamp B, Bretz F, Dmitrienko A, Enas G, Gaydos B, Hsu CH, König F, Krams M, Liu Q, Neuenschwander B, et al. Innovative approaches for designing and analyzing adaptive dose-ranging trials. J Biopharm Stat. 2007;17(6):965–95.
10. Berry SM, Spinelli W, Littman GS, Liang JZ, Fardipour P, Berry DA, Lewis RJ, Krams M. A Bayesian dose-finding trial with adaptive dose expansion to flexibly assess efficacy and safety of an investigational drug. Clin Trials. 2010;7(2):121–35.
11. Thall P, Fox P, Wathen J. Statistical controversies in clinical research: scientific and ethical problems with adaptive randomization in comparative clinical trials. Ann Oncol. 2015;26(8):238.
12. Rosenberger WF, Hu F. Maximizing power and minimizing treatment failures in clinical trials. Clin Trials. 2004;1(2):141–7.
13. Hu F, Rosenberger WF. Optimality, variability, power: evaluating response-adaptive randomization procedures for treatment comparisons. J Am Stat Assoc. 2003;98(463):671–8.
15. Zhao W, Durkalski V. Managing competing demands in the implementation of response-adaptive randomization in a large multicenter phase III acute stroke trial. Stat Med. 2014;33(23):4043–52. 16. Hey SP, Kimmelman J. Are outcome-adaptive allocation trials ethical?
Clin Trials. 2015;12(2):102–6.
17. Thall PF, Wathen JK. Practical Bayesian adaptive randomisation in clinical trials. Eur J Cancer. 2007;43(5):859–66.
18. Connor JT, Elm JJ, Broglio KR, ESETT, Investigators AI, et al. Bayesian adaptive trials offer advantages in comparative effectiveness trials: an example in status epilepticus. J Clin Epidemiol. 2013;66(8):130–7. 19. Yin G, Chen N, Jack Lee J. Phase II trial design with Bayesian adaptive
randomization and predictive probability. J R Stat Soc Ser C Appl Stat. 2012;61(2):219–35.
20. Suarez JI, Tarr RW, Selman WR. Aneurysmal subarachnoid hemorrhage. N Engl J Med. 2006;354(4):387–96.
21. Dorhout Mees S, Rinkel GJ, Feigin VL, Algra A, van den Bergh WM, Vermeulen M, van Gijn J. Calcium antagonists for aneurysmal subarachnoid haemorrhage. Cochrane Libr. 2007. Issue 3. Art. No:CD000277. doi:10.1002/14651858.CD000277.pub3.
22. Macdonald RL, Higashida RT, Keller E, Mayer SA, Molyneux A, Raabe A, Vajkoczy P, Wanke I, Bach D, Frey A, et al. Clazosentan, an endothelin receptor antagonist, in patients with aneurysmal subarachnoid haemorrhage undergoing surgical clipping: a randomised, double-blind, placebo-controlled phase 3 trial (CONSCIOUS-2). Lancet Neurology. 2011;10(7):618–25.
23. Macdonald RL, Higashida RT, Keller E, Mayer SA, Molyneux A, Raabe A, Vajkoczy P, Wanke I, Bach D, Frey A, et al. Randomized trial of clazosentan in patients with aneurysmal subarachnoid hemorrhage undergoing endovascular coiling. Stroke. 2012;43(6):1463–9. 24. Dorhout Mees SM, Algra A, Vandertop WP, van Kooten F, Kuijsten HA,
Boiten J, van Oostenbrugge RJ, Salman RA-S, Lavados PM, Rinkel GJ, et al. Magnesium for aneurysmal subarachnoid haemorrhage (MASH-2): a randomised placebo-controlled trial. Lancet. 2012;380(9836):44–9. 25. Suarez JI, Martin RH, Calvillo E, Dillon C, Bershad EM, MacDonald RL,
Wong J, Harbaugh R. The Albumin in Subarachnoid Hemorrhage (ALISAH) multicenter pilot clinical trial safety and neurologic outcomes. Stroke. 2012;43(3):683–90.
26. Suarez JI, Shannon L, Zaidat OO, Suri MF, Singh G, Lynch G,
Selman WR. Effect of human albumin administration on clinical outcome and hospital cost in patients with subarachnoid hemorrhage. J Neurosurg. 2004;100(4):585–90.
27. Hill MD, Martin RH, Palesch YY, Tamariz D, Waldman BD, Ryckborst KJ, Moy CS, Barsan WG, Ginsberg MD. The Albumin in Acute Stroke Part 1 trial: an exploratory efficacy analysis. Stroke. 2011;42(6):1621–5. 28. Ginsberg MD, Palesch YY, Hill MD, Martin RH, Moy CS, Barsan WG,
Waldman BD, Tamariz D, Ryckborst KJ, et al. High-dose albumin treatment for acute ischaemic stroke (ALIAS) Part 2: a randomised, double-blind, phase 3, placebo-controlled trial. Lancet Neurology. 2013;12(11):1049–1058.
29. Hill MD, Martin RH, Palesch YY, Moy CS, Tamariz D, Ryckborst KJ, Jones EB, Weisman D, Pettigrew C, Ginsberg MD. Albumin
administration in acute ischemic stroke: safety analysis of the ALIAS Part 2 Multicenter Trial. PloS ONE. 2015;10(9):0131390.
30. Ellerbe C. What information will a statistician need to help me with a sample size calculation? Stroke. 2015;46(7):159–61.
31. Dunnett CW. A multiple comparison procedure for comparing several treatments with a control. J Am Stat Assoc. 1955;50(272):1096–121. 32. Wason J, Trippa L. A comparison of Bayesian adaptive randomization and
multi-stage designs for multi-arm clinical trials. Stat Med. 2014;33(13): 2206–21.
33. Bauer P, Koenig F, Brannath W, Posch M. Selection and bias—two hostile brothers. Stat Med. 2010;29(1):1–13.
34. Liu Q, Proschan MA, Pledger GW. A unified theory of two-stage adaptive designs. J Am Stat Assoc. 2012;97(460):1034–41.
35. Palesch YY. Some common misperceptions aboutPvalues. Stroke. 2014;45(12):244–6.
36. Wasserstein RL, Lazar NA. The ASA’s statement onp-values: context, process, and purpose. Am Stat. 2016;70(2):129–33.
• We accept pre-submission inquiries
• Our selector tool helps you to find the most relevant journal
• We provide round the clock customer support
• Convenient online submission
• Thorough peer review
• Inclusion in PubMed and all major indexing services
• Maximum visibility for your research
Submit your manuscript at www.biomedcentral.com/submit