3D MODELING AND SIMULATION OF ALGAE
FOR SIMULATOR VEHICLES AND UNDERWATER
ENVIRONMENT
DUDDY SOEGIARTO
Department of Information Technology Faculty of TASS, Telkom University
Bandung, Indonesia
E-mail: [email protected]
ABSTRACT
Research in the field of modeling and simulation of underwater environment is to study the behavior of the environment and biota in the form a unified function and behavior in a marine ecosystem. Modeling and simulation in this study the main objective is to support the manufacture of vehicle simulators and the underwater environment by making the modeling and simulation of marine plants, especially algae. Modeling and simulation is performed using the laws of physics to simulate the motion behavior of marine algae as a result of the dynamics of water in the form of hydrodynamics and thermodynamics, or both. In this research, modeling is used to provide a descriptive overview of the structure of the handle while the laws of physics-dynamics for dynamic simulation. Implementation process modeling and simulation is done by using the method of l-systems and OpenGL. Modeling and simulation using the method of L-system and OpenGL in this study resulted in the visualization of structures and simulation algae under the sea.
Keywords: Modeling, Simulation, Algae, L-system, OpenGL
1. INTRODUCTION
The system simulator must be able to present environmental conditions and atmosphere as the original, it is necessary for the combined system of hardware and software appropriate to produce a quality simulator system. System hardware produces a condition of an interactive motion adapted to the shape of the visualization software, so the combination of those two things would improve the quality of experience that will be felt by the user when using the simulator.
Research conducted primary goal is to study the behavior of algae in an underwater environment to make modeling and simulation. Some modeling of the underwater environment has been carried out by Gonzato[4] in the form of modeling the dynamics of ocean surface waves mainly, Wejchert[10] a simple flow model which forms the basis for the simulation of underwater currents, simulating the movement of underwater plants by Stam[9] by using the method flexible structures such as trees.
In this research, modeling is used to provide an overview description of the structure of the handle and use the rules of physics-dynamics
for dynamic simulation. Implementation process modeling and simulation is done using the method of L-system. L-system method is often used for the modeling of underwater plants such as algae, because the method of L-system has the ability to model some natural growing process and structure of various types of plants. For the interpretation of the symbols of the string into a visual display of the graphics used method called turtle geometry, this method translates the symbol string into a visual form 2D or 3D. Implementation of making software for modeling and simulation using the OpenGL-based C + + language.
2. L-SYSTEM AND OPENGL
2.1 L-System
L-system was first introduced by a Hungarian biologist, Lindenmayer Aristid, in 1968 through his paper "Mathematical models for cellular interactions in development". At first l-system formulation applies only to plant a low level, but the subsequent development can also be applied to higher plants.
ISSN: 1992-8645 www.jatit.org E-ISSN: 1817-3195
In the l-system method, to start rewriting must have
an initial string called axiom or premise.
2.1.1 DOL-System
DOL-system is one method of L-system is defined by three sets of strings where G = <V,w,P>
• V is the set of symbols/strings (AZ,az) or
punctuation mark that can be defined as an object that can grow. Most of these symbols have a special meaning command, while others merely as an empty object for the growing phase,
• w is axiom or start symbol,
• P is a rule (rule) in the production stages of
forming object by reading from right to left. example:
Symbol = {a, b}
Rules = {a → ab, b → a} Axiom: b
In this example the set of symbols known to consist of a and b, the production rules for forming the object is:
a → ab: a symbol will be replaced by the symbol ab;
b → a: b will be replaced by the symbol of a symbol.
To make the process of production, as above stages that occur are as follows:
Phase 1: b as axioms is replaced by a (b → a), phase 2: a is replaced by ab (a → ab).
[image:2.595.336.471.577.679.2]The production process continues in accordance with the value of repetition (iteration) that have been defined. For example, we do as much as five times the repetition it will produce objects such as Figure 1 below.
Figure 1: The production Process DOL-system
2.1.2 Turtle geometry
Turtle geometry is a method to develop a DOL-system in making visualization of graphical objects, this method translates the symbol string into a visual form of 2-dimensional or 3-dimensional. The symbols used have the rules and certain parameters, some examples of symbols and the raw parameters as shown in Table 1 and Table 2.
Table 1: L-System Simbol
Symbol Regulation definition
F Forward on the direction right now and make a line of length and thick of certain
f Now so far advanced in the direction of a certain length, without making the line + Rotates to the left through an angle of certain - Rotates to the right by an angle of certain
Table 2: L-System Parameters
Parameters Parameters
Definition Example
Angle To change the angles used for the symbols + and -
450
Length Length value for the symbol F parameter and f
5
Thickness Thickness parameter
value for the symbol F 2 Iterations Number of iterations
parameter production 5
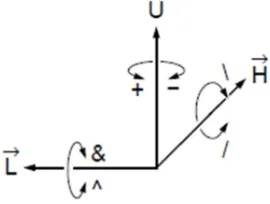
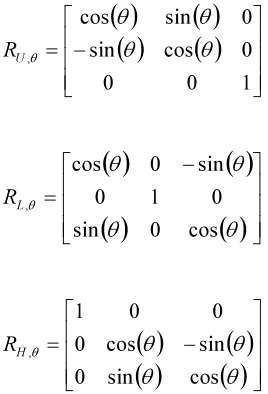
Turtle geometry can be used for visualization of 3D graphics by adding some symbols to make directional changes in the field of 3-dimensional visualization. 3-dimensional visualization shows the position and direction of the Cartesian coordinate system in the form of a reference axis of rotation as shown in Figure 2 below.
Figure 2: Changes in the direction of 3- dimensions on turtle geometry
and RH as well as a quantity angle θ, matrices and symbols are as follows.
( )
( )
( )
( )
−
=
1
0
0
0
cos
sin
0
sin
cos
,θ
θ
θ
θ
θ UR
( )
( )
( )
( )
−
=
θ
θ
θ
θ
θcos
0
sin
0
1
0
sin
0
cos
, LR
( )
( )
( )
( )
−
=
θ
θ
θ
θ
θcos
sin
0
sin
cos
0
0
0
1
, HR
[image:3.595.123.257.166.363.2]The symbols used for 3-dimensional visualization has rules as shown in Table 3.
Tabel 3: L-System 3D symbol
Symbol Regulation definition
+(θ) Turn left at angle θ on the axis of U using matrix RU
- (θ) Turn right at angle θ on the axis of U using matrix RU
&(θ) Pitch down by angle θ on the axis of L using matrix RL
^(θ) Pitch up by angle θ on the axis of L using matrix RL
\(θ) Roll to the left through an angle θ on the axis of H using matrix RH
/(θ) Roll to the right through an angle θ on the axis of H using matrix RH
|(180) Turn 1800
on the axis U
[ Save current geometry data (position, direction, attributes) in the stack
] Remove the previous geometry data from the stack
2.2 OpenGL
OpenGL [12] (Open Graphics Library) is a standard specification defining a cross-platform API to create applications that produce 2 or 3-dimensional visualization.
Cross-platform API program is a standard provision in the computer industry related to 2-dimensional computer graphics and is also used for 3-dimensional graphics. OpenGL is able to facilitate communication with different 3D accelerators by using a single interface and is able to hide the differences OpenGL hardware platform, OpenGL basic operations that change the point, the line into pixels. OpenGL is a low-level API is procedural.
The basic function of OpenGL is to issue special commands specific collections that are called and so can be run on any operating system. This program works with existing graphics hardware or certain other sources. Each command is designed to perform a specific action, or initiate certain specific effects associated with graphics.
Along with the ability to interface of the operating system, OpenGL also provides several built-in protocol that may be useful to users, including features such as alpha blending tool, texture mapping, and atmospheric effects. This protocol can interact with the operating system being used.
To make OpenGL-based windows we can use the OpenGL Utility Toolkit (GLUT) which has provided a lot of functions that can make the window in a way that is independent of the operating system. This means that programs created with GLUT can operate on different windowing systems without changing the code manually. GLUT provides a function to define a window, the window controls, and input from the keyboard / mouse. GLUT also provides a wide range of automatic functions for drawing complex objects. GLUT is an API (Application Programming Interface) with ANSI C bindings for writing OpenGL programs Windows systems. GLUT was made by Mark J. Killgard when working at Silicon Graphics Inc. Although designed to be used together with the code of OpenGL, GLUT can be used with or without OpenGL. This toolkit supports the following functionality:
• Multiple windows for OpenGL rendering. • Callback event driven processing. • Sophisticated input devices. • An "idle" routine and timers.
• A simple, cascading pop-up menu facility. • Utility routines to generate various solid and
wire frame objects.
ISSN: 1992-8645 www.jatit.org E-ISSN: 1817-3195
• Miscellaneous window management
functions,
• Including managing overlays.
The structure of GLUT-based application will consist of the following steps, namely:
• Assign the configuration of the windows, and
opening windows
• Initialize OpenGL status
• Register the callback functions (if needed)
Render
Resize
Input
Timer
Idle
Enter event processing loop.
3. MODELLINGANDSIMULATION
[image:4.595.283.508.78.541.2]Figures Movement of flora and fauna as well as a realistic environmental conditions is one way to improve the quality of the underwater atmosphere that will be felt by the user simulator. Below is the use case diagram of the intelligent system that constructs the behavior of a component in the simulator system [11].
Figure 3: The use case diagram of the intelligent system
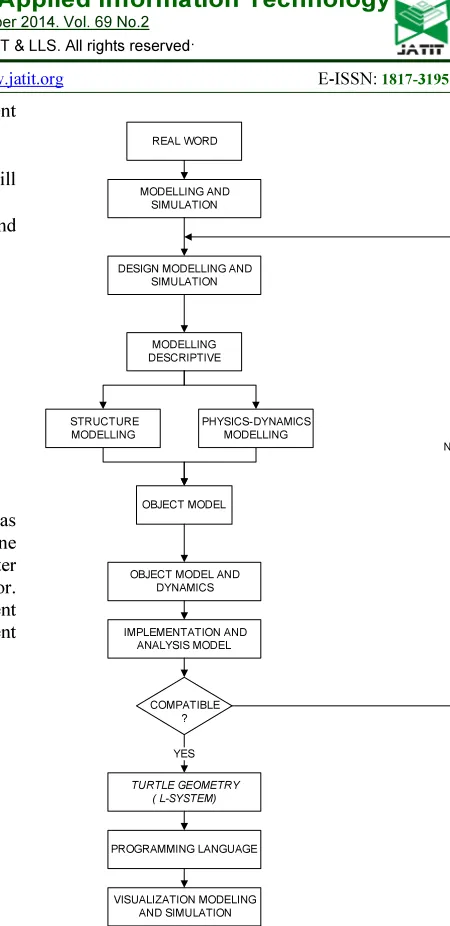
Based on the above, the design process for modeling and simulation of algae is done through several stages of modeling, as shown in Figure 4.
REAL WORD
MODELLING AND SIMULATION
MODELLING DESCRIPTIVE
STRUCTURE MODELLING
PHYSICS-DYNAMICS MODELLING
TURTLE GEOMETRY ( L-SYSTEM)
PROGRAMMING LANGUAGE
VISUALIZATION MODELING AND SIMULATION
OBJECT MODEL
OBJECT MODEL AND DYNAMICS
COMPATIBLE ? DESIGN MODELLING AND
SIMULATION
IMPLEMENTATION AND ANALYSIS MODEL
NO
YES
Figure 4: Stages of modeling
The stages of this modeling is done to facilitate analysis and implementation as well as to be able to increase the realism of visualization of the structure and dynamics of algae, which can accommodate the needs of the modeling are:
• Modeling description for structure
visualization algae.
• Modeling physics dynamics to model the
dynamics of algae.
Developed modeling method is realized using l-systems in the form of a computer program such as visual simulation of the structure and dynamics of algae. The computer program is expected to realize artificial structure and
arrange sea flow
arrange brightness
searching target
arrange realistic crash impact
arrange behaviour of plant arrange bubble behaviour
[image:4.595.89.511.84.653.2]movement of algae with an approach that has a good level of fidelity to represent patterns of behavior.
3.1. Design Modeling Description of Algae
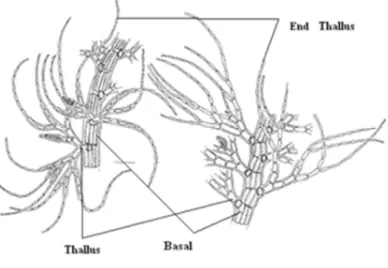
[image:5.595.94.288.315.449.2]Based on the classification of algae is tallopyta (thallus plants), because does not have roots, stems and leaves are clear. Thallus sightings range from simple to complex forms. The spikes on thallus elongate tapered, somewhat sparse and not composite circling thallus. Branching in different directions with the main trunks out each adjacent to the basal area (base). Design modeling is done to illustrate the description of the structure of the algae with a form to be modeled as Figure 5[8].
Figure 5: Structure of algae that will be modeled
Method l-systems and turtle geometry to be modeled algae have rules and parameters such as the tables below.
Tabel 4: L-System Symbol
Symbol Regulation definition
A Axiom
A → B[++++r C]rA Main fuction
C →+
D[--E[-G][+GI][+E[-G][+G]]
Rules for making the basal and Thallus
B → Hf Make basalt in the main line
D → IfJf Make Thallus and ends
Thallus
E →JfJf Make Thallus tip
G → JfJfJfJf Make four Thallus tip
Tabel 5: L-System Parameters
Parameters Value
The main angle 20 °
angle Change 75 °
Iteration 5
Tabel 6: Turtle Geometric Symbol
Symbol Turtle Geometric Definition
+ Rotates 20
0
on the x-axis and the z counter-clockwise
- Rotates 200
on the x-axis and z-clockwise r 900 spins on the x and y axis clockwise
f Now so far advanced in the direction of a certain length, without making the picture
[ Save current geometry data (position, direction, attributes) in the stack
] Remove the previous geometry data from the stack
H Figure cylinder basal I Figure cylinder thallus J Figure cylinder end Thallus
3.2. Physical Dynamics Modeling Design
Physics-dynamics modeling design aims to create a model of the dynamics of algae as a reaction to external forces such as water currents or other environmental influences by using the rules of physics.
[image:5.595.314.501.445.505.2]Algae form shape design structure segments at each end has a spring damped, this model is used by Ken James[5] to model the dynamics of the tree, as shown in Figure 6 below.
Figure 6: Model of physics-dynamics
Algae to be modeled in the water, form a damping force due to the viscosity of water damping, so the dynamic motion that occurs is a damped harmonic motion. Forces acting on the model in the form of the sum of external force, the spring force and the damping force recovery of water so that damped simple harmonic motion equations based on Newton's second rule is:
(1) with
Fex = External force(N)
Fp = spring forces (N)
Fd = drag force (N)
m = massa (kg)
[image:5.595.86.508.538.758.2]ISSN: 1992-8645 www.jatit.org E-ISSN: 1817-3195
equation becomes:
(2) or
0 (3)
with
k = spring stiffness
x = deviation(m)
mass density of sea water
1,025x103"kgm )
Cd = coefficient drag
A = wide of objects (m2)
v = relative velocity of objects (ms-1)
Based on research Coulais Y. et al[1], the design of structural modeling algae shaped segments at each end has a spring damped and interconnected to form branching.
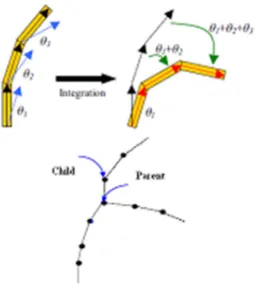
[image:6.595.129.259.405.549.2]Design forms of plant structure in the form of segments that each tip has a damped spring causes the movement of an affected segment and affect another segment, so that the angle of rotation of a segment of the child is the accumulation of changes in rotation angle plus the angle of rotation of the parent segment, as shown in Figure 7.
Figure 7: Design forms of plant structure
If there is an external force in a segment will cause a torque which produces motion in the form of rotational motion, so that the parameter x for translational motion is converted into rotational motion with parameter θ. Segments rotated due to a change in angular velocity (of silence be rotated), using equation 2 to calculate the torque that occurs in the basal part of the equation becomes:
" % 0,5 %&'( sin ) * (4)
or
" % 0,5 %&'(sin ) +, (5)
ೣ,
, (6) with
, = angular acceleration (rads-2) + = moment of inertia (kgm2) % = angle changes: % % ( 0 )
) = angle perpendicular to the plane ( 0 )
lt= basal length (m)
Circular Motion Equations Changed Regular (GMBB) is the circular motion with angular acceleration (α) remains, change the angle is as follows.
% %- ./ - ,/,
% % %
./ - /0ೣ, 1
if
. 0; ) 90
% % % /0ೣ,
1 (7)
Basal and Thallus shape is a cylinder, I
was at the end of the cylinder then + (, equation becomes:
% /3ೣ,
భ య
మ 4
% /3ೣ
భ య
4
/3
ೣ
భ య
భ మ
4 (8)
with
= massa (kg) = external force(N) = drag force (N)
lt= basal length (m) / = time (s)
Changes in this angle θ is a parameter that will be used to simulate the dynamics of algae.
3.3. Design a Program Using OpenGL
START
RUNNING INITIALIZATION
SUBPROGRAM
RIGHT BUTTON?
BUTTON LEFT? VISUALIZATION SIMULATION
ROTATE OBJECT
ZOOM IN/OUT OBJECT
EXIT?
END BUTTON MOUSE PRESSED?
YA
NO
NO
NO
YES
YES 2
2
2
YES
1 TIDAK
1
1
INITIALIZATION
INITIALIZATION L-SYSTEM SYMBOL
INITIALIZATION L-SYSTEM PAMETERS
INITIALIZATION TURTLE
GEOMETRIC SYMBOL
RETURN
NO
Figure 8: Software design method
Partly subprogram turtle geometric l-system used to model the structure of algae are as follows.
void creat_thallus(string line) //Turtle geometric l-system
{
string::iterator itor = line.begin(); string::iterator end = line.end();
for (;itor != end; ++itor) {
switch (*itor) {
case 'f':
glTranslated(0.0,0.5,0.0); break;
case '-':
glRotated(-angle,1,0,1); break;
case '+':
glRotated(angle,1,0,1); break;
case '[':
glPushMatrix(); break;
case ']':
glPopMatrix(); break;
case '|' :
glRotated(180,1,0,0); break;
}
}
}
4. IMPLEMENTATION AND TESTING
Display of modeling and simulation is made in the form of 3-dimensional, designed to describe the structure and dynamics of algae. In the implementation and testing of the values of constants and parameters for analysis of algae using an approach based on the values of existing journals and research, therefore further research is needed, the constants are as follows:
• Cd (drag coefficient) and Fd (drag force of
water) using an approach based on Justin's journal and Mark[14] which implements the results of research Carrington[2] and Bell[3]. The results of the calculation of Cd and Fd at a
certain speed is:
0,156, !", 678 9 3,5:
0,099, 678 ; 3,5:
and
79,9 ,! , 678 9 3,5:
50,7 , 678 ; 3,5:
• K (spring stiffness) using an approach based
on research Justin Mark W. Denny and Ben B. Hale[6] K values for the red algae 0.2 MPa = 200 000 N/m2;
• Dimension based on the study of algae
Gelidium Gardner, Hollenberg and Abbott[13] The average height of 0.4 m and Thallus thick ; 0.001 m;
• Based on research A. Mouradi-Givernaud and
colleagues[14] The average weight of the algae Gelidium about 4-8 g
Testing the physics-dynamics modeling is done by inserting parameter values into the formula, the shape analysis results visualization charts to see the change of rotation angle % when the algae due to the influence of external forces, the equation used is:
% /3ೣ
భ య
4 /3ೣ
భ య
భ మ
4 (9)
ISSN: 1992-8645 www.jatit.org E-ISSN: 1817-3195
= massa (kg)
= external force(N) = drag force (N)
lt= basal length (m) / = time (s)
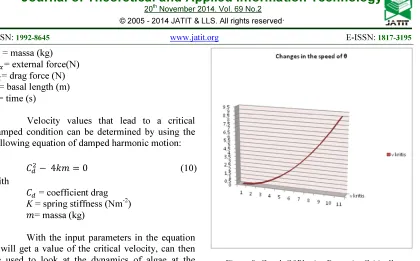
Velocity values that lead to a critical damped condition can be determined by using the following equation of damped harmonic motion:
4 0 (10)
with
= coefficient drag
K = spring stiffness (Nm-2) = massa (kg)
With the input parameters in the equation it will get a value of the critical velocity, can then be used to look at the dynamics of algae at the critical speed as shown in Table 7.
"0,156, !"' 4"2. 10. 4. 10 ' 0
[image:8.595.96.516.80.341.2], !"?4"2. 10. 4. 10 ' 0,156 0,176 ms-1
Table 7: Dynamics at The Critical Speed
t Fex Fd m lt A v k θ
0 31 0,002 4.10-3 0,1 0,0004 0,17 2.104 0
1 31 0,002 0,004 0,1 0,0004 0,17 2.104 0,0899
2 31 0,002 0,004 0,1 0,0004 0,17 2.104 0,3597
3 31 0,002 0,004 0,1 0,0004 0,17 2.104 0,8093
4 31 0,002 0,004 0,1 0,0004 0,17 2.104 1,4388
5 31 0,002 0,004 0,1 0,0004 0,17 2.104 2,2482
6 31 0,002 0,004 0,1 0,0004 0,17 2.104 3,2374
7 31 0,002 0,004 0,1 0,0004 0,17 2.104 4,4065
8 31 0,002 0,004 0,1 0,0004 0,17 2.104 5,7554
9 31 0,002 0,004 0,1 0,0004 0,17 2.104 7,2842
10 31 0,002 0,004 0,1 0,0004 0,17 2.104 8,9928
Figure 9: Graph Of Physics-Dynamics Critically Damped Condition
The speed of ocean currents in Indonesian average of about 0 to 3.5 m / s [11], the form of graphs for some speed as shown in Table 8.
Table 8: Dynamics at certain speeds
t (s)
Changes in the speed of θ
0,5 m/s 1 m/s 1,5 m/s
2 m/s
2,5 m/s
3 m/s
0 0 0 0 0 0 0
1 0,734 2,9365 6,607 11,7 18,35 26,4
2 2,936 11,746 26,43 46,9 73,41 106
3 6,607 26,428 59,47 106 165,1 238
4 11,74 46,984 105,7 188 293,6 423
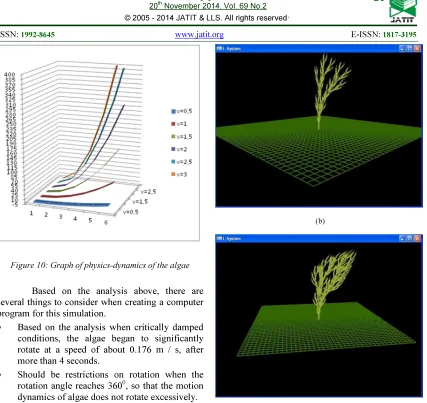
[image:8.595.80.512.444.655.2]Figure 10: Graph of physics-dynamics of the algae
Based on the analysis above, there are several things to consider when creating a computer program for this simulation.
• Based on the analysis when critically damped
conditions, the algae began to significantly rotate at a speed of about 0.176 m / s, after more than 4 seconds.
• Should be restrictions on rotation when the
rotation angle reaches 3600, so that the motion dynamics of algae does not rotate excessively.
Figure 11 shows some results of the implementation of modeling and simulation visualization dynamics of algae due to ocean current velocity:
(a)
(b)
(c)
Figure 11: (a) velocity <0.176 m / s, (b) velocity = 0.176 m / s and (c) the velocity > 0.176 m / s
5. CONCLUSIONS AND SUGGESTIONS
5.1. Conclusions
The conclusion of the study design and simulation modeling that has been done is as follows:
• Algae structure modeling and simulation using
the method of L-system turtle geometry in this study resulted in the visualization of the basal part, Thallus and Thallus tip.
• Physics-dynamics modeling using the
principles of physics torque, rotational and
damped harmonic motion produces
ISSN: 1992-8645 www.jatit.org E-ISSN: 1817-3195
Based on the analysis when critically
damped conditions, the algae began to significantly rotate at a speed of about 0.176 m / s, after more than 4 seconds.
Should be restrictions on rotation when the
rotation angle reaches 3600, so that the motion dynamics of algae does not rotate excessively.
5.2. Suggestions
Suggestions for improving the quality of modeling and simulation in this study are as follows:
• Use the rules of physics are such as the
Euler-Lagrange method or the Navier Stokes for mathematical modeling to analyze the influence of the forces causes algae dynamics.
• To improve the quality of a realistic impression
when visualization is done some of the following:
Completion of the structure of algae by adding some additional rules on the method of L-system
The process of modeling the
physics-dynamics analysis takes into account other variables such as depth, pressure, turbulence, and collusion.
REFRENCES:
[1] Coulais, Y., Thon, S., Ghazanfarpour, D., Terraz, O., Real-Time Animation of Particles and Seaweeds in Underwater Scenes, EG UK Theory and Practice of Computer Graphics, 2005.
[2] Carrington. E., Drag and dislodgment of an intertidal macroalga: consequences of morphological variation in Mastocarpus papillatus Ku¨tzing, J. Exp. Mar. Biol. Ecol. 139, 199, pp. 185–200.
[3] E. Bell. C., Applying flow tank measurements to the surf zone: predicting dislodgment in the Gigartinaceae.
Phycol. Res. 47, 199, pp:159–166.
[4] Gonzato, J .C., Le Saec, B., A phenomenological model of coastal scenes based on physical considerations, LaBRI cours de la liberation Talence France, 1994. [5] James, K., Dynamic Loading of Tree, Journal
of Arboriculture, ILFR University of Melbourne Melbourne, Australia, 2003.
[6] Mark W. Denny, Ben B. Hale,
Cyberkelp: an integrative approach to the modelling of flexible organisms, royal society publishing, 2003.
[7] Prusinkiewicz, P., Lindenmayer. A.,
The Algorithmic Beauty of Plants, Springer-Verlag, New York, 1996.
[8] Schneider, C.W., Walde, R.E., Morellib, R.A., L-systems computer models generating distichous from spiral organization in the Dasyaceae (Ceramiales, Rhodophyta), 1994.
[9] Schneider, C.W., Walde, R.E., L-system computer simulations of branching divergence in some dorsiventral members of the tribe Polysiphonieae (Rhodomelaceae, Rhodophyta), 1992.
[10] Stam, J., Stochastic dynamic s : Simulating the effects of turbulence on flexible Structures, Computer graphics Forum, 1997.
[11] Soegiarto. D., Nuryanto. A., Puput. S., Sariffudin. I., Dokumen B100-B500 Rancang Bangun Poseidon, STEI-ITB, Bandung 2011.
[12] Wright. Richard, Lipchak. Benjamin, Haemel. Nicholas, OpenGL.SuperBible.4th.Edition. Addison.Wesley Jun.2007
[13] Yamagishi. Y., Kimura. S., Oki. M., Flow characteristics around a square cylinder with changing chamfer dimensions, The Visualization Society of Japan, 2009.