ISSN: 1992-8645 www.jatit.org E-ISSN: 1817-3195
MODELING AND SIMULATION OF DUAL SOUND
LOCATION OF UNDERWATER ULTRASOUND DETECTOR
UNDER VOLUME REVERBERATION
1,2
ZHANG YING*, 1CHEN HEJUAN
1
School of Mechanical Engineering, Nanjing University of Science and Technology, Nanjing, China 2
Department of physics and information engineering, Jining University, Qufu, China
E-mail: [email protected], [email protected]
ABSTRACT
Aiming at the request of fast target location in underwater ultrasound detector, the dual sound location algorithm of close range detecting is proposed. By estimating the pressure difference and the time difference of dual sensors, the algorithm puts forward the pressure difference location model and the time difference location model, and derives the analytic solutions of real-time location. The mirror fuzzy problem of the linear array is resolved by dual sensors rotating 90 degrees. The problem that the target is unable to locate when it is located on the perpendicular bisector is solved by dual sensors rotating angle. The volume reverberation model is established. Simulation results show that the algorithm under the lower reverberation can achieve better location. The algorithm can meet high sensitivity and fast response requirements of underwater ultrasound detector close range detecting.
Keywords: underwater ultrasound detector; dual sound time difference; dual sound pressure difference; volume reverberation; modeling and simulation
1. INTRODUCTION
In the underwater detector, in order to improve anti-jamming ability, reduce the size of the transducer, usually use active ultrasonic detection signals, therefore, miniaturization ultrasonic devices which can quickly locate and identify an object become the key issue.
At present, underwater ultrasonic location algorithm can be divided into two categories: location algorithm based on beam-pointing and location algorithm based on geometric principles [1-3]
. Beam-pointing location algorithm through time-shift of the signal collected, through time-shifting compensation time differences of the target to the sensor, the output of sensor array is obtained by average of the sum of compensation signal value, and the target location is the maximum output direction of sensor array. Location algorithm based on geometric principles primarily through the analysis of time difference that target reaches sensors array, and then target location based on the geometric relationship. These methods, due to that the effects of model assumptions cannot be processed on reverberation and direction noise, and did not meet the high sensitivity and fast response requirements of underwater detector in close range
detection, high computational complexity, and sensor array size required, cannot be applied to the underwater detector of limit volume in the close range detection system.
In [4], location algorithm based on the sound pressure difference is proposed, according to the sound signal propagation, signal energy attenuation obeys the inverse square law, when the propagation distance of the signal reaches the sensor array is different, the received energy is also different, which can determine the target location. In this paper, combined with the time difference and pressure difference location algorithm, we put forward underwater close range detector dual sound location method, while the use of energy and time delay information, through the dual sound sensor can realize spatial location, can meet the detection requirements of underwater detector, and can reduce the size of array, suitable for volume required underwater detector.
ISSN: 1992-8645 www.jatit.org E-ISSN: 1817-3195
sound location algorithm. In Section 5, we conclude the work of this paper.
2. DUAL SOUND LOCATION MODELING
According to the linear propagation characteristics of the sound wave, it can obtain the position and shape of the target in the space from the direction of propagation. Sound intensity can determine the position and shape of the target in the
space. When the sound wave is reflected or
scattered, the polarization state will change, and this change is associated with the reflecting surface or the geometric shape of the scattering body.
Underwater close range detector determines the target position, and generally only needs distance and azimuth. Underwater detector often adopts the active detection system, transmitting different waveform modulation signal to improve the detector resolution.
The emission signal using carrier amplitude controlled multi pulse modulation signal [5], namely a constant frequency (CF) pulse signal and triangular linear frequency modulated (LFM) pulse signal as signal source waveform of ultrasonic signal model, and the formula is
1
( ) ( ) exp( 2 )
exp( 2 ) 0
0
i
i
t
s t rect j f t
T T
j f t t
t
π
π τ
τ =
≤ ≤
= ≥
(1)
Where τ is the signal modulation width, T is emission signal cycle, fi is filled with high
frequency pulse frequency. When fi=f0, transmits
the CF signal; when the fi =f0+K t transmits
triangle LFM signal (f0 is the starting frequency, K
is the frequency offset constant).
Dual sound location uses the time difference or pressure difference of dual sensor signals to estimate the spatial position of the target. The time difference is obtained by correlation transform of received signals, such as time delay estimation method and relevant calculation method. Dual sensor signals not only have the time difference but also the pressure difference, sensor near the target has the higher pressure, it obtains pressure difference signal which plays the important role in the location. Through the time difference and the pressure difference signals of dual sensors, we can determine the location of the target.
L and R represent dual sound sensors. According to the inverse square law of the signal propagation,
the received signal model of dual sensors can be expressed as:
)
(
/
)
(
)
(
)
(
/
)
(
)
(
t
d
t
s
t
s
t
d
t
s
t
s
R R R
L L L
ξ
ξ
+
=
+
=
(2)
Where s(t) is the ultrasonic echo signal,
ξ
L(
t
)
and
ξ
R(
t
)
are the additive white noise. dL and dRare the distances between target and dual sensors.
In [4], the method of pressure difference location is proposed, and time delay information can be neglected in the energy calculation. There selected time range in the [0, T], the signal energy of L and R sound sensors are the square of time signal sampling as:
2 2 2
2
0 0 0
2 2 2
2
0 0 0
1
( )d ( )d ( )d
1
( )d ( )d ( )d
T T T
L L L
L
T T T
R R R
R
E s t t s t t t t
d
E s t t s t t t t
d
ξ
ξ
= = +
= = +
∫
∫
∫
∫
∫
∫
(3)
From Eq. (3), the energy and distance relationship as:
η +
= 2
2
R R L
Ld E d
E
(4)
Where η is error, its expression as
2 2 2 2
0
[
( )
( )]d
T
L L R R
d
t
d
t
t
η
=
∫
ξ
−
ξ
When the noise variance is small, error
η
can be approximated as zero.Assumption (xL,yL), (xR,yR) and (xS,yS) are
coordinates of dual sensors and the target, the distance from target to L and R dual sound sensors can be expressed as:
2 2
2 2
)
(
)
(
)
(
)
(
S R S
R R
S L S
L L
y
y
x
x
d
y
y
x
x
d
−
+
−
=
−
+
−
=
(5)
Substituting Eq. (5) into Eq. (4), the equation can be expressed as following:
2 2
2 2
[(
)
(
) ]
[(
)
(
) ]
L L S L S
R R S R s
E
x
x
y
y
E
x
x
y
y
η
−
+
−
=
−
+
−
+
ISSN: 1992-8645 www.jatit.org E-ISSN: 1817-3195
Let
(
)
2 2 2 2
L R
L L R R
L L R R
L L L R R R
E E
E x E x
E y E y
E x y E x y
γ α
β ψ
= −
= −
= −
= ( + )− +
Eq. (6) can be transformed as:
0
( 1) 0
1
s
s s s
x
x y y
γ α
γ β η
α β ψ
−
− =
− −
(7)
If EL≠ER, Eq. (6) can be transformed as:
2
2 2
2
(x α) (y β) E E dL R LR η'
γ γ γ
− + − = +
(8)
Where
2 2 2
( ) ( )
LR L R L R
d = x −x + y −y
is square
of distance of dual sensors,
' η
η γ
=
. From Eq. (8),
the target is located on the circle, center is ( , α β γ γ ),
radius is
2
2
L R LR
E E d
γ (ignoring the noise). In
three-dimensional space, target can be determined in a ball.
If
E
L=
E
R, Eq. (6) can be expressed as:2
α
xs+2β
ys = +ψ η
(9)
From Eq. (9), the target is located on the perpendicular bisector of dual sensors. If in three-dimensional space, the target location is on the vertical surface.
Through the above analysis, the pressure signal difference of dual sensors can determine the target location, but is unable to determine the specific location. In order to achieve the target orientation, it is necessary to combine with time difference signal.
In the time difference location of dual sensors, time difference τLR can be obtained by
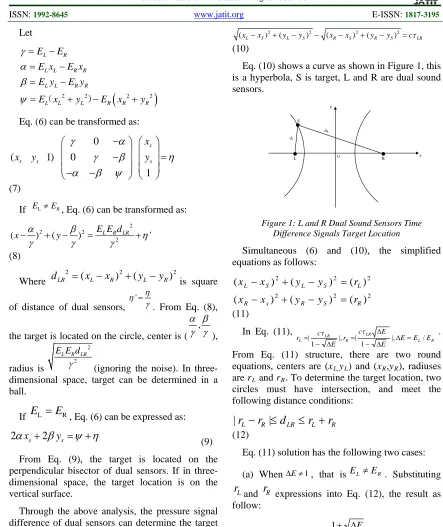
cross-correlation method [6]. The distance difference can be obtained byτLR multiplies by ultrasound velocity c, the equation as following:
LR S R S R S L S
L x y y x x y y c
x − 2+ − 2− − 2+ − 2= τ
) ( ) ( ) ( ) (
(10)
Eq. (10) shows a curve as shown in Figure 1, this is a hyperbola, S is target, L and R are dual sound sensors.
0 S
L R
dL
dR
[image:3.612.81.524.67.594.2]x y
Figure 1: L and R Dual Sound Sensors Time Difference Signals Target Location
Simultaneous (6) and (10), the simplified equations as follows:
2 2
2
2 2 2
) ( ) (
) (
) ( ) (
) (
R S
R s
R
L S
L S
L
r y
y x
x
r y
y x
x
= − + −
= − + −
(11)
In Eq. (11),
R L LR
R LR
L E E E
E E c r E c
r |, /
1 | |, 1
| ∆ =
∆ −
∆ = ∆ −
= τ τ .
From Eq. (11) structure, there are two round equations, centers are (xL,yL) and (xR,yR), radiuses
are rL and rR. To determine the target location, two
circles must have intersection, and meet the following distance conditions:
R L LR R
L
r
d
r
r
r
−
|
≤
≤
+
|
(12)
Eq. (11) solution has the following two cases:
(a) When∆E≠1, that isEL≠ER. Substituting
L
r
and
r
R expressions into Eq. (12), the result asfollow:
| 1 1 || | |
|
E E c
d
c LR LR LR
∆ −
∆ + ≤
≤ τ
τ
In the triangle formed by dual sensors and target,
LR R
L d d
d − |≤
|
anddLR≤|dL+dR |
, therefore, the
two inequalities 0≤c|τLR |≤dLR and
| 1 1 || |
E E c
dLR LR
∆ −
∆ + ≤ τ
ISSN: 1992-8645 www.jatit.org E-ISSN: 1817-3195
(b) When ∆E=1 , that is EL=ER . Where 0
| | LR =
c τ target located on the perpendicular
bisector of dual sound sensors, it can not determine the specific location by Eq. (12). To resolve this problem, dual sensors array can be rotated angle, problem solving becomes the first case (a), proposed location method is still valid.
For real time calculation of target azimuth, there gives analytic solutions in real-time computing. Eq. (11) can be expanded as:
= + − + + − = + − + + − 2 2 2 2 2 2 2 2 2 2 2 2 2 2 R S S R R S s R R L s s L L S S L L r y y y y x x x x r y y y y x x x x (13) Let 2 2 2 2 2 2 2 2 2 ,
, R R R S S S
L L
L x y R x y R x y
R = + = + = +
Then Eq. (13) can be transformed as:
= − − + = − − + 2 2 2 2 2 2 2 2 2 2 R s R s R S R L s L S L s L r y y x x R R r y y x x R R (14)
Solving Eq. (14),
x
S,
y
Sas following:Let R L R L
L L R R L R R L x x g y y f r R e R r b y x y x a − = − = − = − = − = , , , , 2
2 2 2 2 2
Then Eq. (14) can be transformed as:
+ + − = + + = a g R ex bx y a f R ey by x S R L S S R L S 2 2 (15)
Substituting Eq. (15) into
2 2 2
S S
S x y
R = + , it can
be expressed as
0 ) ( ) ( ) 2 2 2 2 ( ) ( 2 2 : 2 2 4 2 2 = + + + + − + + + + + R L R L S R L R L S ex bx ey by R a egx bgx efy bfy R g f (16)
Solving RS2 into Eq. (15), it can be solved target
location coordinates, Eq. (16) can be seen as a quadratic equation, the solutions as follows:
2
1 2 2
2 2 2 2 2 2 2 2 2 2
1 2 2
2 2 2 2 2 2
( ) ( ) ( ) ( )(( ) ( ) ) ( ) ) ( ) ( ) ( )(( ) ( )
L R L R L R
S
S
L R L R L R L R
L R L R L R
S
L R L R L R L R
by ey by ey bx ex f x
a a f g
f by ey bx ex f f g by ey bx ex a R a f g
bx ex gby ey bx ex f y
a a f g
by ey bx ex f f g by ey bx ex a
+ + + + = − + + + + + − + + + + − + + + + + = − + + −
+ + + − + + + + − 2 2
2 2 2
2 2 2
2 2 2 2 2 2 2 2 2 2
2 2 2
2 2 2
) ( ) ( ) ( ) ( ) ( )(( ) ( ) ) ( ) ) ( ) ( ) ( S
L R L R L R
S
S
L R L R L R L R
L R L R L R
S
L R L R
R a f g
by ey by ey bx ex f x
a a f g
f by ey bx ex f f g by ey bx ex a R a f g
bx ex gby ey bx ex f y
a a f g
by ey bx ex f f g
+ + + + + = − − + + + + − + + + + − + + + + + = − + + +
+ + + − + 2 2 2 2 2
2 2
)(( ) ( ) )
( )
S
L R L R
by ey bx ex a R a f g
+ + + − + (17)
3. VOLUME REVERBERATION MODELING
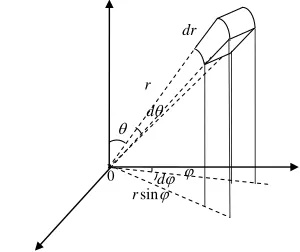
In underwater ultrasonic detection, volume reverberation is the main interference. The traditional volume reverberation theory mainly considers the remote detection, but this paper mainly studies close range detection. Therefore, the paper makes approximate processing according to traditional volume reverberation theory analysis method [7-10]. Coordinate system is established as shown in figure 2.
θ r
dr
θ
d
0 dϕ ϕ
ϕ
sin
[image:4.612.327.477.415.541.2]r
Figure 2: Scattering Unit Coordinate System
According to the coordinate system, volume reverberation model as follows:
) , ( )
,
(θ ϕ 2 θ ϕ
D I
Iro = rm
(18)
Where ( , )
2 θ ϕ
D is sound sensor directivity;
θ
isthe angle of direction vector and Z axis,
ϕ
is the angle of projection in XOY plane and X axis;) , (θ ϕ ro I
is sound intensity where the distance is r with target on (θ,ϕ) direction.
From sound source at r, the scattering power W
ISSN: 1992-8645 www.jatit.org E-ISSN: 1817-3195
v ro I
W = (θ,ϕ)α
(19)
Where αv is volume scattering coefficient,
)
,
(
θ
ϕ
sdI
is the sound intensity of dV scattering, the reverberant sound intensity of the dual sound sensors as:
r
s D e
r WdV
dI θ ϕ α
π
2 2
2 ( , )
4
−
=
(20)
Where α is marine medium absorption
coefficient. Substituting Eq. (18) into Eq. (20) that
=
=
−
−
r rm
r v
rm s
e
r
W
I
dVe
D
r
I
dI
β
α
π
γ
ϕ
θ
π
α
2 2
2 4
2
4
)
,
(
4
(21)
Where
γ
is clustering coefficient, and its value is:2
2
0 0
4
( , ) sin
d
R
d
π π
π
γ
ϕ
θ ϕ
θ θ
=
∫
∫
(22)
Eq. (22) integral that
dV D
r e W dI I
r v s
s ( , )
) 4 (
4 4 4
2 θ ϕ
π γ
α α
∫
∫
= −=
(23)
In Figure 2 coordinate system, scattering body unit dV can be expressed as:
dr
d
r
dV
=
2sin
θ
θ
Let the speed of sound in water is C, sound pulse width is τ, and volume reverberation intensity at r can be expressed as
4 2
4 2
2 0 0 2
2
4 4
0 0 2
2 2 2
0 0
( , ) sin (4 )
( , ) sin
4 ( , ) sin
d d
d d
c ar r v
s
r c ar r v
r
W e
I d D d dr
r
d D d
W e
dr r
d D d
τ π π
π π
τ π π
α γ ϕ θ ϕ θ θ π
ϕ θ ϕ θ θ α γ
π ϕ θ ϕ θ θ
− +
− +
=
=
∫
∫
∫
∫
∫
∫
∫
∫
(24)
2
4
0 0
2 2
0 0
( , ) sin
( , ) sin
v
d R d
D
d R d
π π
π π
ϕ θ ϕ θ θ
ϕ θ ϕ θ θ
=
∫
∫
∫
∫
(25)
Substituting (25) into (24):
4 2
2 4
d d
c ar r v v s
r
W V e
I dr
r
τ
α π
− +
=
∫
(26)
Eq. (26) solution as:
4 2 8
d
ar v v s
d
W d ce
I
r α τ
π
−
=
(27)
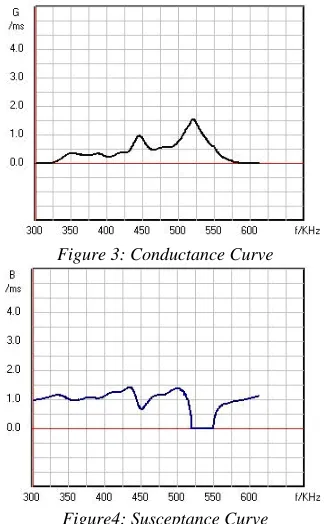
4. SIMULATION RESULTS AND ANALYSIS
The measured conductance and susceptance curves of dual sound sensors are shown in Figure 3 and Figure 4 , the frequency of the selected filled sine pulse signal is 525kHz , the signal period
[image:5.612.335.497.341.603.2]T=2.5ms, where the signal detection time width = 1ms , delay time = 1.5ms.
Figure 3: Conductance Curve
Figure4: Susceptance Curve
ISSN: 1992-8645 www.jatit.org E-ISSN: 1817-3195
4.1 Location Simulation with No Reverberation
Simulation results as shown in Figure 5. It can be seen from the diagram, two circles there are two intersections, and this is because of the mirror fuzzy phenomena of the linear array. To solve this problem, dual sensors is rotated 90 °, the proposed algorithm is used again, and the location of the target can be determined by twice location.
L R
[image:6.612.326.523.64.243.2]Dual Sensors Target Location
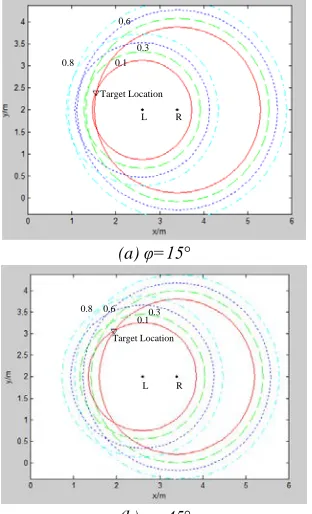
Figure.5: Joint Location under No Reverberation 4.2 Location Simulation with Volume Reverberation
There considering volume scattering coefficient of reverberation effects, the coordinates of dual sensors are (2.6,2,1.5) and (3.4,2,1.5), target moving along φ=15°, 45°, 85° direction at 1.5m from the array Centre. Volume scattering
coefficient (
α
v) respectively 0.1, 0.3, 0.6, 0.8, thesimulation results as shown in Figure 6.
0.1 0.3 0.6
0.8
L R Target Location
(a) φ=15°
0.10.3 0.6 0.8
L R Target Location
(b) φ=45°
0.1 0.3 0.6
0.8
L R Target Location
(c) φ=85°
Figure 6: Different Location Of The Target Under Reverberation
Root mean square error is calculated in different
directions and different scattering volume
coefficients, the formula as follows:
∑
=
− + −
= n
j
s j s
j x y y
x n rmse
1
2 2
) ˆ ( ) ˆ ( 1
(28)
[image:6.612.94.295.195.352.2] [image:6.612.117.273.457.714.2]Where n is the number of repeat test,
(
x
ˆ
j,
y
ˆ
j)
is the j-th location result, error analysis is shown in Table 1.Table 1: Error Analysis in Different Orientations and Different Scattering Volume Coefficients
rmse
α
vφ 0.1 0.3 0.6 0.8
15° 0.01 0.12 0.16 0.70
45° 0.02 0.06 0.18 0.82
85° 0.04 0.23 0.30 1.35
The simulation results show that the proposed dual sound location algorithm that joint pressure difference and time difference signal, in the lower reverberation conditions can quickly determine the target, its location accuracy associates with the target's orientation. When the normal angle of the target and dual sensors array tends to 0, because the received energy between two sensors is very near,
E
∆ close to 1, if the reverberation is larger, the signal energy by error impact will be larger, small error may make the energy ratio changed from
E
∆ >1 to <1, the location result will be inaccurate. In order to improve the location precision and reliability, received signals need to be a more detailed analysis.
5. CONCLUSION
ISSN: 1992-8645 www.jatit.org E-ISSN: 1817-3195
model and time difference location model, the dual sound location algorithm of joint pressure difference with time difference signal is proposed, and derives the analytic solution for real-time location. Linear array mirror fuzzy problem can be solved by second location with rotating dual sensors 90°. The problem that the target is unable to location when it is located in perpendicular bisector is solved by dual sensors rotating angle. Underwater volume reverberation model is established. Simulation results show that the algorithm under low reverberation conditions can obtain a good location effect. Under large reverberation, in order to improve the location precision and reliability, received signals need to be a more detailed analysis.
ACKNOWLEDGMENTS:
The work is supported by Doctoral Foundation (200802880002).
REFERENCES:
[1] Kuang Gongxian, Wang Gang, Tang Guilin, “Transmitted & Received Beam Forming Based on Integrated Architecture”, Computer Measurement & Control, No.5, 2011, pp.1122-1124.
[2] Yuan Shenfang. “Research on Structural
Health Monitoring Technology Based on Ultrasonic Phased Array Theor”.
Nanjing:Nanjing university of aeronautics and astronautics, 2010, pp. 1-10.
[3] Francesco Guarato, Lasse Jakobsen, Dieter Vanderelst, etc. “A method for estimating the orientation of a directional sound source from source directivity and multi-microphone recordings: Principles and application”, J. Acoust. Soc. Am, Vol.129, No.2, 2011, pp.1046-1058.
[4] Wong ASW, Chalup SK,”Towards
visualization of sound-scapes through
dimensionality reduction”, 2008 IEEE
International Joint Conference on Neural Networks, IEEE(Hong Kong), 2008, pp.2833-2840.
[5] Tan Juqin, Zhao Guoku, Chen Hejuan,
“Double-gate Controlled the Cycle of Self-modulation Method Against Neighboring Interference for Underwater Acoustic Fuze”, Journal of Detection and Control, Vol. 32, No. 1, February 2010, pp.49-53.
[6] Pu Cheng, Zhang Tao, Qi Lei. “Signal
processing in transit time ultrasonic flow measurement based on correlation”, Journal of Data Acquisition and Processing, Vol. 26, No.5, 2011, pp.559-563.
[7] Zhou Yijun, Peng Lidong, “The model analysis of volume reverberation for broadband Acoustic Doppler Current Profile”, Technical Acoustics, Vol. 31, No. 2, April 2012, pp.179-183
[8] Liu Dezhu, Sun Dajun, Zhang Dianlun.
“Performance of a broadband acoustic Doppler
current profiler”, Journal of Harbin
Engineering University, Vol. 31, No. 3, March 2010, pp.307-311.
[9] Li Ting, Liu Chunwu, Huang Zhiping, Guo Xiye, “Modeling and Simulating of Ship Wake Echo Signal”, Computer Simulation, Vol. 28, No. 6, June 2011, pp.26-29.
[10] GUO Xiye, SU Shaojing, WANG Yueke,
“Research on Linear Prediction of
Multi-channel Seafloor Reverberation”, Acta