ISSN: 1992-8645 www.jatit.org E-ISSN: 1817-3195
COMPUTATIONAL LOAD DISTRIBUTION METHOD IN A
PRIVATE CLOUD OF A MOBILE APPLICATION OF AN
INTEGRATED ENTERPRISE INFORMATION SYSTEM
VLADIMIR VYACHESLAVOVICH KOPYTOV
Infocom-S
Matrosova St., 65A, Stavropol, 355037, Russian Federation
ANDREI OLEGOVICH SHULGIN
Infocom-S
Matrosova St., 65A, Stavropol, 355037, Russian Federation
NIKITA GEORGIEVICH DEMURCHEV
Infocom-S
Matrosova St., 65A, Stavropol, 355037, Russian Federation
VLADIMIR VIKTOROVICH NAUMENKO
Infocom-S
Matrosova St., 65A, Stavropol, 355037, Russian Federation
ANDREI VLADIMIROVICH GRITSENKO
Infocom-S
Matrosova St., 65A, Stavropol, 355037, Russian Federation
SERGEI ALEKSANDROVICH FEDOROV
Infocom-S
Matrosova St., 65A, Stavropol, 355037, Russian Federation
ABSTRACT
The use of cluster technology in a private cloud of a mobile application of an integrated enterprise information system requires the measures ensuring the reliable operation of its hardware component to be developed. The solution of this problem involves the use of effective mechanisms for maintaining high availability of a private cloud of a mobile application as well as the solutions to ensure the failover operation of server and client components. This paper describes the method of load distribution among computer network nodes in a private cloud of a mobile application integrated in a corporate information system; this proposed algorithm is based on the load prediction of the computer system, it performs the preliminary resources reservation required to perform a given task, initiated by user request. Load prediction is performed by the decomposition analysis of the history of running user tasks, which is a preliminary allocation of recurring task patterns with a certain set of parameters and with further prediction of occurrence of these problems in queue. The proposed method greatly enhances the productivity of a mobile application; it expands the set of the functions performed by the remote client by request and ensures the integration of several information systems on the basis of a single private cloud.
Keywords: Mobile Application, Information System, Cloud, Load Forecast, Resource Management System
1. INTRODUCTION
Nowadays mobile applications are used to expand the functions of corporate information systems (CIS); they have an access to various organization subsystems for the remote management of business processes. Due to this fact, there are lots of different software solutions for mobile platforms, focused on fulfilling the tasks of a CIS, in the application market.
ISSN: 1992-8645 www.jatit.org E-ISSN: 1817-3195 applications is performed without considering any
interface and architectural models of information
[image:2.612.128.484.136.461.2]systems already described, which leads to an increase in development time.
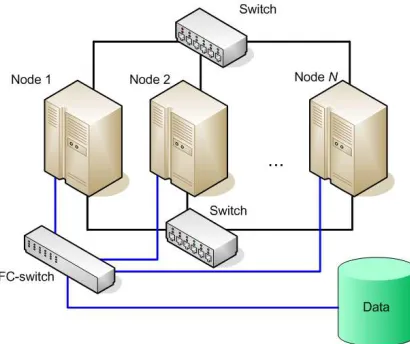
Figure 1. Conceptual architecture of integrated CIS
This architecture of integrated system (see Figure 1), resulting from the use of this technology, includes the following component units:
- enterprise information system with extension subsystems is a software package for data and processes conversion, parts of the CIS;
- a private cloud, the infrastructure of the organization of computing power, designed for the remote control of business processes with the use of mobile platforms;
- mobile applications, providing a user interface for the remote control of business processes in CIS.
One of the necessary requirements for an integrated CIS, developed with the use of the proposed technology, is the possibility of adjusting it for different CIS architectures and the number of simultaneous client connections. So the use of cloud technology requires the solution of an
important task of computational load distribution among the system components. A private cloud of mobile application is a central control subsystem in the CIS architecture as part of the technology; it implements the processing of all requests from the client devices in the CIS. Taking this into account, it is necessary for the computational load distribution technology proposed in the study to perform the balancing of load among the private cloud servers.
2. METHODS
ISSN: 1992-8645 www.jatit.org E-ISSN: 1817-3195 ensure the request processing in a user reasonable
time. Therefore, when developing and constructing cloud-based solutions it is necessary to implement methods for monitoring and obtaining information about the availability and load of platform hardware resources, with the copies of distributed applications, as well as balancing, i.e. the distribution of incoming user requests among the available hardware platforms.
The analysis of existing solutions on the load distribution among the cloud servers is described in [7], comprising: balancing traffic with passing it through a single balancing device; balancing with cluster means; balancing traffic without passing it through a single balancing device. This paper in addition to mentioned solutions also provides a method for the implementation of the server platform feedback to a device distributing the incoming requests from users. The server transmits to a control device data such as the amount of available memory, the performance of the data bus and the network interface, the amount of available disk space, and so on. The control unit calculates the optimum load distribution ratio with a help of special program based on those data.
However, despite the availability of alternative solutions, the cluster technology of load balancing among cloud servers allows to achieve the best results in terms of performance and fault tolerance through continuous interaction between nodes and flexible response to changes in the volume of requests received from users. Therefore, in this work, we implemented a computer system – a server cluster for deploying private clouds of mobile CIS application implementing the effective load distribution among the nodes.
2.1. Physical architecture of a private cloud of a mobile application of an integrated enterprise information system
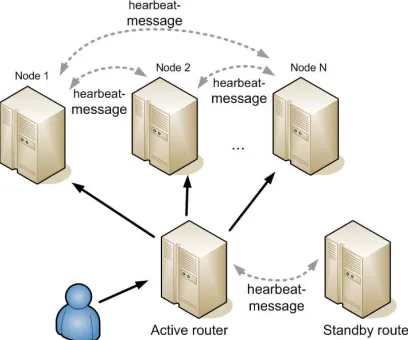
Let us look at the physical architecture of a private cloud of a mobile application of an integrated enterprise information system. Any cluster system includes some servers (or nodes) and an external storage unit available to each of them. To ensure maximum performance in this cluster, each node in the cluster has the same hardware characteristics and is equipped with a network card for two network interfaces; one of them is intended for the integration in the overall network and is used to service client connections. Servers are connected in a single network with the help of a second interface, thus organizing a private cluster
[image:3.612.314.519.140.312.2]network. A switch with 10 Gb optical ports is used to connect servers (see Figure 2).
Figure 2. Local Private Cluster Network Of A Private Cloud Of A Mobile CIS Application
Service resources of cluster and server-side data of mobile application are stored in the external storage. The external storage is a failover solution; FibreChannel (FC) technology with SAN protocols (StorageAreaNetwork) is used to connect the external storage to servers [19].
The server-side software of a mobile application is installed on each of the servers in the cluster of this system. This active LVS-router performs the load distribution among nodes; it is a server with installed software packages: LinuxVirtualServer and Heartbeat [8]. In addition, the active LVS-router also checks the service health on each real server. The backup LVS-router is also provided to ensure failover; it monitors the active LVS-router and takes the function of the latter in case of its failure.
The active router with the help of a scheduler performs the distribution of requests across the cluster nodes according to a predetermined configuration. By default, the algorithms such as round-robin servicing (new incoming connections are assigned to each server in queue), weighted round-robin servicing (round robin servicing with an additional weighting factor to compensate the difference in server computing power), on the least number of connections, as well as the smallest number of connections weights (see Figure 3).
ISSN: 1992-8645 www.jatit.org E-ISSN: 1817-3195 server resources, but also the forecasts of future
[image:4.612.91.295.136.306.2]conditions characterized by loading the cluster nodes.
Figure 3. Distribution Of User Requests Among The Cluster Nodes Of A Private Cloud Of A Mobile CIS
Application
2.2. Method of computational load distribution in a private cloud of a mobile CIS application
The solution proposed in this work is aimed to improve the efficiency of the user queries distribution process for the nodes of a computer system and to reduce requests waiting time in the queue. The designed algorithm of resources distribution performs the prediction of the load of the computer system and performs the preliminary reservation of resources required to perform a given task, initiated by user request. This approach allows to perform tasks immediately after user initialization, since in this case there is no need to wait for the deallocation of the required resources.
The proposed method of solving the problem of user tasks distribution on the computing nodes of the distributed system consists of three steps.
The decomposition analysis [9] is performed at first step in order to identify patterns of repetitive tasks, initialized by users of a distributed system.
There is one characteristic feature of a big CIS: the user task flow contains sets of repetitive tasks, and tasks from the same set have similar values of initialization parameters such as the number of requested resources: CPUs, memory, CPU time, and others. Therefore, these data sets were used as the prediction objects, i.e. the time of their occurring in future is predicted. A machine learning method is used to solve the problem of prediction,
and a neural network is used as the trainee element. Besides the parameters of the initialization tasks (resources used), the task parameters such as job location in the pattern and the length of the corresponding pattern are also used as input data.
Step 1. The time series is formed first; it is a data set in a multidimensional space where each point corresponds to the space, and the initialization job parameters stand for measurements, among them: the number of requested resources, CPU time, and a group of users. Taking into account the availability of the data set of tasks having similar parameters, we can conclude that the pronounced clump (clusters) of points of high density is present in the spatial representation. Let us use the method of agglomerative hierarchical clustering to determine the data clusters [10-12].
The essence of this method is as follows. Initially, each point of the data set is a single cluster. Then the cyclic process of cluster merging begins at the pairs of clusters with the smallest metric (measure of the distance between two objects); they are combined into a new cluster. This process continues until there is a single cluster at the output which comprises a whole set of initial data. The complexity of the hierarchical clustering method is estimated as cubic, and that is quite resource intensive, especially for large data sets. On the other hand, given the initial objective, i.e. the identification of components in time series – patterns of repetitive tasks, there is no need to complete the hierarchical clustering process to the very end and to get a single cluster. Taking into account the assumption that the parameters of the tasks of a single pattern should have similar values, we introduce a threshold for a metric, above which clusters stop uniting and the hierarchical clustering process is completed.
An average connection metric is used in this study to determine the patterns of repetitive tasks; it calculates the proximity of the clusters according to the formula:
∑∑
∋ ∋
⋅
x Ay By
x
d
B
A
(
,
)
1
,
where A and B are the clusters between which the distance is estimated according to the selected distance d.
ISSN: 1992-8645 www.jatit.org E-ISSN: 1817-3195 threshold as follows. The pair of considered clusters
is combined into a single one only if the estimated distance between these two cluster metric values is no more than twice bigger than that of the corresponding metric value calculated for any of these clusters. The choice of this threshold is based on the results of a preliminary analysis of some of the repetitive task patterns [13-14].
Step 2: The process of hierarchical clustering is completed when there are no pairs of clusters for which the metric value satisfies the threshold conditions. The next step of the algorithm is to form the task patterns, corresponding to the obtained data clusters of dimension greater than “1”. To do this, all points of each cluster are arranged in ascending order of initialization task time. At this point, the frequency of task occurrence within each pattern is determined: the pattern period is calculated as the average time difference between two successive initialization tasks.
Step 3: The third and final step of the algorithm is the prediction of occurrence of the next tasks for each pattern. The sets of periodic components – patterns of repetitive tasks – are the input data at this stage of the algorithm; on their basis the proposed prediction model determines whether some task belonging to one of the patterns occurs or not at any given time.
The following approach has been proposed to implement this: it is based on the use of an artificial neural network and can be divided into two key steps. The first step is prolongation (taking into account the calculated frequency) of the identified patterns of repetitive tasks; thereby the future state of the computing cluster is predicted. Given that the task parameters in the same pattern may vary only slightly, we proposed to use the average values of the parameters for the predicted tasks, similar to the calculation of the frequency of occurrence of the pattern tasks.
The proposed algorithm calculates the confidence factor for each individual task pattern, thereby determining the real possibility of the task occurring in the queue of user tasks. A decision to reserve resources for the predicted tasks is taken on the basis of the calculated value of the confidence factor.
The proposed algorithm for calculating of the confidence factor for the predicted task is a method of machine learning by instruction, namely training of a multilayer artificial neural network.
Consider the characteristics of the applied neural network. The following parameters of user tasks in addition to the requirements on computing resources are supplied to the input layer of the neural network, enabling a unique determination of a reference pattern:
- The period of task repetition in the pattern;
- Place (at what point) this task occurs in the pattern;
- The total number of tasks in the pattern length.
The output of the neural network is the binary value of “0” or “1”, which defines the tasks belonging to the pattern, and also determines the decision to reserve resources for predicted tasks.
The neural network training with the algorithm of back propagation of error is used for more precise adjustment of the artificial neural network, and the choice of weight coefficients allows to change the weight coefficient of each neuron according to its contribution to the overall result. The efficiency of a neural network depends primarily on its topology – the number and size of hidden layers; thus, common practice is to use hidden layers of equal size, exceeding the size of the input layer and to evaluate it using indicators such as the objective function, the accuracy and sensitivity of the implemented algorithm.
Given that the averaged values of task parameters belonging to the same pattern are used for forecast preparation, resource reservation for the predicted task is performed by taking into account the possible errors. Similarly, when determining the resource reservation time, we take into account that the task repetition period within a single pattern is calculated as the average value of the difference of two consecutive task initialization times. It remains possible to release the reserved resources if they are not sufficient for the full implementation of the predicted tasks arising, for example, by delaying the initialization of the task.
An artificial neural network is a system of connected and interacting layers, each of which in turn consists of simple modules (artificial neurons). Each module of such a network has to deal with only two types of signals:
- signals which it receives from the other modules of the preceding layer or from the initial data, in case it is the first layer (input) module;
ISSN: 1992-8645 www.jatit.org E-ISSN: 1817-3195 - signal
h
Θ( )
x
sent by last (output) layermodules, the output signal includes the resulting data of an artificial neural network.
It is noteworthy that the layers located between the input and output layers are called the hidden ones. Interaction between the modules of different layers is supervised by a set of special matrices
( ) ( )
K
,
,
2 1Θ
Θ
the elements of which are calledthe parameters of the artificial neural network, and its weights can be represented by the following formula:
( ) ( ) ( )
Θ
=
∑
=
+ sl
i
l i l ji l
j
g
a
a
1 1
,
where
( )l i
a
– the value of the i-th neuron of layer
l,
s
l – the number of neurons in layer l, ( )lΘ
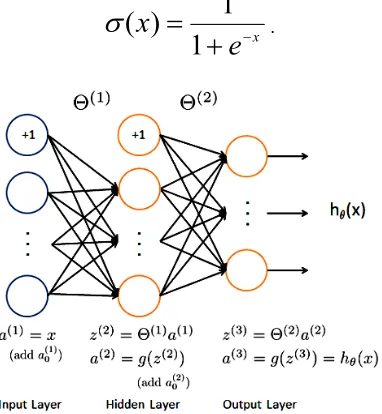
–matrix with the values of the transformation of neurons from layer l, g – the neural network activation function [15].
The logistic function
σ
(
x
)
(sigmoid) is often selected as the function for the neural network activation. This choice is determined by the fact that the sigmoid allows to introduce some non-linearity to the network, but it does not change the result of its work as much. Moreover, the area of the logistic function values lies in the interval [0;1], which is an advantage for the use in the framework set by the prediction task.x
e
x
−+
=
1
1
)
(
[image:6.612.100.291.487.694.2]σ
.Figure 4. Schematic Representation Of Values Calculation At The Different Layer Modules
Figure 4 shows the above-described process for the artificial neural network with one hidden layer. We can see that each layer except for the output one contains an additional module, equal to “1”. These modules are called offset modules, and their presence in the artificial neural network ensures the convergence to a local extreme point.
The process of artificial neural network training is a logical “run” through all of the elements of a primary data set in order to find the values of the
transformation matrix elements
Θ
to minimize theobjective function
J
( )
Θ
, which thus is a functionof parameters
Θ
for the case of a single neuron in the output layer and is calculated by the formula:,
where m – number of items of input data used for
artificial neural network training;
k
y
– the actualoutput value for the k-th element of the input data;
( )
kx
h
Θ– output value for the k-th element of the input data obtained as a result of the artificial neural network; L – the number of layers in the neural
network;
s
l – the number of neurons except of thebias neurons in layer l;
( )l ji
Θ
– conversion coefficient of the i-th neuron of layer l to the j-th neuron if layer l + 1. It should be noted that the transformation matrix elements are initialized with random values at the first pass of learning algorithm.
The second summand in this formula is an regularization element, where λ is the regularization parameter, which is used to reach a compromise between the two competing objectives: on the one hand, the artificial neural network should as accurately as possible simulate the described process; on the other hand, the values of the
transformation matrix elements
Θ
should be sufficiently small to avoid retraining the neural network.The minimization of the objective function
( )
Θ
ISSN: 1992-8645 www.jatit.org E-ISSN: 1817-3195 Nevertheless, regardless of the choice of
optimization method, in order to implement the objective function convergence process to a local extreme point at all the parameters, it is necessary to calculate the partial derivatives of all the
elements of the transformation matrix
Θ
at each step of the gradient descent. The back-propagation algorithm is used in the field of artificial neural networks just for this purpose; it actually implements the training of artificial neural network.The idea of this algorithm is to calculate errors
( )l j
δ
for each k element of training set of input data, introduced to the final result by the j-th neuron in layer l. It should be noted that the error calculation begins with the computation of the output layer and is not performed for the input layer, as the values of neurons of that layer are the input ones. The errors of the j-th neuron for the output layer L are calculated by the formula:
( )
j j L
j
=
h
Θ(
x
)
−
y
δ
.Error calculation formula for all the other layers up to the first hidden layer is as follows:
( )
[
( )
( ) ( )]
( )
( )l j l T l j lj
=
Θ
⋅
g
′
z
+1
δ
δ
.As we can see, the derivative activation function is used to calculate the neuron error; it is equal to
sigmoid
σ
(
x
)
:(
1
(
)
)
)
(
)
(
x
σ
x
σ
x
σ
′
=
⋅
−
.The apparent simplicity of computing of logistic function derivative is an additional reason for the use of sigmoid function as the activation function for the neural network.
The next stage of the error back propagation method is to compute the elements of the matrices
of partial derivatives
( )
( )
Θ
Θ
∂
∂
J
l ji : ( )( )
( )[
l]
ji l
ji l
ji
m
J
Θ
=
∆
+
Θ
Θ
∂
∂
λ
) (1
,where
∑
( )= +
=
∆
m k k l j k l i l jia
1 1 ) ( ) (δ
.In this case, each element
) (l
ji
∆
is a common error, introduced by the i-th neuron in layer l to the value of the j-th neuron of the next layer (l + 1) for the training time of artificial neural network at the
m objects of the training set of input data. A more detailed description of the training process of an artificial neural network and output of the above formulas are presented in [16].
Thus, the training process of an artificial neural network consists of the following steps:
1. Initialize the initial values of the transformation matrices with random numbers.
2. Compute
( )
k
x
h
Θfor each member
x
k of the input training set.3. Calculate the value of the objective function
( )
Θ
J
.4. Implement the error back propagation method to calculate the partial derivatives
( )
( )
ΘΘ ∂ ∂ J l ji .
5. Use the gradient descent or any other method of nonlinear optimization to
minimize the objective function
J
( )
Θ
.The following characteristics of repetitive tasks grouped in patterns are chosen as input data for the prediction algorithm using an artificial neural network:
- task initialization time;
- number of requested processors;
- amount of requested CPU time;
- volume of the requested memory;
- actual performance time;
- initializing member (number);
- user group (number);
- task priority;
- pattern length in tasks (which this task belongs to);
- task place in the pattern;
- task repetition frequency in the pattern.
ISSN: 1992-8645 www.jatit.org E-ISSN: 1817-3195 is a sigmoid, the output values
h
Θ( )
x
are in factwithin the range of [0;1].
In this case, there is question about the magnitude of the threshold, according to which the positive and negative output signals are separated. As part of the problem being solved positive output signal (“1”) indicates that the task and its parameters which were transferred as the input data is valid and is initialized by the user; and resources are reserved to solve it, the negative output signal (“0”) indicates that the task is displayed in the task flow.
F1 metric [17] is used to determine the exact magnitude of the threshold; its main idea is to evaluate the effectiveness of teaching algorithm, using the indicators of accuracy and sensitivity at the same time:
Recall
Precision
Recall
Precision
F
+
⋅
⋅
=
2
1 .
The range space of F1 metric is the interval [0;1], so the more is the metric value, the better are the accuracy and sensitivity ratio.
To select the topology of the neural network the following architectures were analyzed:
- 1 hidden layer containing 10 neurons;
- 5 layers with 10 neurons in each;
- 1 layer with 25 neurons;
- 10 layers with 10 neurons in each.
Based on the computational experiments [9], it was concluded that the network with 10 layers with 10 neurons in each layer has the highest rate of training; on the other hand, the use of this architecture leads to a strong retraining of the neural network. The final choice of the architecture is made in favor of a neural network with 5 layers of 10 neutrons in each, after the objective functions obtained for test data sets and the number of correctly predicted values were compared.
The evaluation of the effectiveness of the resulting algorithm is performed on the next stages of this work and is based on a specially developed comparison method. As part of this procedure, a proposed method for the load forecasting using machine learning is compared with existing algorithms of the computational load distribution by using the following performance indicators:
1. Turnaround time (turnaroundtime) is calculated as the difference between the time of the last task completion in the queue and the
initialization of it. The significance of this assessment is indisputable, since its calculation takes into account not only the execution time of all tasks in the queue, but also the time it takes the system to make a schedule. Thus, not only the assessed effectiveness of the scheduling algorithm was estimated, but its time complexity as well. Extreme point direction – min.
2. The use of system resources (systemusage) is calculated according to the formula
(
com req)
used
CPU CPU
CPU SU
; min
= .
This indicator allows to evaluate the effectiveness of scheduling from the economic point of view; in this case, a higher value of the index usually corresponds to a lower value of working time. Extreme point direction – max.
3. Slower task execution (slowdown) is defined as the ratio of the task processing time j to its direct performance by the cluster computing resources:
∑
−−=
j j j j j
R F
S F
SD .
This criterion includes simultaneously the values of the response time and the waiting time, but it is a more preferable choice due to the fact that is a dimensionless value and, therefore, provides a more objective evaluation. Extreme point direction – min.
The experimental study of the proposed algorithm was performed using a Alea3 computer system, developed in 2007 at the Faculty of Informatics in Masaryk University (Brno, Czech Republic) by professor Dalibor Klusáček and Hana Rudová as a result of the research grants No. 0021622419 and No. 201/07/0205 and is a modular simulator, based on the computing of the variety of events, such as adding tasks to the queue and the completion of the task [18]. Article [20] presents the results of computational experiments, where the proposed method was compared with existing approaches, including:
- queue-oriented algorithm: FCFS, SmallestJF (smallest (amount of required resources) task – the first), a conservative method of backfill (ConsBF), the EASY backfill method (EASY-BF), LCFS, ShortestJF (the shortest task – the first), FirstFit, task distribution algorithm used in the PBS-Pro scheduler;
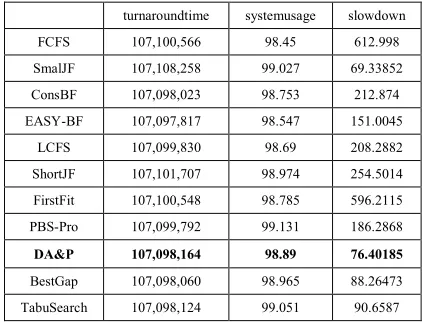
ISSN: 1992-8645 www.jatit.org E-ISSN: 1817-3195 Experimental studies have shown the superiority
[image:9.612.88.299.246.407.2]of the proposed planning method (DA&P) over the applied algorithms in modern distribution systems (see Table 1). This superiority over queue-oriented methods can be explained by the fact that the use of data proposed prediction method is based on the operation principle of schedule-oriented method using the information on the whole task flow for the most suitable timetable.
Table 1. Performance Of Various Scheduling Algorithms, Obtained From The Simulation Environment Alea 3
turnaroundtime systemusage slowdown FCFS 107,100,566 98.45 612.998 SmalJF 107,108,258 99.027 69.33852 ConsBF 107,098,023 98.753 212.874 EASY-BF 107,097,817 98.547 151.0045 LCFS 107,099,830 98.69 208.2882 ShortJF 107,101,707 98.974 254.5014 FirstFit 107,100,548 98.785 596.2115 PBS-Pro 107,099,792 99.131 186.2868
DA&P 107,098,164 98.89 76.40185
BestGap 107,098,060 98.965 88.26473 TabuSearch 107,098,124 99.051 90.6587
The high level of effectiveness of the proposed algorithm allows to use it for the distribution of user requests in a private cloud of a mobile application in the form of the CIS requests for LinuxVirtualServer scheduling package implementing the efficient allocation of tasks among the user nodes in the cluster.
3. RESULTS AND DISCUSSION
The result of the work on the development of the computational load distribution method in a private cloud of mobile application, which uses the prediction of the future load on the base of repetitive task patterns identified through decomposition analysis, allows to make the following conclusions:
1. Based on the theoretical studies it was found that the performance of task scheduling algorithm for predicting the future load on the basis of the decomposition analysis in case of effective detection of repetitive task patterns and teaching a neural network allows to respond quickly to the random and subjective effects on the task flow.
2. The task execution scheduling algorithm with predicting of the future load of distributed computing systems with the decomposition analysis
is based on formal means of traditional mathematics, and its technical implementation has no fundamental difficulties.
3. The technological and software solutions used for the implementation of the developed algorithm generally do not result in a significant increase in the resources cost on development of a task management system and the allocation of resources, allowing it to be used for the distribution of user requests in a private cloud of mobile CIS application as a request scheduler.
The method of processing load distribution among the nodes of the cluster was developed and proposed in this study; it is based on the load prediction with the use of decomposition analysis and has a number of advantages over existing methods which are used in modern systems of task management and resource allocation data centers, which was revealed by the Alea 3 simulation environment. This superiority over queue-oriented methods is explained by the fact that the use of the developed data prediction method is based on the operating principle of the schedule-oriented methods which take the data on the whole task flow for the most suitable timetable.
4. CONCLUSION
Thus the application of the method of computational load distribution among the nodes in the cluster significantly improves the performance of mobile applications and allows to expand the composition of the functions performed by the remote client request and to ensure the integration of several information systems on the basis of a single private cloud. At the same time the method of user requests distribution, developed and proposed in the present study, based on load forecasting and decomposition analysis, has a number of advantages over existing methods which are used in modern systems of task management and resource allocation data centers, as well as developed approaches in the field of prediction algorithms to improve the efficiency of scheduling.
ISSN: 1992-8645 www.jatit.org E-ISSN: 1817-3195 the predicted user tasks, so as to make an adequate
respond to the changes in the task flow occurring over time.
5. ACKNOWLEDGEMENT
The study was carried out as a part of the research project: “Development of cross-platform technology to build mobile applications with the specified integration contours to improve the functionality and resource efficiency of enterprise information systems” within FTSPIR 2014-2020 (the unique identifier RFMEFI57614X0066 for Applied Scientific Research), with the financial support from the Ministry of Education and Science of the Russian Federation.
REFERENCES:
[1] Kopytov, V.V., S.A. Shulgin and S.A. Fedorov, 2015. Development of the Integration Environment Architecture of Cross-Platform Media of Mobile Applications with Enterprise Information Systems. International Research Journal, 7-1(38): 51-54.
[2] Platonov, Y.G., 2011. Development of Mobile Applications for the Corporate Information Systems. Problems of Informatics, 3: 15-33. [3] Kornienko, N.S., S.A. Tsololo and K.B.
Yusupov, 2012. Modern Frameworks for the Development of Cross-Platform Mobile Applications. In Informatics and Computer Technology 2012, pp: 257-262.
[4] Noskov, I.I. and A.A. Ponomarev, 2013. Development of Services for Working with Medical Instruments and the Development of Mobile Applications for the WindowsPhone Platform to Monitor the Vital Health Indicators of a Patient. Siberian Journal of Science, 3(9): 101-106.
[5] Datev, I.O. and A.S. Shemyakin, 2013. Information Systems for the Data Extraction on the Mobile Devices Movement. Proceedings of the Kola Scientific Center of the Russian Academy of Sciences. Information Technology, 4(18): 46-64.
[6] Ryndin, A.A. et al., 2003. Design of Enterprise Information Systems. Voronezh: Quarta. [7] Ponomarev, A., V. Noskov and K. Krinitsyn,
2011. Balancing in the Clouds. Open Systems, 9: 38-42.
[8] Dow, E.M., 2008. Set up a Web Server Cluster in 5 Easy Steps. Date Views 15.09.2015
www.ibm.com/developerworks/ru/library/l-linux-ha.
[9] Gritsenko, A.V., Demurchev, N.G., Kopytov, V.V., Shulgin, A.O., 2015. Decomposition analysis and machine learning in a workflow-forecast approach to the task scheduling problem for high-loaded distributed systems. Modern Applied Science, 9 (5), pp. 38-49. [10] Kaufman, L. and P.J. Rousseeuw, 1990. Finding
Groups in Data: An Introduction to Cluster Analysis. New York: John Wiley.
[11] Hastie, T., R. Tibshirani and J. Friedman, 2009. The Elements of Statistical Learning. New York: Springer, pp: 520-528.
[12] Gritsenko, A., 2012. Prediction of DRMS Workload by Identification of Patterns in Job Submission Processes. Journal of International Scientific Publications: Materials, Methods and Technologies, 6(1): 93-100.
[13] Klusáček, D. and H. Rudová, 2009ю Complex Real-Life Data Sets in Grid Simulations (Abstract). In Cracow Grid Workshop 2009 (CGW'09) Abstracts.
[14] Klusáček, D. and H. Rudová, 2010. The Importance of Complete Data Sets for Job Scheduling Simulations. In Job Scheduling Strategies for Parallel Processing (JSSPP 2010), LNCS 6253, Springer, pp: 132-153.
[15] Bishop, C.M., 2006. Pattern Recognition and Neural Networks. Springer.
[16] Murphy, K.P., 2012. Machine Learning: A Probabilistic Perspective. MIT Press.
[17] Olson, D.L. and D. Delen, 2008. Advanced Data Mining Techniques. Springer.
[18] Klusáček, D. and H. Rudová, 2010. Alea 2 – Job Scheduling Simulator. In Proceedings of the 3rd International ICST Conference on Simulation Tools and Techniques (SIMUTools 2010), ICST.
[19] Mishechkin, A., 2008. Cluster Differs the Other Cluster. Part 1: Rules for Structuring of Cluster Systems Based on WindowsServer 2003. Windows IT Pro, 5. Date Views 15.09.2015 www.osp.ru/win2000/2008/05/5529265. [20] Gritsenko, A., 2013. A Modern Approach to