ORIGINAL RESEARCH ARTICLE
STATISTICAL ANALYSIS OF WELD REPAIR LENGTH IN AEROSPACE PRESSURE VESSELS
1,*
Mohan, M.V.N.,
1PremaKumar, M.,
1Gowri Shankar Wuriti and
2Babu, M.R.M.
1
Scientist, Directorate of Reliability and Quality Assurance, Advanced Systems Laboratory
2
Director, Advanced Systems Laboratory, Dr. APJ Abdul Kalam Missile Complex, Defence Research &
Development Organisation, Hyderabad-500058
ARTICLE INFO ABSTRACT
Welding is a governing process in realization of aerospace pressure vessels. In defence and aerospace industry, ultrahigh strength materials viz maragingsteel is being used for realization to meet the mission requirements. The fracture based design is adopted for pressure vessels. The quality of welding is ensured by qualifying the welding process, through procedure qualification, use of qualified welders and Non-destructive testing. Weld joints are inspected using Non destructive testing such as Radiography testing, Ultrasonic testing, Die penetrant testing etc. The weld repairs are carried out when a defects is noticed in Non-destructive testing. The percentage Weld repair length for each weld joint is one of the quality control parameter. Excess weld repair length affects the Factor of Safety of hardware there by performance over a period of time. This necessitates close monitoring of process efficiency and reliability by monitoring weld repair length. Practicing codes, standards, the welding process and personnel qualification are established. The Weld repair length is satisfactorily analyzed to evaluate the process variation and efficiency of process. Use of quality control tools such as control charts help in continuous monitoring and to take necessary corrective actions. This paper uses data from Non-Destructive Testing and quality control tools to predict the trends and process behavior of GTAW welding of Maraging steel Grade 250.
Copyright © 2019, Mohan et al. This is an open access article distributed under the Creative Commons Attribution License, which permits unrestricted use, distribution, and reproduction in any medium, provided the original work is properly cited.
INTRODUCTION
The pressure vessels of aerospace are designed with challenging factor of safety between 1.125 to 1.25. This implies that there shall be close monitoring and control of hardware realization processes. Welding is most governing process in realization of aerospace structures. At the present monitoring and control activities include use of code practices, standards, welder qualification and non-destructive testing. Weld repair length is a parameter that has a potential impact on service life of the hardware and may also adds cost to fabrication. There is necessity to monitor the weld repair length and control it with in certain limits. Use of statistical process control tools such as control charts help monitoring the weld repair length.
*Corresponding author: Mohan, M.V.N.,
Scientist, Directorate of Reliability and Quality Assurance, Advanced Systems Laboratory.
It is also useful in determining capability of the fabricator to predict the process behaviour and take necessary corrective actions. This paper uses data of percentage of weld repair length and quality control tools to predict the trends and process behaviour of GTAW welding of Maraging steel Grade 250 pressure vessels.
Maraging Steel: Maraging steel is low alloy ultrahigh strength steel with superior fracture toughness properties. The high strength is not because of the carbon but it is attributed to precipitation of intermetallic precipitates. The main alloying element of maraging steel is Nickel that vary from 15 – 25% and rest are Molybdenum, Cobalt, titanium. These are added to produce intermetallic precipitates. The advantages of Maraging steel include excellent mechanical properties, good processing and fabrication characteristics and easy heat treatment. Maraging steels are readily hot worked by conventional rolling and forging operations. Hot rolled or annealed maraging steels are easily cold worked.
ISSN: 2230-9926
International Journal of Development Research
Vol. 09, Issue, 02, pp.25893-25897, February, 2019
Article History:
Received 11th November, 2018
Received in revised form 16th December, 2018
Accepted 10th January, 2019
Published online 28th February, 2019
Key Words:
Welding, Heat Treatment, Maraging steel Grade 250, Non-destructive testing, Weld repair length.
Citation: Mohan, M.V.N., PremaKumar, M., Gowri Shankar Wuriti and Babu, M.R.M. 2019. “Statistical analysis of weld repair length in aerospace
pressure vessels”, International Journal of Development Research, 09, (02), 25893-25897.
Maraging steels have good weldability. The hardware can be heat treated after fabrication to enhance the mechanical properties with minimum distortion due to low temperature (480º C) ageing.
Welding: GTAW Welding process is the most extensively used metal joining techniques in aerospace hardware manufacturing like rocket motor casing, gas bottles, shells etc. Welding is the process of joining two or more pieces of materials with the application of heat and (or) pressure, with or without the addition of filler material. The welding region in general contains distinct metallurgical features like fine to coarse cast structure and partially melted zone. While the weldment where the liquid pool forms, experience all the associated reaction of solidification in casting process, the Heat Affected Zone (HAZ) is the region where the temperature is not enough to cause melting, it is high enough to cause metallurgical transformations resulting in complex structures. Heat input control is therefore very important to get good weld and minimum HAZ. The heat input mainly depends on the welding parameters viz current, voltage, travel speed of welding. All these parameters when optimized for the particular weld configuration, a sound weld with good mechanical properties will result. To establish the properties of weldment, prior to fabrication of aerospace hardware it is a mandatory Procedure Qualification Record (PQR). The Welder’s Performance Qualification is also a mandatory procedure prior to the actual hardware welding.
80% of the welding applications in aerospace industry is GTAW (Gas Tungsten Arc Welding). This process can be adopted to many material and can be carried out both manually and automatic. The overall heat input control, clear visibility of arc, cleanliness, protection of weld pool from atmosphere are the major reasons for compulsory this technique. GTAW is an arc welding process, where inert gas (He/Ar) is used to protect the weld zone from atmospheric oxidation. This is based on the principle of arc creation between work piece and electrode (Tungsten), filler material is supplied at the joint, which gets melted along with base metal and join the two pieces. Mode of power source is selected by considering the advantage of process to control the heat input during welding with all there inherent benefits of quality GTAW it is possible to achieve a sound welds with a weld efficiency of greater than 90%.
Welding Procedure Qualification: Welding Quality starts with qualification of Welding procedure. The Welding Procedure Specification (WPS) is an authorized document that provides guidelines for the welders to produce sound quality welds. A WPS is developed for each alloy and each welding type used for weld configuration. A WPS is supported by Procedure Qualification record (PQR). PQR is the documented values used during the actual welding test and all the inspection and test results obtained from the actual test samples. Qualification testing of a welding procedure normally requires documentation to show all the variables used during the welding test and the documented inspection and test results. The features of weld configuration viz bevel angle, mismatch, root gap, root land etc are essentially controlled to obtain a sound weld joint for the particular WPS. It is also mandatory to follow a welding sequence for each joint to minimize weld distortion. All the welding parameters, weld fit-up dimensions are to be recorded in the standard formats for each weld joint.
The variables required to be documented are typically such items as: welding process used, size, type and classification of filler alloy, type and thickness of base material welded, type and polarity of welding current, amps and volts recorded, travel speed during welding, welding position, type and dimensions of joint design, preheating temperature, interpass temperature, post weld heat treatment details, and others. In addition to the recording of all the welding variables used during the test, in order to qualify a welding procedure, details of the inspection and test results must also be recorded. These records must show that the inspection and testing has proven that the weld samples have met or exceeded the specified standard requirement. The typical types of inspection and testing for each sample for Welding Procedure Qualification include involves visual inspection, followed by two transverse tensile tests, two root bend test and two face bend tests.
Welding Inspection: Each weld joint of the pressure vessel is inspected for size, weld length, dimensional accuracy, amount of distortion, and presence of discontinuities in surface and inside the weld joint. The surface open discontinuities in the weld can be inspected by visual, die penetrant and magnetic particle testing. These test are economical. To find the internal discontinuities viz porosities, incomplete fusion, undercuts, tungsten inclusion, cracks etc use non-destructive testing techniques like Radiography and Ultrasonic tests. The weld joints are inspected by all the inspection techniques considering the limitations and advantages. In Radiography testing it is possible to detect majority of discontinuities in butt weld joints upto 10mm thickness with 2% sensitivity. The identified discontinuities of the order of greater than 1/10 th the thickness of butt weld joint are considered to be defects and such defects are to be eliminated by repairing the joint. While the codes and standard may permit limited amount of discontinuities, but discontinuities viz cracks, lack of fusion, undercuts, overlap, improper contours irrespective of size are never permitted and should be repaired. All the weld joints shall be inspected 100% by Die Penetrant, Radiography Testing and Ultrasonic testing after welding, after ageing / Heat Treatment and finally after proof load / Pressure testing in maraging steel pressure vessels for aerospace applications.
Statistical Process Control (SPC): Statistical process control is a problem solving technique using analytical techniques to help identify sources of problems and assist solving the problems. SPC is used to verify whether the process is in statistical control or otherwise. If the process is in statistical control, then it implies that the process variation is random. If it is out of control then it implies that process has non-random variation. SPC is a tool for technical communication. The success of SPC depends on understanding and measurement of process and then changing process when necessary. The advantages of SPC include continual improvement, reduction in process complexity, maintaining quality and productivity.
Control Charts: Each process has inherent variation. The variation may be due to common cause or a special cause. Common cause variations are natural variations such as environmental conditions, raw materials etc. These are not controlled by shop floor personnel. Special cause variations are unusual variations such as significant changes in dimensions, mechanical properties etc. When special causes are identified then can be adjusted or removed by shop floor personnel. If the shop floor personnel try to adjust common cause variation, then it may result into more variation than less. Control charts will help identifying whether the process variation is due to common cause or special cause.
The control charts are used to monitor variables or characteristics of the process. Sample selection is an important point to consider for use of control charts. Samples are normally those produced successively by the same process. The controls charts are graphs used to process changes over time. A control chart always has a central line for the average, an upper line for the upper control limit and a lower line for the lower control limit. These lines are determined from historical data. By comparing current data to these lines, conclusions can be made on consistency of process variation. The control chart used in this publication is Individual control charts. Welding is an application which consists of single observation. As an example, in this study the single observation is percentage weld repair length of a particular weld joint. For this kind of application Individual control charts are used for monitoring the welding process. Individual moving range charts are useful
When controlling ongoing processes by finding and correcting problems as they occur.
When predicting the expected range of outcomes from a process.
When determining whether a process is stable (in statistical control).
When analyzing patterns of process variation from special causes (non-routine events) or common causes (built into the process).
When determining whether quality improvement project should aim to prevent specific problems or to make fundamental changes to the process
Data collection and control limits: Individual control chart will need sufficient data to detect variability of the entire system. The more subgroups used in control limit calculations, the more reliable will be the analysis. Typically, twenty to twenty-five subgroups will be used in control limit calculations. The individual control chart use the moving range of two successive welds to estimate process variability.
The moving range is given by MRi = |xi – xi-1|
For m groups of size 1 (1 weld in each sub group) m-1 moving rages are defined as MR2 = |x2 – x1|, MR3 = |x3 – x2|,……,MRm
= |xm – xm-1|
The average moving range is calculated as
[image:3.595.305.561.187.377.2]´ = ∑
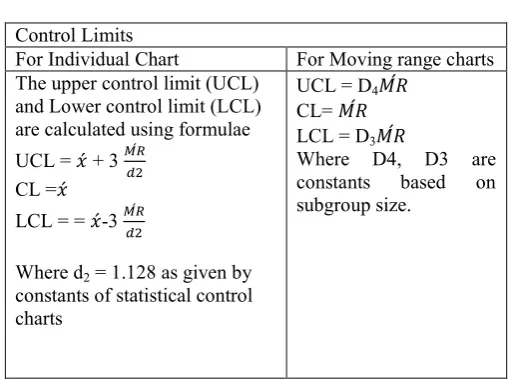
Table 1. Calculation of Control limits
Control Limits
For Individual Chart For Moving range charts The upper control limit (UCL)
and Lower control limit (LCL) are calculated using formulae UCL = ´ + 3 ´
CL =´
LCL = = ´-3 ´
Where d2 = 1.128 as given by
constants of statistical control charts
UCL = D4 ´
CL= ´ LCL = D3 ´
Where D4, D3 are constants based on subgroup size.
Using the above the X bar R charts are drawn and control limits are established. The out of control signals are
A single point outside the control limits.
Two out of three successive points are on the same side of the centerline and farther than 2/3control limit. Four out of five successive points are on the same side
of the centerline and farther than 1/3control limit. Eight successive points on either side of the centerline
and within 1/3control limit.
Fifteen points in a row on either side of the centerline and farther than 1/3control limit.
A run of nine in a row are on the same side of the centreline
Six points in a row all increasing or decreasing Four points in a row alternating up and down
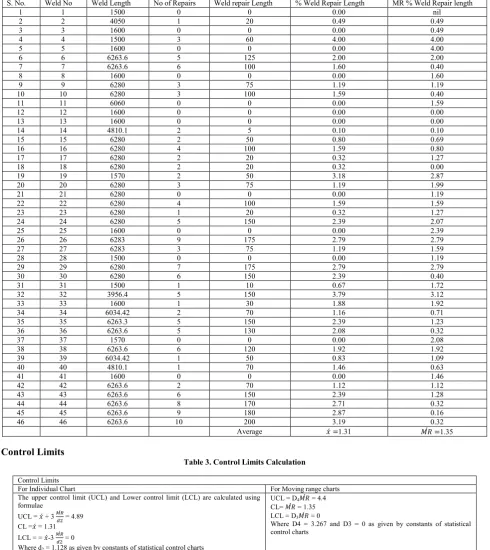
DATA: This publication use the data of weld repair length of joints taken from three aerospace pressure vessels. A total of 46 joints from three vessels made of maraging steel 250 grade that were welded sequentially over a period of time were considered for this publication. The weld joints have varied in length from 1000mm to 6000mm.DP, UT and Radiography testing was carried out on all the weld joints the discontinuities were identified and the defects were repaired. The repair length was measured for each joint. The data of weld repair length of each weld joint was taken and analyzed using individual control charts. In this publication a total of 46 subgroups of each weld has been taken for analysis and to establish control limits. The data of weld repair length in table 2.0.
Data:
Table 2. Data of weld repair length
S. No. Weld No Weld Length No of Repairs Weld repair Length % Weld Repair Length MR % Weld Repair length
1 1 1500 0 0 0.00 nil
2 2 4050 1 20 0.49 0.49
3 3 1600 0 0 0.00 0.49
4 4 1500 3 60 4.00 4.00
5 5 1600 0 0 0.00 4.00
6 6 6263.6 5 125 2.00 2.00
7 7 6263.6 6 100 1.60 0.40
8 8 1600 0 0 0.00 1.60
9 9 6280 3 75 1.19 1.19
10 10 6280 3 100 1.59 0.40
11 11 6060 0 0 0.00 1.59
12 12 1600 0 0 0.00 0.00
13 13 1600 0 0 0.00 0.00
14 14 4810.1 2 5 0.10 0.10
15 15 6280 2 50 0.80 0.69
16 16 6280 4 100 1.59 0.80
17 17 6280 2 20 0.32 1.27
18 18 6280 2 20 0.32 0.00
19 19 1570 2 50 3.18 2.87
20 20 6280 3 75 1.19 1.99
21 21 6280 0 0 0.00 1.19
22 22 6280 4 100 1.59 1.59
23 23 6280 1 20 0.32 1.27
24 24 6280 5 150 2.39 2.07
25 25 1600 0 0 0.00 2.39
26 26 6283 9 175 2.79 2.79
27 27 6283 3 75 1.19 1.59
28 28 1500 0 0 0.00 1.19
29 29 6280 7 175 2.79 2.79
30 30 6280 6 150 2.39 0.40
31 31 1500 1 10 0.67 1.72
32 32 3956.4 5 150 3.79 3.12
33 33 1600 1 30 1.88 1.92
34 34 6034.42 2 70 1.16 0.71
35 35 6263.3 5 150 2.39 1.23
36 36 6263.6 5 130 2.08 0.32
37 37 1570 0 0 0.00 2.08
38 38 6263.6 6 120 1.92 1.92
39 39 6034.42 1 50 0.83 1.09
40 40 4810.1 1 70 1.46 0.63
41 41 1600 0 0 0.00 1.46
42 42 6263.6 2 70 1.12 1.12
43 43 6263.6 6 150 2.39 1.28
44 44 6263.6 8 170 2.71 0.32
45 45 6263.6 9 180 2.87 0.16
46 46 6263.6 10 200 3.19 0.32
Average ´ =1.31 ´ =1.35
[image:4.595.46.537.96.647.2]Control Limits
Table 3. Control Limits Calculation
Control Limits
For Individual Chart For Moving range charts
The upper control limit (UCL) and Lower control limit (LCL) are calculated using formulae
UCL = ´ + 3 ´ = 4.89
CL =´ = 1.31
LCL = = ´-3 ´ = 0
Where d2 = 1.128 as given by constants of statistical control charts
UCL = D4 ´ = 4.4
CL= ´ = 1.35
LCL = D3 ´ = 0
Where D4 = 3.267 and D3 = 0 as given by constants of statistical control charts
Individual Chart
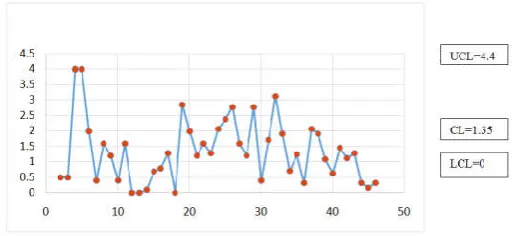
[image:4.595.123.526.571.794.2]From moving range charts, it is evident that the process is in statistical control and all the moving ranges are within control limits. Hence it can be concluded that the control limits of individual charts are reliable. The percentage weld repair length is well with-in the upper control limit of 4.89%. This also helps to define the criteria of acceptable percentage weld repair length. With this control the fabrication facility will be able to produce a sound quality weld with less than 5% weld repair length. The aerospace pressure vessel manufacturer can define a maximum permissible limit of 5% for weld repair length. Excess weld repair length above this criteria can be analyzed for necessary corrective actions.
Conclusion
Statistical process control tools offer excellent helping hand in predicting the behavior of Welding process. These processes can be continuously evaluated using individual charts to monitor weld repair length. Weld repair length have potential impact on service life of hardware and also adds cost of fabrication. The use of control chart allows the operators to detect and correct these issues before they cause deeper problems in processes and products.
This greatly reduces repair, rework and additional product expenditures. Continuous use of control charts provide useful information regarding the actions to be taken for quality improvement.
REFERENCES
Handbook of The certified Quality Engineer by American Society for Quality.
Sequential Control Charts Methodology by James M Lucas, Institute of statistics, texa University.
Evaluation of maraging steel for application yo space launch vehicles W V MIxion, F T Wimmer and Z P Saperstein. ASM handbook Vol.17 Non Destructive evaluation and quality
control.
Mohan MVN. et al., 2018. "Statistical Process Control and Analysis of Welding and Heat Treatment Process Established for Aerospace Structures", International Welding Symposium (IWS), November 27-29, 2018, Mumbai, India.
[image:5.595.165.424.83.201.2]Moving range Chart
Fig 2. Moving range Chart