3136
EVALUATING THE ACCURACY OF USING CROSS
DATASETS TO PREDICT NEW LOCAL HEART DISEASES
CASES
1AHMAD MOUSA ALTAMIMI, 2MOHAMMAD AZZEH
Applied Science Private University, Department of Computer Science, Jordan
Applied Science Private University, Department of Software Engineering, Jordan
E-mail: [email protected], [email protected]
ABSTRACT
Extracting hidden knowledge from healthcare datasets are quite important for the health sector. It is a common practice that health organizations often focus on their local data to build prediction model that can be used to predict and identify some popular diseases, heart diseases are no exception. The main challenge that faces health organizations around the world is how to generalize the prediction model on different cases collected from different places. It is well recognized that the health prediction models are built over data collected from a specific community, but there is a lack of confirmation if this model can be applied for data collected from different communities. In this paper we turn our attention to heart diseases problem. In this work, we empirically examine the prediction accuracy of different classification algorithms when different medical datasets are used for learning and testing. Specifically, three studies were developed to determine how successfully we can generalize a model that is built based on a dataset obtained from a health organization and then used to predict new cases from different one. In the first study we developed and tested classification models over each individual dataset, whereas in the second study we developed classification models over a dataset and tested using another dataset. In the last study, we made a merge between the employed datasets, then a classification model is built and tested over the merged dataset. Results from these studies confirm that using a classification model built from different dataset and used to predicted cases from another dataset is generally reasonable and accurate. They also confirm that merging heart disease datasets that have the same structure are useful for identifying potential cases.
Keywords—Data Mining Classifiers, Prediction Model, Accuracy, Cross Datasets, E-Health
1.INTRODUCTION
In today’s information age, there is a need for a powerful analytical solution for the extraction of the useful information from the very massive amount of eHealth data collected and stored in a medical organization’s databases or repositories. In this regard, data mining models have been extensively used in healthcare research (i.e., using data mining classifiers). It is well recognized that the health prediction or classification models are built over data collected from a specific community, but there is a lack of confirmation if that model can be applied for data collected from different communities. Here, the organization’s historical health data are classified and analyzed to explore valuable knowledge. Based on that, the literature
shows that developing and testing classification models have been considered carefully over a single medical dataset. However, the issue of generating classification models using cross datasets has not been examined thoroughly. Therefore, in this work three studies have been designed to investigate the efficiency of using local and cross datasets for developing and testing classification models to predict new heart disease cases.
3137 study we made a merge between two employed datasets, then a classification model is developed and tested over the merged dataset. The three studies were conducted using four common algorithms that presented good accuracy for heart diseases datasets. These algorithms are: Naïve Bayes, Decision Tree, Discriminant and Random Forest. To ensure that our studies undergo the same experiment condition. The leave-one out cross validation mechanism was used where the learning and testing process is repeatedly executed until all cases act as testing observation. In each run the classification model is developed over n-1 cases while one case is used for testing, and consequentially the accuracy measures is recorded in each run. Finally the average accuracy is calculated.
In order to make sure that the used datasets are relatively similar with respect to datasets characteristics. Two datasets have been used, the first dataset is called Cleveland, which was collected from Cleveland Clinic Foundation [1]. This dataset contains 303 records and 14 features. Some records contains missing values, therefore we treated these missing values using k-NN algorithm. Specifically k-NN method has been used where a case is imputed using values from the k most similar cases. In other words, to classify an unknown instance, the k-NN classifier calculates the distances between the point and points in the training data set using the Euclidean distance function [2] and then replaces it with the missing value. This has accomplished significant contribution from several medical domain researchers. The second dataset is called Statlog which it is described by 270 records and 76 features [3]. For both datasets we selected the common input features resulting in 14 features.
It is important to mention here that such studies enable us to understand the behavior of classification algorithms when two different datasets structure are employed in learning and testing. Results of first study showed that all classification models work well over both datasets, but surprisingly decision tree is the most superior one in terms of all accuracy measures. This may be related to the fact that the output variable is initially classified based on human rules that helped decision tree to build very close model. On the other hand, results of second and third studies showed that learning and testing from different datasets is relatively similar to using local dataset. The
accuracy measure for all classification model are good, among them the decision tree and Random forest are the most superior ones as confirmed by their ROC as demonstrated in Section 4. This gives us indication to the applicability of using different data for predicting new cases.
The remainder of this paper is structured as follows. Section II presented the reviewing of some related works to the proposed approach. The research methodology our research is introduced in Section III. While the results and discussions are presented in Section IV. Section V offers the final conclusions and future works.
2.RELATEDWORK
While many studies have been conducted for predicting heart diseases using single dataset, the issue of using cross datasets to generate prediction models has not been scrutinized closely and thoroughly. One can consider for example the works of [4]-[7] that applied popular data mining classification algorithms to develop a heart diseases prediction models such as: Support Vector Machine, Decision Trees, Naïve Bayes, and Neural Networks. For instance, Support Vector Machine, Artificial Neural Network, and Decision Tree have been utilized in [7] with 502 cases. Results of this study prove that the Support Vector Machine was the best prediction model followed by Artificial Neural Networks. In contrast, authors of [5] showed in their work that Naïve Bayes technique outperformed the other used algorithms (i.e., Decision Tree, K-NN and Neural Network). Neural Network was recognized as the best prediction model in [8] when Decision Trees, Naïve Bayes, and Neural Network were used with 15 popular attributes as risk factors listed in the medical literature. On the other hand, results of [4] proved when binding the Hybrid Intelligent technique to Neural Networks the prediction accuracy will be proved.
3138 their models.
To the best of our knowledge there is no study attempted to examine the usefulness of classification algorithms over local and cross heart disease datasets. Most of the previous studies used local dataset to build and test classification models. However, while this approach is true, no one can guess what happen when the built model is used for heart diseases cases collected from different communities. Therefore we believe that the heart disease classification model should be evaluated under different circumstances. The conducted studies have great advantages: Firstly, it enable us to understand the behavior of classification algorithms when two different datasets structure are employed in learning and testing. Secondly, it can also be used to determine how successfully we can generalize a model that is built based on a dataset and used to predict a new cases in different organizations. Ultimately, it is important to mention that our work is closed related to Cross validation technique. However, while cross validation is a testing method used for assessing how the results of an analysis process could be generalized to another data set [13]. This method is mainly used when only one dataset is available for training and testing and we want to estimate the quality of predictive model in practice [13]-[16]. Historically, cross validation was coined by Larson in the early 30s when he noticed that training and evaluating an algorithm using the same data gives an overoptimistic result [17]. This is the principal reason, but not the only reason as a data allocation dilemma is raised when finite or limited amount of data would be available in practice for developing and testing an algorithm. Therefore, cross validation was adapted to fix these issues by testing the algorithm using new dataset. In this context, results of several studies that were used cross validation [18], [19] showed a better estimate for an algorithm’s performance and give an honest assessment for its reliability
3.RESEARCHMETHODOLOGY
This study attempts to investigate and compare between using local and cross datasets for building and testing classification models over heart disease datasets. The concept of local dataset means that the classification model will be developed and tested over the same dataset, while the cross dataset means that the model is generated over a dataset and tested
over a different dataset. To accomplish that we use four common classification algorithms that presented previously good accuracy for heart diseases datasets. These classification algorithms are: Naïve Bayes, Decision Tree, Discriminant and Random Forest. To perform the comparison we conducted three main studies, in the first study we developed and tested classification models over local dataset only. In the second study we developed classification models over a dataset and tested using another dataset. In the third study, we developed classification models over a merged version of both datasets. This variety enables us to understand the behaviors of classification algorithm when two different datasets structure are employed in learning and testing. One important issue here is to ensure that both studies undergo the same experiment condition. In the first and third study we used leave-one out cross validation mechanism where the learning and testing process is repeatedly executed until all observations act as testing observation. In each run the classification model is built over n-1 observation while one observation is used for testing, and consequentially the accuracy measures is recorded. The average accuracy measure is then calculated. On the other hand, in the second study the process of validation is executed twice where one dataset is used for training and another dataset for testing. Ultimately, we combined both datasets together to study the effect of heterogeneous datasets in training and testing of classification models.
3.1 Datasets Description
3139 function Hu and then replaces it with the missing value.
This has accomplished significant contribution from several medical domain researchers. The second dataset is called Statlog which it is described by 270 records and 76 features. For both datasets we selected the common input features resulting in 14 features with predefined values [20]. Features themselves are: Age, Sex, Chest pain, Blood pressure, Serum cholesterol, Blood sugar, Resting electrocardiographic, Maximum heart rate, ST depression, Slope for peak exercise, Major vessels, Heart rate, and a value indicates a heart disease or absence of all of them. Detailed descriptions for these measures can be found in [20].
3.2 Performance Measures
It is a key part of any validation process is to evaluate the classification models using the most common performance measures. In this paper, we used a group of performance measures that are widely used in literature. These measures are: Recall, Precision, Accuracy, F-measure, specificity, positive predicted rate and negative predicted rate. Due to the space limitation, next we give a brief description for each measure along with its equation.
1) Recall is used to measure how well a binary classification test correctly identifies a condition probability of correctly labeling members of the target class.
2) Precision is used to measure the probability that a positive prediction is correct.
3) Accuracy is used to measure the performance of classification.
4) Specificity is used to measure how well a binary classification test correctly identifies the negative cases.
5) F-measure is used to measure the probability that a positive prediction is correct.
4.RESULTS AND DISCUSSIONS
As mentioned in the research methodology section, we designed two studies to investigate the efficiency of using cross datasets for predicting and classifying new heart disease cases. A common issue that is risen by health organization is how successfully we can generalize the model that is built based on a dataset collected in a health organization and then used to predict a new cases from different organizations. It is possible
[image:4.612.315.529.210.393.2]theoretically, but a validation is needed to confirm that practically. That is, the first study takes the responsibility to determine the efficiency of classification models by using two local dataset (Cleveland and Statlog) for training and testing. In other words, we developed and tested the classification model over the same dataset using Leave one out cross validation. The results on both datasets are presented in Tables 1 and 2.
Table 1: Performance measures using Cleveland dataset
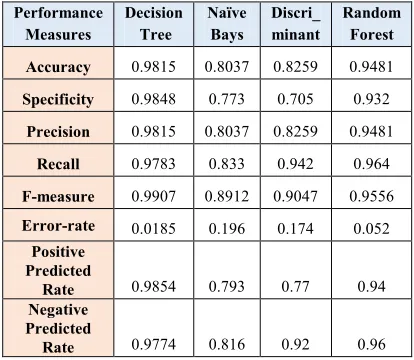
Table 2: Performance measures using Statlog dataset
Performance Measures
Decision Tree
Naïve Bays
Discri_ minant
Random Forest
Accuracy 0.9815 0.8037 0.8259 0.9481
Specificity 0.9848 0.773 0.705 0.932
Precision 0.9815 0.8037 0.8259 0.9481
Recall 0.9783 0.833 0.942 0.964
F-measure 0.9907 0.8912 0.9047 0.9556
Error-rate 0.0185 0.196 0.174 0.052
Positive Predicted
Rate 0.9854 0.793 0.77 0.94
Negative Predicted
Rate 0.9774 0.816 0.92 0.96
Generally, we can observe that all classification models work well over both datasets, but surprisingly decision tree is the most superior one in terms of all accuracy measures. This may be related to the fact that the output variable is initially classified based on human rules that helped decision tree to build very close model. In addition, the ROC [21] of all classifiers over Cleveland dataset are
Performance Measures
Decision Tree
Naïve Bays
Discri_ minant
Random Forest
Accuracy 0.9901 0.7888 0.8350 0.9340
Specificity 0.9898 0.904 0.9797 0.9797
Precision 0.9901 0.7888 0.8350 0.9340
Recall 1.0000 0.7453 0.793 0.962
F-measure 0.9950 0.8819 0.9101 0.9659
Error-rate 0.0099 0.2112 0.165 0.083
Positive Predicted
Rate
0.9815 0.8061 0.9545 0.96
Negative Predicted
Rate
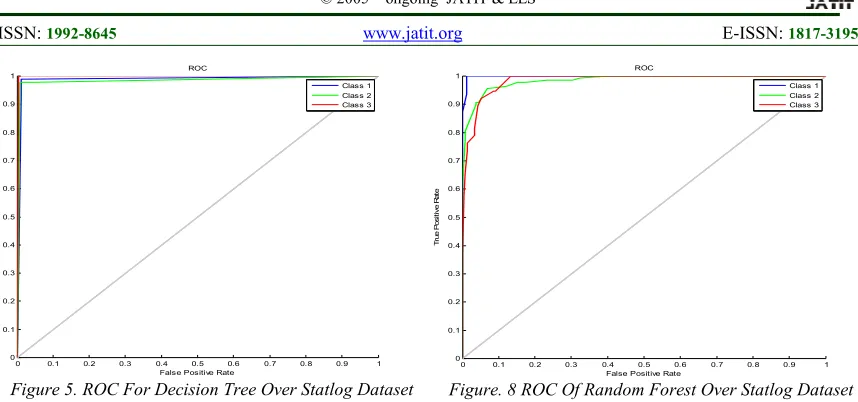
[image:4.612.314.521.441.621.2]3140 demonstrated in Figures 1-4, while the ROC of all classifiers over Statlog dataset are demonstrated in Figures 5-8. One must note from these figures that the ROC are good and depict accurate results for all classes except for Naïve Bayes over Statlog (surrounding by dashed red line), which gives worst performance.
In contrast, the second study uses one dataset for training and another dataset for testing. In the first experiment, the dataset Cleveland is used for training and Statlog is used for testing. The results are presented in Table 3. From the results we can observe that learning and testing from different datasets is relatively similar to using local dataset. The accuracy measure for all classification model are good, among them decision tree and Random forest are the most superior ones as confirmed by ROC in Figures 9-12. This gives us indication to the applicability of using different data for predicting new cases.
Table 3: Training Dataset=Cleveland, Testing Dataset=DS2
Performance Measures
Decision Tree
Naïve Bays
Discrim_ inant
Random Forest
Accuracy 0.9926 0.826 0.863 0.9889
Specificity 1 0.8106 0.7652 0.977
Precision 0.9926 0.826 0.863 0.9889
Recall 0.9855 0.8 0.9565 1
F-measure 0.9963 0.905 0.9264 0.994
Error-rate 0.0074 0.1741 0.137 0.01
Positive Predicted
Rate
1 0.823 0.81 0.98
Negative Predicted
Rate
0.9851 0.83 0.941 1
0 0.1 0.2 0.3 0.4 0.5 0.6 0.7 0.8 0.9 1
0 0.1 0.2 0.3 0.4 0.5 0.6 0.7 0.8 0.9 1
False Positive Rate
T
ru
e
P
o
s
it
iv
e
R
a
te
ROC
Class 1 Class 2 Class 3
Figure 1. ROC For Decision Tree Over Cleveland
Dataset
0 0.1 0.2 0.3 0.4 0.5 0.6 0.7 0.8 0.9 1
0 0.1 0.2 0.3 0.4 0.5 0.6 0.7 0.8 0.9 1
False Positive Rate
T
ru
e
P
o
s
it
iv
e
R
a
te
ROC
Class 1 Class 2 Class 3
Figure 2. ROC For Naïve Bayes Over Cleveland Dataset
0 0.1 0.2 0.3 0.4 0.5 0.6 0.7 0.8 0.9 1
0 0.1 0.2 0.3 0.4 0.5 0.6 0.7 0.8 0.9 1
False Positive Rate
T
ru
e
P
o
s
it
iv
e
R
a
te
ROC
Class 1 Class 2 Class 3
Figure 3. ROC For Discriminant Over Cleveland Dataset
0 0.1 0.2 0.3 0.4 0.5 0.6 0.7 0.8 0.9 1
0 0.1 0.2 0.3 0.4 0.5 0.6 0.7 0.8 0.9 1
False Positive Rate
T
ru
e
P
o
s
it
iv
e
R
a
te
ROC
Class 1 Class 2 Class 3
3141
0 0.1 0.2 0.3 0.4 0.5 0.6 0.7 0.8 0.9 1
0 0.1 0.2 0.3 0.4 0.5 0.6 0.7 0.8 0.9 1
False Positive Rate
T
ru
e
P
o
s
it
iv
e
R
a
te
ROC
Class 1 Class 2 Class 3
Figure 5. ROC For Decision Tree Over Statlog Dataset
0 0.1 0.2 0.3 0.4 0.5 0.6 0.7 0.8 0.9 1
0 0.1 0.2 0.3 0.4 0.5 0.6 0.7 0.8 0.9 1
False Positive Rate
T
ru
e
P
o
s
it
iv
e
R
a
te
ROC
[image:6.612.92.521.63.264.2]Class 1 Class 2 Class 3
Figure 6. ROC For Naïve Bayes Over Statlog Dataset
0 0.1 0.2 0.3 0.4 0.5 0.6 0.7 0.8 0.9 1
0 0.1 0.2 0.3 0.4 0.5 0.6 0.7 0.8 0.9 1
False Positive Rate
T
ru
e
P
o
s
it
iv
e
R
a
te
ROC
Class 1 Class 2 Class 3
Figure 7. ROC For Discriminant Over Statlog Dataset
0 0.1 0.2 0.3 0.4 0.5 0.6 0.7 0.8 0.9 1
0 0.1 0.2 0.3 0.4 0.5 0.6 0.7 0.8 0.9 1
False Positive Rate
T
ru
e
P
o
s
it
iv
e
R
a
te
ROC
Class 1 Class 2 Class 3
Figure. 8 ROC Of Random Forest Over Statlog Dataset
[image:6.612.307.515.409.588.2]In the second experiment we used Statlog as training dataset and Cleveland as testing dataset. The results are shown in Table 4. Similar to previous experiments, all classification models work well with good accuracy, both decision trees and Random Forest are the top classification models as confirmed by ROC in Figures 13-14 and 16. Only the ROC of Naïve Byes on Statlog dataset produce the worst performance.
Table 4: Training Dataset=Statlog, Testing Dataset=Cleveland
Performance Measures
Decision Tree
Naïve Bays
Discri_ minant
Random Forest
Accuracy 0.9934 0.835 0.852 0.997
Specificity 0.9898 0.939 0.97 1
Precision 0.9934 0.835 0.852 0.997
Recall 1 0.774 0.84 0.991
F-measure 0.9967 0.91 0.92 0.998
Error-rate 0.0066 0.165 0.149 0.0033
Positive Predicted
Rate
0.9815 0.872 0.94 1
Negative Predicted
Rate
1 0.8852 0.92 0.995
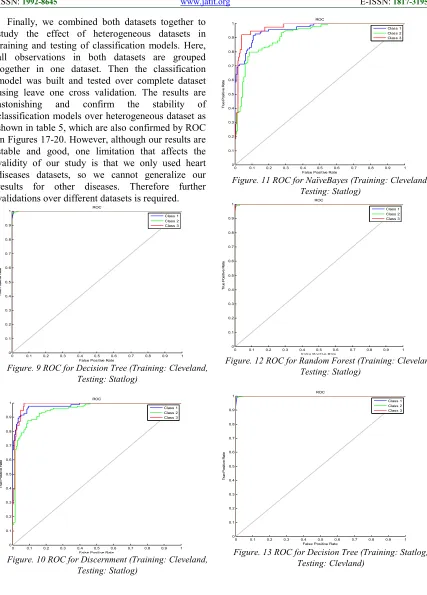
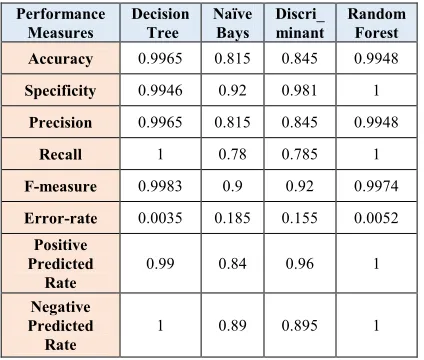
3142 Finally, we combined both datasets together to study the effect of heterogeneous datasets in training and testing of classification models. Here, all observations in both datasets are grouped together in one dataset. Then the classification model was built and tested over complete dataset using leave one cross validation. The results are astonishing and confirm the stability of classification models over heterogeneous dataset as shown in table 5, which are also confirmed by ROC in Figures 17-20. However, although our results are stable and good, one limitation that affects the validity of our study is that we only used heart diseases datasets, so we cannot generalize our results for other diseases. Therefore further validations over different datasets is required.
0 0.1 0.2 0.3 0.4 0.5 0.6 0.7 0.8 0.9 1
0 0.1 0.2 0.3 0.4 0.5 0.6 0.7 0.8 0.9 1
False Positive Rate
T
ru
e
P
o
s
it
iv
e
R
a
te
ROC
Class 1 Class 2 Class 3
Figure. 9 ROC for Decision Tree (Training: Cleveland, Testing: Statlog)
0 0.1 0.2 0.3 0.4 0.5 0.6 0.7 0.8 0.9 1
0 0.1 0.2 0.3 0.4 0.5 0.6 0.7 0.8 0.9 1
False Positive Rate
T
ru
e
P
o
s
it
iv
e
R
a
te
ROC
Class 1 Class 2 Class 3
Figure. 10 ROC for Discernment (Training: Cleveland, Testing: Statlog)
0 0.1 0.2 0.3 0.4 0.5 0.6 0.7 0.8 0.9 1
0 0.1 0.2 0.3 0.4 0.5 0.6 0.7 0.8 0.9 1
False Positive Rate
T
ru
e
P
o
s
it
iv
e
R
a
te
ROC
Class 1 Class 2 Class 3
Figure. 11 ROC for NaïveBayes (Training: Cleveland, Testing: Statlog)
0 0.1 0.2 0.3 0.4 0.5 0.6 0.7 0.8 0.9 1
0 0.1 0.2 0.3 0.4 0.5 0.6 0.7 0.8 0.9 1
False Positive Rate
T
ru
e
P
o
s
it
iv
e
R
a
te
ROC
[image:7.612.93.520.78.673.2]Class 1 Class 2 Class 3
Figure. 12 ROC for Random Forest (Training: Cleveland, Testing: Statlog)
0 0.1 0.2 0.3 0.4 0.5 0.6 0.7 0.8 0.9 1
0 0.1 0.2 0.3 0.4 0.5 0.6 0.7 0.8 0.9 1
False Positive Rate
T
ru
e
P
o
s
it
iv
e
R
a
te
ROC
Clas s 1 Clas s 2 Clas s 3
3143
0 0.1 0.2 0.3 0.4 0.5 0.6 0.7 0.8 0.9 1
0 0.1 0.2 0.3 0.4 0.5 0.6 0.7 0.8 0.9 1
False Positive Rate
T
ru
e
P
o
s
it
iv
e
R
a
te
ROC
Class 1 Class 2 Class 3
Figure. 14 ROC for Discernment (Training: Statlog, Testing: Clevland )
0 0.1 0.2 0.3 0.4 0.5 0.6 0.7 0.8 0.9 1
0 0.1 0.2 0.3 0.4 0.5 0.6 0.7 0.8 0.9 1
False Positive Rate
T
ru
e
P
o
s
it
iv
e
R
a
te
ROC
Class 1 Class 2 Class 3
Figure. 15 ROC for NaïveBayes (Training: Statlog, Testing: Clevland)
0 0.1 0.2 0.3 0.4 0.5 0.6 0.7 0.8 0.9 1
0 0.1 0.2 0.3 0.4 0.5 0.6 0.7 0.8 0.9 1
False Positive Rate
T
ru
e
P
o
s
it
iv
e
R
a
te
ROC
Class 1 Class 2 Class 3
Figure. 16 ROC for Random Forest (Training:Statlog, Testing:Clevland)
0 0.1 0.2 0.3 0.4 0.5 0.6 0.7 0.8 0.9 1
0 0.1 0.2 0.3 0.4 0.5 0.6 0.7 0.8 0.9 1
False Positive Rate
T
ru
e
P
o
s
it
iv
e
R
a
te
ROC
Class 1 Class 2 Class 3
Figure. 17 ROC for Decision Tree ( All datasets)
0 0.1 0.2 0.3 0.4 0.5 0.6 0.7 0.8 0.9 1
0 0.1 0.2 0.3 0.4 0.5 0.6 0.7 0.8 0.9 1
False Positive Rate
T
ru
e
P
o
s
it
iv
e
R
a
te
ROC
Class 1 Class 2 Class 3
Figure. 18 ROC for Discernment Classifier ( All datasets)
0 0.1 0.2 0.3 0.4 0.5 0.6 0.7 0.8 0.9 1
0 0.1 0.2 0.3 0.4 0.5 0.6 0.7 0.8 0.9 1
Fals e Positive Rate
T
ru
e
P
o
s
it
iv
e
R
a
te
ROC
Class 1 Class 2 Class 3
3144
0 0.1 0.2 0.3 0.4 0.5 0.6 0.7 0.8 0.9 1
0 0.1 0.2 0.3 0.4 0.5 0.6 0.7 0.8 0.9 1
Fals e Positive Rate
T
ru
e
P
o
s
it
iv
e
R
a
te
ROC
Class 1 Class 2 Class 3
[image:9.612.84.296.289.469.2]Figure. 20 ROC for Random Forest ( All datasets)
Table 5: All Dataset
5.CONCLUSIONANDFUTUREWORK
In this research, we have investigated the prediction accuracy of different classification algorithms over local and cross health datasets. To do this, three studies have been conducted, the first one was developed to determine the prediction accuracy when the same dataset is used for developing and testing the classification model. Results showed that all classification models work well and the decision tree is the most superior one in terms of all accuracy measures. However, the second study used one dataset for training and another one for testing. Specifically, in the first round Cleveland dataset is used for training and Statlog for testing, and in the second round the two datasets were swapped. From the results of these experiments we observed that learning and testing from different datasets is relatively similar to using local dataset.
The main achievements obtained by the conducted studies:
1.The classification models work well over heart disease datasets as shows in ROCs.
2.The Feature extraction and rule identification helped the decision tree to produce more accurate results.
3.Heterogeneous and merged heart disease dataset can also work well with classification models if a special care is given for feature selection.
As a future work, we will use the research described here as a foundation for developing effective prediction systems. In addition, we are planning to consider other datasets (i.e., breast cancer, blood pressure, and alike) to generalize our results for other diseases. Therefore, further validations over different diseases datasets are desperately required. That being said, this is a large topic and there are numerous opportunities for additional research that would significantly extend the functionality of the current research.
ACKNOWLEDGMENT
The authors are grateful to the Applied Science Private University, Amman-Jordan, for the full financial support granted to cover the publication fee of this research article.
REFERENCES
[1] Cleveland Clinic Foundation, "Heart Disease Data Set ", Available at: http://archive.ics.uci.edu/ml/datasets/Heart+Dis ease.
[2] Hu, L.-Y., et al., The distance function effect on k-nearest neighbor classification for medical datasets. SpringerPlus, 2016. 5(1): p. 1304. [3] Statlog, "Heart Disease Data Set ", Available
at:
https://archive.ics.uci.edu/ml/datasets/Statlog+ %28Heart%29
[4] R. Chitra and V. Seenivasagam, “Review of Heart Disease Prediction System Using Data Mining and Hybrid Intelligent Techniques,” Journal on Soft Computing (ICTACT), vol. 3, no. 4, pp. 605–609, 2013.
[5] T. J. Peter and K. Somasundaram, “An Empirical Study on Prediction of Heart Disease Using Classification Data Mining Techniques,” 2012.
Performance Measures
Decision Tree
Naïve Bays
Discri_ minant
Random Forest
Accuracy 0.9965 0.815 0.845 0.9948
Specificity 0.9946 0.92 0.981 1
Precision 0.9965 0.815 0.845 0.9948
Recall 1 0.78 0.785 1
F-measure 0.9983 0.9 0.92 0.9974
Error-rate 0.0035 0.185 0.155 0.0052
Positive Predicted
Rate
0.99 0.84 0.96 1
Negative Predicted
Rate
3145 [6] K. Srinivas, K. Raghavendra Kao, and A.
Govardham, Analysis of coronary heart disease and prediction of heart attack in coal mining regions using data mining techniques,” in The 5th International Conference on Computer Science & Education, 2010, pp. 1344– 1349. [7] Y. Xing, J. Wang, Z. Zhao, and A. Gao,
“Combination Data Mining Methods with New Medical Data to Predicting Outcome of Coronary Heart Disease,” in 2007 International Conference on Convergence Information Technology (ICCIT 2007), 2007, pp. 868–872 [8] M. Jabbar, P. Chandra, and B. Deekshatulu,
“Cluster Based Association Rule Mining for Heart Attack Prediction,” Journal of Theoretical & Applied Information Technology, vol. 32, no. 2, pp. 196–201, 2011. [9] Rovina Dbritto, Anuradha Srinivasaraghavan,
Vincy Joseph “Comparative Analysis of Accuracy on Heart Disease Prediction using Classification Methods”. International Journal of Applied Information Systems (IJAIS) – ISSN: 2249-0868 Foundation of Computer Science FCS, New York, USA Volume 11 – No. 2, July 2016.
[10]S. B. Patil and Y. S. Kumaraswamy, “Extraction of Significant Patterns from Heart Disease Warehouses for Heart Attack Prediction,” International Journal of Computer Science and Network Security (IJCSNS), vol. 9, no. 2, pp. 228–235, 2009.
[11]Aqueel Ahmed, Shaikh Abdul Hannan,” Data Mining Techniques to Find Out Heart Diseases: An Overview”, International Journal of Innovative Technology and Exploring Engineering (IJITEE), 2012.
[12]Jain N, Sharma V, Malviya M. Reduction of negative and positive association rule mining and maintain superiority of rule using modified genetic algorithm. International Journal of Advanced Computer Research (IJACR). 2012; 2(6):31-6.
[13]Kohavi, R., 1995, August. A study of cross-validation and bootstrap for accuracy estimation and model selection. In Ijcai (Vol. 14, No. 2, pp. 1137-1145).
[14]Bermingham, M.L., et al, 2015. Application of high-dimensional feature selection: evaluation for genomic prediction in man. Scientific reports 5.
[15]Chandrashekar, G. and Sahin, F., 2014. A survey on feature selection methods. Computers & Electrical Engineering, 40(1), pp.16-28.
[16]Witten, I.H., Frank, E., Hall, M.A. and Pal, C.J., 2016. Data Mining: Practical machine learning tools and techniques. Morgan Kaufmann.
[17]Larson, S. C., 1931, Jan. The shrinkage of the coefficient of multiple correlation. Journal of Educational Psychology 22(1), pp. 45-55. [18]Geisser, S., 1975. The predictive sample reuse
method with applications. J. Amer. Statist. Assoc., 70:320–328.
[19]Stone, M., 1974. Cross-validatory choice and assessment of statistical predictions. J. Roy. Statist. Soc. Ser. B, 36:111–147.
[20]Zriqat, I., et al, 2016. A Comparative Study for Predicting Heart Diseases Using Data Mining Classification Methods. International Journal of Computer Science and Information Security (IJCSIS), Vol. 14, No. 12, pp. 868-879. [21]Hajian-Tilaki, K., 2013. Receiver operating