ISSN: 1992-8645 www.jatit.org E-ISSN: 1817-3195
7113
SPEAKER IDENTIFICATION AND LOCALIZATION USING
FUSION OF FEATURES AND SCORE LEVEL FUSION
¹ RASHA H. ALI, 2 DR. MOHAMMED NAJM ABDULLAH AND ³DR. BUTHAINAH F. ABED 1 Lecturer in University of Baghdad- College of Education for Women- Computer department and
Ph.D. Student in ICCI, Iraq
2 ASST. PROF., Lecturer in Iraqi Commission for Computers and Informatics (ICCI) - Information Institute for Postgraduate Studies, Iraq
³ ASST. PROF., University of Information Technology and Communications, Iraq E-mail: 1[email protected], 2 [email protected], ³[email protected]
ABSTRACT
The localization and identification of speaker used in diverse application such as meeting, conferences, smart environments and robot-human interactions. So, the accuracy is perfectly significant of these systems which is increasing in the proposed system. In this paper the proposed system depends on identification and localization features. Three stages are presented: the preprocessing, the stage of extraction for the feature and the classification stage. In the stage of preprocessing, the energy and zero crossing techniques that are be using to split voice and silent of the speech signals. While in the stage of feature extraction, the fusion level features that are using for identification and for localization implemented with six features in both domains (the domain of time and frequency). For identification features: - the energy and the zero crossing were extracted in a time domain. The entropy feature was extracted after computation the wavelet transform. The spectral centroid, spread and spectral entropy were extracted after computation the Fourier transform. While for a localization features, the Capon beam forming (MVDR) was implemented. In a classification stage, the random forest was used and the score level fusion technique for random forest and the support vector machine. The ELSDSR dataset was used for training and testing, which contains 198 file sound. The accuracy of the system was 88.050% when using the random forest, and 95.226%
when using score level fusion
Keywords: Speaker Localization, Speaker Identification, Random Forest, Support Vector Machine, Feature Level Fusion, Score Level Fusion.
1. INTRODUCTION
Communication is a multidimensional dynamic process that is necessary to express thoughts, emotions, and needs, allowing interaction between people and their environment. The hearing, motor coordination and speech production are included in the process of communication. If one of these aspects or more is impaired, the communication is disordered[1].
The analysis for Auditory Scene (ASA) is the basis in human communication. The capabilities of human auditory permit us to identify speakers and speech, localize and separate different speakers or sound sources[2]. The signal of speech includes significant paralinguistic information, like identity, gender, age, accent, the state of emotional for the speaker and language[3].
ISSN: 1992-8645 www.jatit.org E-ISSN: 1817-3195
7114 systems of text-independent [5]. The system of human auditory has abilities to realize and localize a target source in complex multi-source scenarios. The speaker localization is an important technique for the ability of the robot to detect the directions of talkers for expression of the interest in the conversation by using speaker localization systems. So it remained the challenging function for algorithms that are used for localization[6].
1.1 The Contribution of The Work
The Ref [7-9] presents the identification and localization of the speakers using camera video for acquisition the information that used for tacking the person and detect the identity of the speaker, the researches that depend on the camera video used the audio and visual features that gave are good results but high cost. In Ref [10], he speaker localization and identification had been presented in two stages: localization and identification using MFCC. While the contribution of this work is determining the position of speakers and identification of a speaker in closed spaces in parallel, By using the techniques of speaker localization for determination the localization of a speaker and used these techniques for identification by concatenation the feature of identification and the feature of localization to construct the feature fusion using Radio- Frequency Identification (RFID) that used one or array of a microphone for data acquisition which depend only on the audio features. And because those systems using in many application and system such as the environments of smart, The interaction between the robot and human. So the improvements of the accuracy are very important and necessary, so the paper presents the novel method by using the score level fusion also known decision fusion gave more improvement in an accuracy.
2. THE DATASET
The dataset ELSDSR that was used for training and testing the system. The purpose of creating the speech database of English language for the recognition of speaker is to take out wealthy voice messages with respect to gauge inter and intra speaker variability. Subjects are enrolled in a Danish technical university environment. Most of them are non-native English speakers. It supplies a good rate for speaker recognition. ELSDSR contains voice messages from 22 speakers (12M/
10F), and the age covered from 24 to 63. the speaker was different in distribution with respect of nationality and age, except for the gender[11].
3.
THE PROPOSED SYSTEMIn general, the speaker identification contains the following stages: -
1. Frontend processing (preprocessing):
-this step related to the “signal processing” part, which converts the continuous signals into discrete signals, removes the noise or background noise from signals using different techniques.
2. Feature extraction: - this step for
extracting the acoustic features from signals of speakers to construct set of vectors of feature for use in training and testing phases.
3. Decision-making:- it’s the final decision
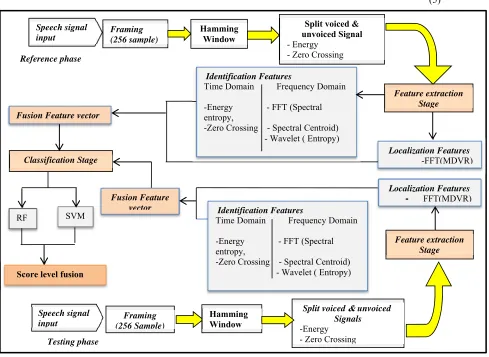
step for an identity of a speaker by comparing unknown feature vectors to all models in a database[12]. Fig.1 shows the components of a proposed system, while the steps of the system shown in algorithm 1.
3.1. The Preprocessing Stage
In this stage contains the following steps:
a. Pre emphasize the signal, the idea of pre-emphasis is to spectrally flatten the speech signal and equalize the inherent spectral tilt in speech, it is used by the first order First Impulse Digital Filter (FIR) using the following equation
( ) 1 1
p
H Z az (1)
Where 𝑎 is a constant, which value is, 𝑎 0.97 [13].
b.Framing the signal of speech into blocks with 25ms with overlap 10ms.
c. Windowing the speech signal by applying the hamming window with a view to keeping the signal continuity, so each frame multiply with hamming window using the following equation[14].
2 ( ) 0.54 0.46cos
1
n H n
N
(2)
ISSN: 1992-8645 www.jatit.org E-ISSN: 1817-3195
7115
Where n is a current sample, and N: number samples in each frame.
d. The detection of voice activity (VAD) was applied, VAD is the operation of setting the presence of human speech [4]. And, for splitting the signal of speech into voiced and unvoiced signal we used the energy of short time (STE)[15] and the rate of zero crossing (ZCR) for each frame[16] using the Eq. (3) and (4) respectively.
2( )
n n
E x n
(3)Where, n is the current sample
1
1
1
(1 1)T t t 0
t
ZCR T S S
(4)
Where, 𝑠 is a signal of length 𝑇 and the indicator function ‖ 𝐴 is egalitarian to one When 𝐴 is True and otherwise is egalitarian to 0. While, the indicating the speech segment by the STE and ZCR using the threshold for energy. Eq.(5) shows the threshold of energy[17].
Threshold Emin 0.1 (Emax Emin– )
[image:3.612.71.560.276.633.2](5)
Figure 1: The proposed system
Speechsignal input
Framing (256 sample)
Hamming Window
Feature extraction Stage
Classification Stage
Speech signal
input (256 Sample)Framing
Splitvoiced &unvoiced Signals -Energy - Zero Crossing
Feature extraction Stage Reference phase
Testing phase
Split voiced & unvoiced Signal - Energy
- Zero Crossing
Localization Features -FFT(MDVR)
SVM RF
Hamming Window Fusion Feature vector
Identification Features
Time Domain Frequency Domain
-Energy - FFT (Spectral entropy,
-Zero Crossing - Spectral Centroid) - Wavelet ( Entropy)
Localization Features
- FFT(MDVR) Fusion Feature
vector
Identification Features
Time Domain Frequency Domain
-Energy - FFT (Spectral entropy,
-Zero Crossing - Spectral Centroid) - Wavelet ( Entropy)
ISSN: 1992-8645 www.jatit.org E-ISSN: 1817-3195
7116
3.2. The Feature Extraction Stage
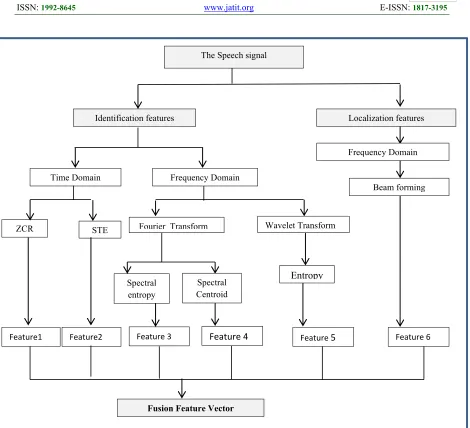
After the stage of preprocessing, the frames of speech signal were used for extraction the features for introducing the fusion features vector for identification and localization for both domains (time and the frequency domain) and features as show in the following step: - fig.2 displays the stage of the extraction for features.
a. The Short Time Energy STE : -
compute the STE for the speech signal using the Eq.(3).
b. Zero Crossing Rate ZCR : -
Computethe ZCR for the speech signal using the Eq. (4).
Algorithm 1: The Speaker Identification and localization System
Input:- The speech signal.
Output:- The speaker identification.
Begin
Step1:- read the speech signal.
Step2:- pre- emphasize the signal using the Eq.(1).
Step3:- Framing the signal into blocks with 256 sample in each frame.
Step4:- Apply hamming window for each frame using Eq.(2).
Step5:- Voice Activity Detection(VAD) using the STE and ZCR by the Eq.(3) and(4) respectively and Eq.(5).
Step6:- Extract the feature using STE and ZCR in time domain using the Eq.(3) and (4).
Step7:- Compute Fourier transform for the signal using the Eq.(10).
Step8:- Extract feature using SE and SC using the Eq.(14) and (15) respectively.
Step9:- Extract feature for localization using the MDVR technique by the Eq.(20).
Step10:- Compute the Wavelet transform (Haar type) using the Eq.(8).
Step11:- Extract the Entropy using the Eq.(12).
Step12:- Classification the fusion features using RF by the Eq.(23).
Step13:- Classification the fusion features using SVM by the Eq.(24).
Step14:- Classification the fusion features using score level fusion for RF and SVM.
ISSN: 1992-8645 www.jatit.org E-ISSN: 1817-3195
7117
c. The Discrete Wavelet Transform DWT :-
Wavelets are efficient tools for converting the time into the domain of frequency and more effective tool for analysis of non-stationary signals[18]. The process of DWT is decomposing of the input signal into groups of function, this sets called wavelets. The DWT is accomplished by using mother wavelet function by the shifting and scaling. So the result of DWT process is wavelet coefficients. The signal has been reconstructing as the linear collection of wavelets and coefficients of weighting wavelet. After every decomposition, the coefficients that are resulted from the
divided of the signal are approximation coefficients A and detailed coefficients D[19].
The transform of continuous wavelet (CWT) for the signal f t( ) in time
t
is defined in the following eq.(6)[20]* 1
( , ) ( ) t b
w t a b f t d t
a a
(6)
Where a b, ( )t ((t b a ) ) a with a b, R,and *( )t is
complex conjugate of the mother function ( )t . a is scale parameter and b is translation parameter. For the
discrete parameter, 2 j
[image:5.612.74.544.71.499.2]a and
Figure 2: The feature extraction stage
The Speech signal
Localization features Identification features
Spectral entropy
Entropy Fourier Transform
STE ZCR
Frequency Domain Time Domain
Wavelet Transform
Spectral Centroid
Frequency Domain
Beam forming
Feature1 Feature2 Feature 3 Feature 4 Feature 5 Feature 6
ISSN: 1992-8645 www.jatit.org E-ISSN: 1817-3195
7118 2 j
b k, with j k, Z(set of integers),
and the base wavelet family is then expressed as:
2
, ( ) 2 (2 )
j j
j k t t k
(7) As a result, the DWT for the signal f t( )
is obtained as:
2 *
,
( , ) ( ), ( ) 2j ( ) (2j )
j k
wt j k f t t f t t k dt
(8) where the symbol
.
denotes the operation of inner product [21].d. Fourier Transform(FT): -
The transform of Fourier of a signal is called the signal representation in the domain of the frequency. The transform of Discrete Fourier (DFT) are quite useful because they detect periodicities for input data. The limitation condition in DFTs is that the series of discrete time must be periodic, and frequency of sampling should be great than twice of the band-limited frequency.
The discrete function case is
( ) ( )k
f t f t by letting fk f t( ),k
where tk K with K0,1,...,N1.
Writing this gives the transform of discrete Fourier [22]:
10 ( )
N
n k k n
F F f n (9)
As
2 1
0
i n k N
N
n k
k
F f e
(10)The inverse transform 2
1
0
1 N in k N
n n
k
f F e
N
(11)In a DET, the signal is transformed from a domain of time ( )fk into a domain of frequency ( )Fn [23]. For calculating the Eq.(9) or (10). The FFT is used for decreasing number of computations necessary for N pointsfrom 2 2
N to
2 logN N where log is the base 2
logarithm [24].
e. The Shannon Entropy (SE): -
Entropy is the measure of quantitative of how uncertain the result of a random
experience [25]. The Shannon’s entropy is the suitable metric to gauge the organization and information sources of the signal. For signal x, the Shannon entropy is defined in Eq. (12)[26]:-
1
log ( )
N i i
H p p i
(12)Where pi is the likelihood that the
signal belongs to a considered period, with understanding that
log
p
(
i
)
0
i
p
if
p
i
0
, and N is a number samples. The entropy H is a gauge of theinformation needed to determine a system in a specific case, the sense that H is the
measure of our obscurity about the system.
f. Spectral Entropy SE : -
The spectral entropy the has been computed in the domain of frequency, after computing the FFT, then compute the Density of Power Spectral (PSD) using Eq.(13)[27, 28]. Then finally, compute the spectral entropy using the standard entropy equation as mention in Eq. (12).
2 1
( i) ( i)
p w X w
N
(13)
g. Spectral Centroid and Spread (SC and SS): -
The spectral centroid of the signal is the curve which the value at any given time is the centroid of the identical fixed-time cross portion of the signal’s spectrogram[29]. The Eq. (14) is the spectral centroid equation.
[ ] [ ] e s e s K t k K t K t k K
M k k
C M k
(14)Where Ct represents the spectral centroid of
number for frame t, while M kt[ ] is the power spectrum with frequency bin number
,
ISSN: 1992-8645 www.jatit.org E-ISSN: 1817-3195 7119 2 2 2 0 2 2 0 ( ) ( ) ( ) N k k N k
f S C X k
S S X k (15)
h. Capon beamforming (Minimum Variance distortion less response (MVDR))
The minimum variance distortionless response MVDR or calledCapon beamformer is one
of the direction of arrival DOA
technique, which vastly used in sensor array signals processing applications. It depends on the estimation of the power of a signals that have multiple narrowband sources[31]. The MVDR is one of the techniques of adaptive beamforming that it is used to reduce a variance of the noise. The broadband MVDR beamformer divides wideband signals into narrowband components andtreats these components
independently[32]. The MVDR algorithm relies on the steering vectors. MDVR calculate the weight vector to locate the desired signal from the interference, maximize the sensitivity in one direction only and minimizes the power of output. The result is given at any time by the linear series of the data at source signals, with being the weight vector in Eq. (16)
y n( ) wH ( ) ( )n * n (16) The Weight vector W n( ) is in the
Eq.(17) 1
0
( ) M n,
N
w n w
10
( ) M n
n
x n X
(17) the matrix inverse operation and uses the immediate gradient vector J n( ) forweight vector upgrading, the weight vector at time n1 can be written as Eq.(18)
1
( 1) ( ) [ ( )] 2
w n W n J n (18)
Where
is the step size parameter. While the Eq. (19) shows the weight vectorW n( 1)W n( )[ ( )p n R n W n( ) ( )] (19)
( ) ( ) *( ) ( ) ( )
W n X n d n X n W n
( ) *( )
W n Xe n
While R is covariance matrix, p is cross- correlation vector, J n( )is gradient vector
While the desired signal can be defined by the following equations:
y n( ) w H ( ) ( )n x n (20) e n( )d n y n W n( ). ( ) ( 1)
W n( )
X n e n( ) ( )*The MDVR minimize the noise and high the signal noise ratio (SNR) using the Eq.(21)[33]
1 0 l o g1 0( )
S S N R
N
(21)
While S is the desired signal, and N is noise signal.
3.3 The Classification stage
In the classification stage, the feature vectors have been classified using score level fusion by using two classification techniques random forest (RF) and support vector machine (SVM) as following:
a. Random Forest (RF):
It is the ensemble of classification and regression tress (CART) [34]. RF is the technique used for regression and classification. It is trained on the same size of the datasets, a training set, it called bootstraps, created by resampling randomly the training group itself. Once a tree is built, the set of bootstraps, which do not include any special record from the genuine dataset out-of-bag (OOB) samples, it used as the test set [35]. In the algorithm of random forest, the random vector k is produced, independent from the previous random vectors and distributed to all trees, and each tree is mature using random vector k and training set, that results in the aggregate of classifiers for tree-structured h x( ,k),k1....at input vector x. In RF, the generalization error that estimate by the classification error as defined in Eq. (22)
*
, ( ( , ) 0 )
X Y
ISSN: 1992-8645 www.jatit.org E-ISSN: 1817-3195
7120 Where the random vectors are (X and Y ) and mg is the margin function that measures that range to which the mean number of votes in random vectors for the right output override the mean vote for any other output. Margin function is defined as the Eq. (23)
( , ) k ( ( )k ) maxj Y k ( ( )k )
mg X Y av I h x Y av I h X j
(23) Where
I
(.)
is the indicator function[36].b. Support Vector Machine SVM :
SVM is a technique used for classification, regression, and preference (or ranking) learning. The SVM can be formed in different forms (single class and multiclass). In single-class classification, The SVM as binary classifier where the result of the learned function is either negative or positive. In multiclass classification, the SVM is merging manifold binary classifiers using pairwise coupling method[37]. SVMs is one of a kernel methods category, that used in feature space of high dimensional for computing a dot product [38].
SVM classification:
li 1 i 2
K
f,
f
C
min
i
yif(xi) 1 - i,
for all i i 0 (24)
Dual formulation:
l
1 i
l
1 j
j i j i j i l
1 i
i
α 2 αα yyK( , )
1 α min
i
x x
0 i C, for all i; (25) Variables i are slack variables, they measure an error made in point (xi,yi). Training SVM becomes quite challenging when the number of points for training is large[39].
4. RESULT AND IMPLEMENTATION
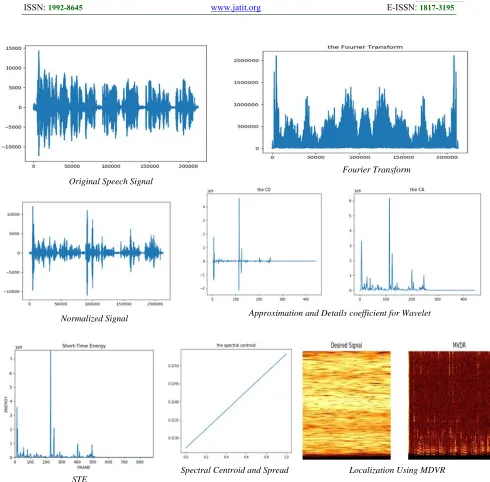
The proposed system has been implemented on ELSDSR dataset with sampling rate 16000, 22 speakers ( 12M/10F). The dataset was divided into 80% for training and 20% for testing. The accuracy of the system was 88.05% when used random forest algorithm, while the accuracy was 95.22% when used score fusion level in classification for random forest and multiclass support vector machine. In fig.3. and Table 1.
shows the features of a speech signal in the proposed system.
The Name
Total Sample
No. of frame
STE ZCR Entropy SC SS SE SNR
Femal-Sp1
74400 310 198816.304 0.1221 3.0330 0.3227 0.3253 3.1025 20.047
ISSN: 1992-8645 www.jatit.org E-ISSN: 1817-3195
7121
5. CONCLUSION
The importance of the speaker identification and localization systems accuracy is significant for identify and localize the person perfectly. This paper presented a system for increasing the accuracy of such systems by using feature vector fusion, score level fusion and one of a localization technique because of its capability for detecting the source of the speaker signal. A feature extraction phase is an important stage for identification process, therefore using six features
(identification and localization features) with different domains to extract the good fusion feature vector. The results showed which there is an improvement in accuracy when using score level fusion and using RF and SVM in classification phase rather than using the one classifier. So the accuracy of these systems is significant for localizing and identify the person perfectly.
Original Speech Signal
Normalized Signal
STE
Fourier Transform
Approximation and Details coefficient for Wavelet
[image:9.612.67.557.71.553.2]Spectral Centroid and Spread Localization Using MDVR
ISSN: 1992-8645 www.jatit.org E-ISSN: 1817-3195
7122 REFERENCES:
[1] K. L. Kadi, S. A. Selouani, B. Boudraa, and M. Boudraa, "Fully automated speaker identification and intelligibility assessment in dysarthria disease using auditory knowledge,"
Biocybernetics and Biomedical Engineering,
vol. 36, 2016, pp. 233-247.
[2] M. Li, J. Kim, A. Lammert, P. K. Ghosh, V. Ramanarayanan, and S. Narayanan, "Speaker verification based on the fusion of speech acoustics and inverted articulatory signals,"
Computer speech & language, vol. 36,2016,
pp. 196-211.
[3] S. Safavi, M. Russell, and P. Jančovič, "Automatic Speaker, Age-group and Gender Identification from Children’s Speech,"
Computer Speech & Language, 2018.
[4] S. S. Tirumala, S. R. Shahamiri, A. S. Garhwal, and R. Wang, "Speaker identification features extraction methods: A systematic review," Expert Systems With Applications, vol. 90, 2017, pp. 250-271.
[5] Y. Liu, Y. Qian, N. Chen, T. Fu, Y. Zhang, and K. Yu, "Deep feature for text-dependent speaker verification," Speech Communication,
vol. 73, 2015, pp. 1-13.
[6] D. A. Blauth, V. P. Minotto, C. R. Jung, B. Lee, and T. Kalker, "Voice activity detection and speaker localization using audiovisual cues," Pattern recognition letters, vol. 33,
2012, pp. 373-380.
[7] Y. Hu, "Multimodal speaker localization and identification for video processing," HKU
Theses Online (HKUTO), 2014.
[8] A. A. Salah, R. Morros, J. Luque, C. Segura, J. Hernando, O. Ambekar, et al., "Multimodal
identification and localization of users in a smart environment," Journal on Multimodal User Interfaces, vol. 2, 2008, pp. 75-91.
[9] K. Youssef, K. Itoyama, and K. Yoshii, "Simultaneous Identification and Localization of Still and Mobile Speakers Based on Binaural Robot Audition," JRM, vol. 29,
2017, pp. 59-71.
[10] H. Tómasson, "Speaker localization and identification," Citeseer, 2012.
[11] L.Feng,"Speaker Recognition," in Informatics and Mathematical Modelling, echnical
University of Denmark, DTU, ed, 2004.
[12] C. Turner and A. Joseph, "A wavelet packet and mel-frequency cepstral coefficients-based feature extraction method for speaker identification," Procedia Computer Science,
vol. 61, 2015, pp. 416-421.
[13] M. Kumar and A. G. Singh, "Performance analysis of LPC and MFCC techniques in automatic speech recognition," 2015.
[14]S. Yang, Statistical approaches for signal processing with application to automatic singer identification: Rochester Institute of
Technology, 2016.
[15] R. C. Guido, "A tutorial on signal energy and its applications," Neurocomputing, vol. 179,
2016, pp. 264-282.
[16] K. Sundararajoo, "Improvement of audio feature extraction techniques in traditional Indian string musical instrument," Universiti Tun Hussein Onn Malaysia, 2015.
[17] E. Chandra and K. M. M. Kalaivani, "A study on speaker recognition system and pattern classification techniques," 2014.
[18] P. Fletcher and S. J. Sangwine, "The development of the quaternion wavelet transform," Signal Processing, vol. 136,
2017, pp. 2-15.
[19] E. Alickovic, J. Kevric, and A. Subasi, "Performance evaluation of empirical mode decomposition, discrete wavelet transform, and wavelet packed decomposition for automated epileptic seizure detection and prediction," Biomedical Signal Processing and Control, vol. 39, 2018, pp. 94-102.
[20] M. Tayyab, J. Zhou, R. Adnan, and X. Zeng, "Application of Artificial Intelligence Method Coupled with Discrete Wavelet Transform Method," Procedia Computer Science, vol. 107, 2017, pp. 212-217.
[21] X. Zhang, N. Feng, Y. Wang, and Y. Shen, "Acoustic emission detection of rail defect based on wavelet transform and Shannon entropy," Journal of Sound and Vibration,
vol. 339, 2015, pp. 419-432.
[22] C. Cerovecki and S. Hörmann, "On the CLT for discrete Fourier transforms of functional time series," Journal of Multivariate Analysis, vol. 154, 2017, pp. 282-295.
[23] R. Kluger, B. L. Smith, H. Park, and D. J. Dailey, "Identification of safety-critical events using kinematic vehicle data and the discrete fourier transform," Accident Analysis & Prevention, vol. 96, 2016, pp. 162-168.
[24] B. Mukherjee, V. Srivardhan, and P. Roy, "Identification of formation interfaces by using wavelet and Fourier transforms,"
Journal of Applied Geophysics, vol. 128,
2016, pp. 140-149.
ISSN: 1992-8645 www.jatit.org E-ISSN: 1817-3195
7123 Entropy," Annals of Nuclear Energy, vol.
108, 2017, pp. 1-9.
[26] R. Gu, "Multiscale Shannon entropy and its application in the stock market," Physica A: Statistical Mechanics and its Applications,
vol. 484, 2017, pp. 215-224.
[27] T. P. Shri and N. Sriraam, "Spectral entropy feature subset selection using SEPCOR to detect alcoholic impact on gamma sub band visual event related potentials of multichannel electroencephalograms (EEG),"
Applied Soft Computing, vol. 46, 2016, pp.
441-451.
[28] A. Abdelsamie, G. Janiga, and D. Thévenin, "Spectral entropy as a flow state indicator,"
International Journal of Heat and Fluid Flow, vol. 68, 2017, pp. 102-113.
[29] N. Kamarudin, S. Al-Haddad, S. J. Hashim, M. A. Nematollahi, and A. R. B. Hassan, "Feature extraction using spectral centroid and mel frequency cepstral coefficient for Quranic accent automatic identification," in
Research and Development (SCOReD),
2014 IEEE Student Conference on, 2014,
pp. 1-6.
[30] T. Furoh, T. Fukumori, M. Nakayama, and T. Nishiura, "A study of degraded-speech identification based on spectral centroid," in
INTER-NOISE and NOISE-CON Congress
and Conference Proceedings, 2014, pp.
2946-2951.
[31] K. Elkhalil, A. Kammoun, T. Y. Al-Naffouri, and M.-S. Alouini, "Fluctuations of the SNR at the output of the MVDR with regularized Tyler estimators," Signal Processing, vol. 135, 2017, pp. 1-8.
[32] Q. Huang, R. Hu, and Y. Fang, "Real-valued MVDR beamforming using spherical arrays with frequency invariant characteristic,"
Digital Signal Processing, vol. 48, 2016, pp.
239-245.
[33] T. S. Kiong, S. B. Salem, J. K. S. Paw, K. P. Sankar, and S. Darzi, "Minimum variance distortionless response beamformer with enhanced nulling level control via dynamic mutated artificial immune system," The Scientific World Journal, vol. 2014, 2014.
[34] Z. Bei, Z. Yu, N. Luo, C. Jiang, C. Xu, and S. Feng, "Configuring in-memory cluster computing using random forest," Future
Generation Computer Systems, vol. 79,
2018, pp. 1-15.
[35] A. Sarica, A. Cerasa, and A. Quattrone, "Random Forest Algorithm for the Classification of Neuroimaging Data in
Alzheimer's Disease: A Systematic Review," Frontiers in Aging Neuroscience,
vol. 9, 2017, p. 329.
[36] Z. Masetic and A. Subasi, "Congestive heart failure detection using random forest classifier," Computer methods and programs in biomedicine, vol. 130, 2016, pp. 54-64.
[37] M. Li, X. Liu, and X. Liu, "Infrasound signal classification based on spectral entropy and support vector machine,"
Applied Acoustics, vol. 113, 2016, pp.
116-120.
[38] T. T. Ramanathan and D. Sharma, "Multiple Classification Using SVM Based Multi Knowledge Based System," Procedia
Computer Science, vol. 115, 2017, pp.
307-311.