2017 International Conference on Computer Science and Application Engineering (CSAE 2017) ISBN: 978-1-60595-505-6
Application of Bionics of Tiger Beetle to Aerodynamic Optimization
of MIRA Fastback Model
Sijie Peng, Xiaoyue Liu, Zhuoming Li and Fachao Jiang*
College of Engineering, China Agricultural University, 100083 Beijing, China
ABSTRACT
Aerodynamic drag plays a primary role in vehicle’s fuel consumption. Drag reduction has been a more and more important part in automotive body design. Bionics has been successfully applied to drag reduction optimizations in automotive body design.
This research aimed at reducing drag coefficient of MIRA fastback car model by applying principles of bionics. Tiger beetle was sliced and photos of the slices were taken to establish model in SolidWorks software. And its aerodynamics of moving status was studied. Its external flow field was simulated and analyzed. Aerodynamic features on tiger beetle was extracted and applied to the optimization of MIRA fastback model. Flow field simulation of baseline model and optimized model were executed. The drag coefficient of baseline model and optimized model was 0.28 and 0.29. The optimization brings a 3.4% reduction to the baseline model. The conclusions can provide reference to automotive body design.
INTRODUCTION
Reasonable vehicle body is beneficial to the improvement of vehicle’s aerodynamic performance. The emerging shortage of oil supply and people’s concern with fuel consumption of cars have put researchers and vehicle engineers in front of the important task of drag reduction.
Bionics is the application of natural, biological shape, structures, and methods to engineering design. Animals and plants have been through millions of years of natural selection. Studies have found out that the best swimmers who are with streamlined shape have smaller hydrodynamic drag [1]. The same can be found on the aerodynamics of animals on ground. The best runners also have smaller aerodynamic drag.
Vehicle body designs based on bionics of different creatures have been carried out by designers, and coefficient could be reduced effectively. Volkswagen Beetle has a body inspired by beetle. Mercedes-Benz has designed a car with a body inspired by yellow boxfish, and has a drag coefficient of 0.19 according to Kozlov’s study [2]. Dongri Kim’s research introduced a drag reduction device on cars inspired by secondary feathers of bird’s wing suction surface, which brought a 19% drag reduction [3].
In a typical active drag reduction method, a suction or blowing system is adopted to control the flow. In E. Bideaux’s study [4], a strip of pulsed jets was equipped at the roof of an Ahmed model to control the flow separation on rear window. The pulsed jet obtained a 20% drag reduction. Suction equipped in the rear part of car can also reduce rear wake and vortex formation. In Harinaldi H.’s research [5], a drag reduction of 13.86% in computational approach and 16.32% in experimental approach was brought by the application of suction.
As for passive drag reduction, vortex generator, diffuser, rear spoiler and streamlined body can all affect the flow. Vortex generator reduces drag coefficient by delaying flow separation near vehicle’s rear end. In Koike, M.’s research [6], a Mitsubishi Lancer Evolution’s drag coefficient showed a 0.006 reduction with vortex generator. In Hu and Wong’s study [7], two simulations were carried out to study the drag coefficient of a simplified Camry model with and without rear-spoiler. And it showed that rear-spoiler can bring a 1.7% reduction to CD and a 4% reduction to CL.
Our study was aimed at finding a drag-reducing optimization approach of a car based on the application of bionic principles of tiger beetle.
ESTABLISHMENT OF TIGER BEETLE MODEL
The length of a tiger beetle is usually only 20 mm, while its speed can reach 9 km/h. After thousands of years of evolution, the streamlined shape of tiger beetle’s body is a good case for aerodynamic study and automotive body design. If its aerodynamics feature can be collected and be applied to automobile design, contribution can be made to the aerodynamic performance of cars. The research studied the aerodynamics of the external flow field of a tiger beetle and applied it to automobile design in order to reduce drag coefficient of a car.
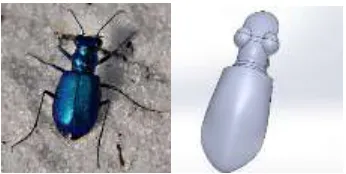
[image:2.612.192.401.509.628.2]Tiger beetle is famous for its high speed when pursuing prey. Its running speed can reach up to 125 times its length. Considering body length, it’s even faster than cheetah. This study aimed to reduce vehicle’s drag coefficient by investigating the shape of tiger beetle, finding out its aerodynamic features, and applying them on vehicle model’s aerodynamic optimization.
Figure 2. Tiger beetle and the simplified model.
Tiger beetle’s body state of high-speed movement was observed using industrial camera. According to Gilbert, C. [8], tiger beetle does not use wings when running at a high speed. In the observation, its hardened front wings and second wings did not have obvious actions. The body shape of a moving tiger beetle is similar to its state when standing still, which agrees with Gilbert’s finding. Based on the observation, it’s reasonable to model the tiger beetle based on its still status. So, paraments of tiger beetle was measured and 3-D model was created. Body of tiger beetle was sliced to make sketches of control planes in SolidWorks software. Photos of the tiger beetle slices was taken by industrial camera. These photos can be used as background for sketch in SolidWorks after zooming and rotating. Splines was used to stroke the sketch of control plane. The sketches of tiger beetle slices in SolidWorks is shown in Figure 1.
Simplifications were applied to the model of tiger beetle based on two principles. The first, body parts that would not affect its aerodynamic performance were simplified. The second, body parts that cannot be used on aerodynamic optimization of a ground vehicle were ignored. Based on the two principles, mouth of the tiger beetle was merged into one part. Wings, legs, and abdominal segments are ignored. Basic characteristics of its body was modeled, as shown in Figure 2.
ESTABLISHMENT OF MIRA FASTBACK MODEL
MIRA fastback reference model was used in the study as prototype to be optimized. A 1:1 MIRA fastback baseline model was created [9].
[image:3.612.182.413.506.660.2]The distance from car’s front face to external flow field’s inlet was set to 3 times the length of car. The distance from car’s back to flow field’s outlet was set to 7 times of itself. Width of the flow field was set to 7 times the car’s width. Total height of the flow field was 5 times the car’s height. So, a 4165 * 1137.5 * 7130 (mm) external flow field was created. The blockage ratio of the external flow field was 2.9%, which met the demand of wind tunnels [10].
ICEM CFD software was used to generate the meshes. Tetrahedral and prism meshes were generated for the external flow. Figure 3 shows the meshes on car body.
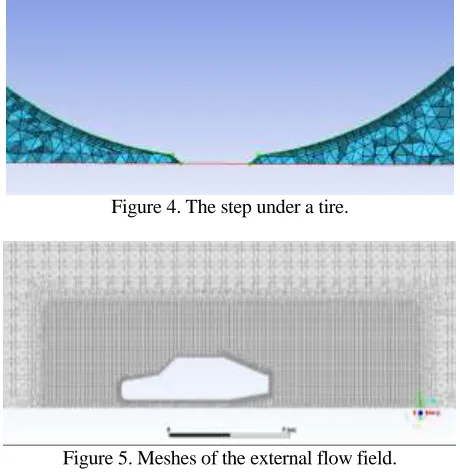
[image:4.612.136.487.339.706.2]Quality of mesh is highly relevant to geometric model. Due to the contact area between tire and ground was only a line in normal modeling, which ignore the pressure on tire caused by the weight of car and can lead to poor mesh quality near the line due to large skewness. To improve precision of the simulation, a trapezoidal step was created under each tire to simulate the deformation when tires are under pressure, as shown in Figure 4. The height of step was 2.5% tire’s diameter.
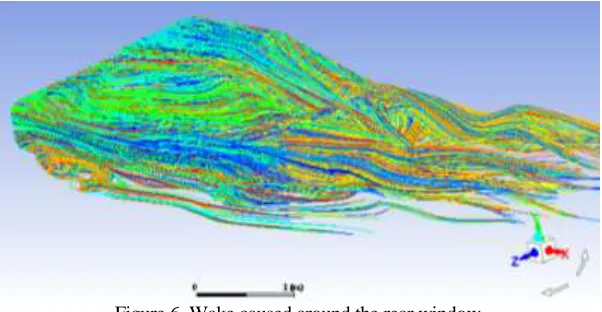
[image:4.612.182.412.345.582.2]10 layers of prism meshes with a growth rate of 1.2 were established near the car body to improve the calculation accuracy in near-wall region [11]. First cell height was calculated by Reynolds number, reference length, and y+ value. Y+ value was set as 11.63. Density box was created to refine the meshes around the car, especially the meshes behind the car, where air streaming is usually sophisticated [12]. Meshes in external flow field is shown in Figure 5.
Figure 4. The step under a tire.
Figure 5. Meshes of the external flow field.
TABLE I. PARAMETERS OF MIRA FASTBACK MODEL.
Parameters Value or model
Inlet boundary Velocity inlet, v=30m/s
Outlet boundary Pressure outlet, p=0
Ground Fixed ground
Sides Fixed ground
Body surface boundary Fixed ground, reference value for area was 1.8501m2, the
length was 4.165m
NUMERICAL SIMULATION STUDY OF MIRA FASTBACK BASELINE MODEL AND TIGER BEETLE MODEL
Simulation of MIRA Fastback Baseline Model
ANSYS Fluent software was used to simulate the flow of MIRA fastback model. Realizable k-epsilon turbulence model was applied [13]. Boundary conditions and output parameters are listed in TABLE I.
The aerodynamic drag coefficient of MIRA fastback model was monitored in the simulation. The calculation converged after 1500 steps of iterations. CD was 0.29.
Compared with the wind tunnel test’s result 0.275, the error was 5.4%, which met the demand of accuracy.
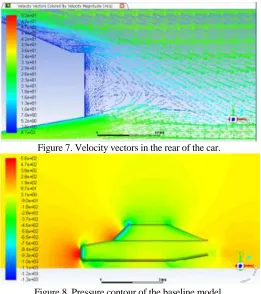
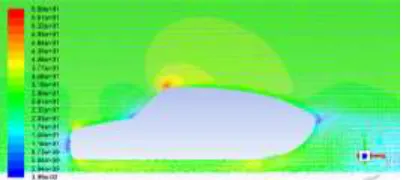
[image:5.612.147.448.357.513.2]Due to the viscosity of air, flow was attached to the body. The flow was smooth and the streamline coincides with the path line on the roof. No separation of air flow was found. Due to the sudden change in curvature between the roof and the rear window, air flow was decelerated and separation can be found upon the rear window. A part of the flow basically kept its route and depart from the roof with the same speed. The other part of the flow was reattached to the rear window, forming a local separation bubble. The velocity of flow in the separation bubble was very low, and it can slow down the flow near the rear window. Flow disturbance can be noticed around the rear window. Also, the high-speed flow from top and bottom of the car interact with lower-speed flow from its sides, causing complicated rear wake, as shown in Figure 6.
Figure 6. Wake caused around the rear window.
Figure 7. Velocity vectors in the rear of the car.
Figure 8. Pressure contour of the baseline model.
TABLE II. PARAMETERS OF MIRA FASTBACK MODEL.
Parameters Value or model
Inlet boundary Velocity inlet, v=2.5m/s
Outlet boundary Pressure outlet, p=0
Ground Fixed ground
Sides Fixed ground
Body surface boundary Fixed ground, reference value for area was 0.000016m2,
the length was 0.0179991m
Viscous model Realizable k-epsilon model
Simulation of Tiger Beetle Model
Simulation of tiger beetle model was similar to car’s simulation. The boundary conditions are listed in TABLE II. The first cell height was set to 0.7365mm. Reynold number was calculated and was 2.15×10³.
Two methods can be used to improve the near-wall calculation accuracy, directly densifying meshes in viscous sublayer, or building prism meshes in it. The reason that prism meshes were built in car’s model was that the shape of prism enabled it to be put into small viscous sublayer and improve near-wall accuracy. The same accuracy couldn’t be achieved by tetrahedral without an acute increase in number of meshes, which takes up more computing resources, slowing down the simulation. But in tiger beetle model, the height of viscous layer was 0.7365mm, which is relatively big compared to the tiger beetle. Tetrahedral can be applied without lowering near-wall calculation accuracy.
Considering tiger beetle’s legs shore it up, the flow area was 1 time the tiger beetle’s height under it. Density box was created around the tiger beetle in order to improve accuracy.
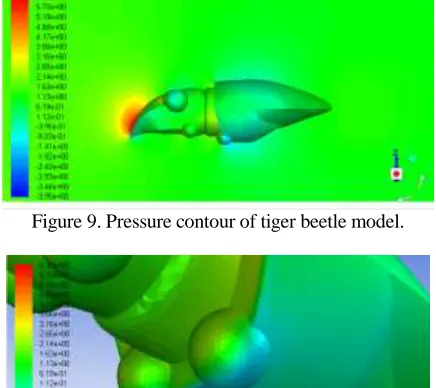
[image:7.612.188.406.168.362.2]The calculation converged after 1000 steps of iteration. As shown in Figure 9, compared to MIRA fastback model’s pressure contour, tiger beetle model’s rear region had a uniform pressure and didn’t have obvious negative pressure region. Also, the pressure change around tiger beetle’s body was very smooth except for the front.
Figure 9. Pressure contour of tiger beetle model.
Figure 10. Pressure under the tiger beetle model.
In the front of tiger beetle model was a high-pressure area, which is similar with the pressure of MIRA fastback model’s front. This was due to the compression of high-speed air flow in the front-facing area leading to a stagnation region, which is common in many objects’ aerodynamics. While in the tiger beetle model, the high-pressure region is less obvious than in MIRA model due to tiger beetle’s curve in the front. Which means that the tiger beetle’s front shape can lead to a reduced stagnation region, thus saving energy needed to overcome aerodynamic drag.
A negative pressure region can be found under the beetle, as shown in Figure 10. Combined with the relatively high pressure on the upper side, a downforce was created, which ensured the stability when tiger beetle is moving fast. The same method can be applied to vehicles to eliminate the lift force and guarantee that the car’s stability at high speed. As reduction of lift force wasn’t the aim of this study, the characteristic under the tiger beetle wasn’t applied to the optimization.
So, it was worth analyzing the aerodynamic features on tiger beetle’s abdomen and cercus, which can be the factor that leads to tiger beetle’s fast speed.
separation, stabilizing airflow around its body, thus enabled it to keep stable movement and move with less aerodynamic drag.
[image:8.612.168.424.231.362.2]Figure 11. Tiger beetle model's velocity vectors on symmetry plane.
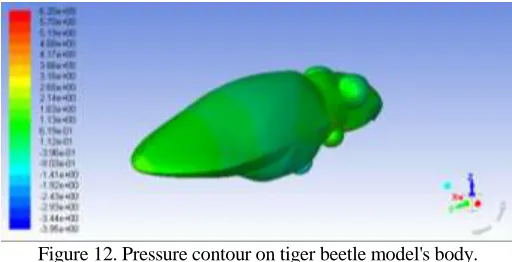
Figure 12. Pressure contour on tiger beetle model's body.
Figure 12 shows how pressure works on tiger beetle’s body. Due to its streamlined shape of abdomen and cercus, flow detaches from its body gradually. No obvious negative pressure region or low-pressure region was noticed on its body. Thus, pressure drag can be reduced, leading to a lower drag coefficient.
SIMULATION RESULT AND ANALYSIS OF OPTIMIZED MODEL
Based on analysis of MIRA fastback model and tiger beetle model, it was found that the curve on tiger beetle’s abdomen and cercus can lead to less flow separation near the body. Thus, MIRA fastback model’s curve of rear window, trunk lid, and chassis was optimized based on the principle of tiger beetle bionics, as shown in Figure 13.
Numerical simulation to optimized car model was conducted. Because the optimization only involved the shape of rear window, trunk lid, and chassis of the car, the length, height and front-face area was not changed. The same external flow field, meshes, and conditions that we used in MIRA fastback baseline model’s simulation can be applied without interfering computing accuracy. The boundary conditions and output parameters are listed in TABLE III. The calculation converged after 956 steps of iteration.
flow separation was caused in the rear region. The two vortices that were found in the MIRA baseline model was largely eliminated in the modified model.
Drag coefficient of optimized car model is 0.28. And the baseline model’s CD is
[image:9.612.173.427.113.253.2]0.29, it is improved 3.4%.
[image:9.612.101.501.297.521.2]Figure 13. Optimized car model based on tiger beetle bionics.
TABLE III. PARAMETERS OF OPTIMIZED CAR MODEL.
Parameters Value or model
Inlet boundary Velocity inlet, v=30m/s
Outlet boundary Pressure outlet, p=0
Ground Fixed ground
Sides Fixed ground
Body surface boundary Fixed ground, reference value for area was 1.8501m2, the
length was 4.165m
Viscous model Realizable k-epsilon model
[image:9.612.199.391.526.610.2]Drag coefficient 0.28
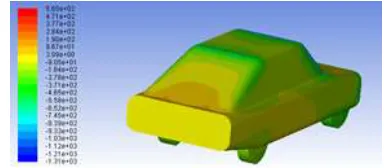
Figure 14. Pressure contour of optimized car model.
Figure 16. Velocity vectors of optimized car model on symmetry plane.
CONCLUSIONS
Tiger beetle’s external flow field was simulated and its aerodynamic features were studied. MIRA reference model’s body curve was aerodynamically optimized according to principles of tiger beetle bionics. In the simulation, optimized car model’s drag coefficient was reduced than the baseline model. The result can provide a reference to automotive body design.
REFERENCES
1. Nesteruk, I., Passoni, G., and Redaelli, A. 2014. “Shape of aquatic animals and their swimming
efficiency,” Journal of Marine Biology, 2014.
2. Kozlov, A., Chowdhury, H., Mustary, I., Loganathan, B., and Alam, F. 2015. “Bio-inspired design:
aerodynamics of boxfish,” Procedia Engineering, 105, pp. 328.
3. Kim, D., Lee, H., Yi, W., and Choi, H. 2016. “A bio-inspired device for drag reduction on a
three-dimensional model vehicle,” Bioinspiration & biomimetics, 11(2), 026004.
4. Bideaux, E., Bobillier, P., Fournier, E., Gilliéron, P., El Hajem, M., Champagne, J. Y. and Kourta, A.
2011. “Drag reduction by pulsed jets on strongly unstructured wake: towards the square back
control,” International Journal of Aerodynamics, 1(3-4), pp. 282-298.
5. Harinaldi, H., Budiarso, B., Warjito, W., Kosasih, E., Tarakka, R., Simanungkalit, S., and Teryanto,
I. G. M. 2012. “Modification of flow structure over a van model by suction flow control to reduce
aerodynamics drag,” Makara Journal of Technology, 16(1), pp. 15-21.
6. Koike, M., Nagayoshi, T., and Hamamoto, N. 2004. “Research on aerodynamic drag reduction by
vortex generators,” Mitsubishi motors technical review, 16, pp. 11-16.
7. Hu, X. X. and Wong, T. T. 2011. “A numerical study on rear-spoiler of passenger vehicle,” World
Academy of Science, Engineering and Technology.
8. Gilbert, C. 1997. “Visual control of cursorial prey pursuit by tiger beetles (Cicindelidae),” Journal of
Comparative Physiology A, 181(3), 217-230.
9. Le Good, G. M. and Garry, K. P. 2004. “On the use of reference models in automotive aerodynamics
(No. 2004-01-1308),” SAE Technical Paper.
10. Hucho, W. H. and Sovran, G. 1993. “Aerodynamics of road vehicles,” Annual review of fluid
mechanics, 25(1), pp. 485-537.
11. Lanfrit, M. 2005. “Best practice guidelines for handling Automotive External Aerodynamics with
FLUENT.”
12. Al-Saadi, A., Hassanpour, A., and Mahmud, T. 2016. “Simulations of Aerodynamic Behaviour of a
Super Utility Vehicle Using Computational Fluid Dynamics,” Advances in Automobile Engineering,
2016.
13. Song, K. S., Kang, S. O., Jun, S. O., Park, H. I., Kee, J. D., Kim, K. H., and Lee, D. H. 2012.
“Aerodynamic design optimization of rear body shapes of a sedan for drag reduction,” International