Open Access
Research article
Early pregnancy peripheral blood gene expression and risk of
preterm delivery: a nested case control study
Daniel A Enquobahrie*
1, Michelle A Williams
1,2, Chunfang Qiu
2,
Seid Y Muhie
3, Kimberly Slentz-Kesler
4, Zhaoping Ge
4and Tanya Sorenson
2Address: 1Department of Epidemiology, University of Washington, Seattle, WA, USA, 2Swedish Medical Center, Seattle, WA, USA, 3Walter Reed Army Institute of Research, Silver Spring, MD, USA and 4Almac Diagnostics, Durham, NC, USA
Email: Daniel A Enquobahrie* - [email protected]; Michelle A Williams - [email protected]; Chunfang Qiu - [email protected]; Seid Y Muhie - [email protected]; Kimberly Slentz-Kesler - [email protected]; Zhaoping Ge - [email protected]; Tanya Sorenson - [email protected]
* Corresponding author
Abstract
Background: Preterm delivery (PTD) is a significant public health problem associated with greater risk of mortality and morbidity in infants and mothers. Pathophysiologic processes that may lead to PTD start early in pregnancy. We investigated early pregnancy peripheral blood global gene expression and PTD risk.
Methods: As part of a prospective study, ribonucleic acid was extracted from blood samples (collected at 16 weeks gestational age) from 14 women who had PTD (cases) and 16 women who delivered at term (controls). Gene expressions were measured using the GeneChip® Human
Genome U133 Plus 2.0 Array. Student's T-test and fold change analysis were used to identify differentially expressed genes. We used hierarchical clustering and principle components analysis to characterize signature gene expression patterns among cases and controls. Pathway and promoter sequence analyses were used to investigate functions and functional relationships as well as regulatory regions of differentially expressed genes.
Results: A total of 209 genes, including potential candidate genes (e.g. PTGDS, prostaglandin D2 synthase 21 kDa), were differentially expressed. A set of these genes achieved accurate pre-diagnostic separation of cases and controls. These genes participate in functions related to immune system and inflammation, organ development, metabolism (lipid, carbohydrate and amino acid) and cell signaling. Binding sites of putative transcription factors such as EGR1 (early growth response 1), TFAP2A (transcription factor AP2A), Sp1 (specificity protein 1) and Sp3 (specificity protein 3) were over represented in promoter regions of differentially expressed genes. Real-time PCR confirmed microarray expression measurements of selected genes.
Conclusions: PTD is associated with maternal early pregnancy peripheral blood gene expression changes. Maternal early pregnancy peripheral blood gene expression patterns may be useful for better understanding of PTD pathophysiology and PTD risk prediction.
Published: 10 December 2009
BMC Pregnancy and Childbirth 2009, 9:56 doi:10.1186/1471-2393-9-56
Received: 22 June 2009 Accepted: 10 December 2009
This article is available from: http://www.biomedcentral.com/1471-2393/9/56
© 2009 Enquobahrie et al; licensee BioMed Central Ltd.
Background
Preterm delivery (PTD) is a significant global public health problem affecting ~12-15% of all deliveries [1]. It is associated with greater risk of mortality and morbidity in infants and mothers and significant financial burden [2].
PTD is a complex cluster of problems associated with socio-economic, socio-demographic, socio-behavioral, environmental, medical, biological and genetic risk fac-tors [3-8]. A number of pathophysiological pathways including chronic systemic inflammation and infection, endothelial dysfunction, oxidative stress, placental ischemia and reperfusion and neuro-endocrine altera-tions have been identified to be associated with PTD [6,9,10].
Variations in a number of candidate genes (e.g. TNF-alpha, IL-1RA, IL4R, MMP9, MMP1, TLR4) have been identified in both human and experimental studies [1,2]. Due to the diverse pathopysiologic processes associated with PTD, single candidate gene profiles may not ade-quately portray the multitude of pathogenetic changes associated with PTD. In addition, substantial evidence has been described for contributions of gene-environment interactions to the incidence of PTD [11,12]. Since gene expressions are influenced by both genetic variations and environmental exposures, global gene expression profil-ing studies may help to generate testable hypothesis related to the role of genes across the genome and poten-tial gene-environment interactions in PTD.
Previous studies primarily evaluated gene expression on tissue, principally placenta collected after delivery [13-18]. Since evaluation of early pregnancy tissue changes on placenta in relation to PTD is associated with risk, most studies on placenta before delivery were experimental. Thus, inference on temporal relationships was limited. Peripheral blood gene expression profiling, which can be done at any point in pregnancy, is associated with mini-mal risk and has shown promising results in investiga-tions of other disease processes (such as cancer, cardiovascular diseases, and environmental health) [19-23]; and, could be applied to investigations of PTD.
Substantial evidence, including work from our group, supports the thesis that pathophysiologic changes, includ-ing system pathologies, leadinclud-ing up to PTD start early in pregnancy [24-26]. Evaluating early pregnancy peripheral blood genome-wide expression will help add to the prog-nostic value of traditional parameters, identify potential biological targets for prevention and treatment, improve discrimination of sub-groups in a complex pathology such as PTD and develop diagnostic tests.
In this pilot case control study, nested within an ongoing prospective study, we investigated early pregnancy periph-eral blood genome-wide gene-expression profiles of 14 women who had PTD and 16 women who had term deliv-ery. We evaluated transcriptional gene expression patterns associated with PTD in an effort to develop predictive tools for PTD. Functions and functional relationships of differentially expressed genes were investigated to better understand pathophysiologic processes underlying PTD. Finally, promoter sequences analysis was conducted to investigate whether common transcription factors could account for co-expression of genes associated with PTD.
Methods
Overview
In a pilot nested case control study among participants of an ongoing prospective cohort study, we investigated early pregnancy differential peripheral blood gene expres-sion among women who delivered preterm and controls who delivered at term.
Study population
approved by the Institutional Review Board of Swedish Medical Center. All participants provide written informed consent.
Data Collection
Information on risk factors was collected using in-person interviews, blood collection and medical records abstrac-tion. Following enrollment, in-person interviews were conducted to collect data on socio-demographic charac-teristics, occupation, reproductive and medical histories, alcohol and tobacco consumption, environmental tobacco smoke exposure, medications, height, weight, physical activity, and familial histories of medical condi-tions. At or near the time of in-person interviews (16 weeks of gestation on average), trained phlebotomists col-lected 2.5 mLs (in duplicates) of antepartum peripheral blood from each participant in PAXgene™ Blood RNA tubes, part of a PAXgene™ Blood RNA System (PAXgene Blood RNA Kit) (PreAnalytiX, Qiagen, Inc) [29]. The PAX-gene™ Blood RNA System enables consolidation of key steps of peripheral blood collection, nucleic acid stabiliza-tion and RNA purificastabiliza-tion to reduce RNA degradastabiliza-tion, inhibit or eliminate gene induction and make possible long-term storage of peripheral blood samples. Further, the system allows for multiple Blood RNA tube freeze-thaw cycles without affecting RNA yields. Samples were immediately aliquoted and stored at -80°C until RNA extraction and analysis. After delivery, trained personnel abstracted data from Omega participants' maternal and infant medical records to ascertain pregnancy outcomes.
Total RNA extraction
The PAXgene Blood RNA Kit (PreAnalytiX, Qiagen, Inc) was used for extraction and purification of total RNA from peripheral blood, according to manufacturers' protocols. The procedure, briefly, was as follows. Initial equilibra-tion of samples to room temperature for two hours was followed by centrifugation of cell lysates. The pellets were washed and resuspended in optimized buffers and incu-bated with proteinase K to bring about protein digestion. Centrifugations through the PAXgene Shredder spin col-umns were carried out to homogenize the cell lysate and remove residual cell debris. The supernatant of the flow-through fraction was then transferred to a fresh microcen-trifuge tube. Ethanol was added to adjust binding condi-tions and the lysate was applied to a PAXgene RNA spin column. During centrifugation, RNA was selectively bound to the PAXgene silica membrane as contaminants pass through. Remaining contaminants were removed in several efficient wash steps. Between wash steps, the silica-membrane is treated with DNase I to remove any residual DNA contaminants. After wash steps, pure RNA samples were eluted in a buffer, heat denatured at 65°C and immediately chilled on ice. Extracted RNA was stored at -80°.
RNA quantity measurement and quality control
Total RNA concentration was determined by ultraviolet absorbance at 260 nm (A260) by direct measurement (i.e non-diluted) on a NanoDrop ND1000 spectrophotome-ter (ThermoFisher Scientific, Wilmington, DE). Purity of RNA was assessed by evaluating readings at 260 nm and 280 nm (A260/A260) that provides an estimate of purity of
RNA with respect to contaminants that absorb UV, such as protein. All samples had A260/280 values greater than 2.0 indicating a high level of purity. Agilent 2100 Bioana-lyzer-based quality control criteria were also used to meas-ure RNA quality (Agilent Technologies Inc, Palo Alto, CA). The RNA Integrity Number (RIN), based on a 10 point scale, is an objective measure of total RNA quality and integrity based on several features of the RNA profile (including the fraction of the sample in the region of 18S and 28S RNA and the relative height of the 28S peak). One sample which had met the spectrophotometric QC criteria (A260/A280 = 2.04), had poor results on the bio-analyzer (RIN = 2.3) indicating a high level of RNA degra-dation and was therefore deemed to be of insufficient quality for gene expression measurement. Samples were then kept in frozen storage at -80°C. All RNA samples, including reference RNAs, underwent quality control checks and were labeled using the same standardized pro-tocols.
RNA amplification, fragmentation and labeling
All sample target preparations were conducted in accord-ance with the guidelines detailed in the technical manuals for the NuGEN™ Ovation™ Whole Blood Reagent and NuGEN™ Ovation™ RNA Amplification System V2 (amplification) in combination with the NuGEN™ FL-Ovation™ cDNA Biotin Module V2 (fragmentation and labeling). Briefly, these steps are described below.
combination with the Agilent Bioanalyzer. For the labe-ling step, 4.4 μg of amplified single-stranded cDNA was fragmented and labeled using the FL-Ovation™ cDNA Biotin Module V2. The enzymatically and chemically frag-mented product (50-100 nt) was labeled via the attach-ment of biotinylated nucleotides onto the 3'-end of the fragmented cDNA.
Hybridization, Washing and Staining
The resultant fragmented and labeled cDNA was added to the hybridization cocktail in accordance with the NuGEN and Affymetrix guidelines for hybridization onto
Affyme-trix Human Genome U133 Plus 2.0 GeneChip® Arrays
(Affymetrix, Sunnyvale, CA). This array platform offered a comprehensive coverage (comprised of more than 54,000 probe sets and 1,300,000 distinct oligonucelotide features representing over 47,000 transcripts and variants, includ-ing 38,500 well-characterized human genes) of the tran-scribed human genome on a single array. Following hybridization for 18 hours at 45°C, the arrays were
washed and stained on the GeneChip® Fluidics Station
450 (Affymetrix, Sunnyvale, CA) using the appropriate fluidics script, before being inserted into the Affymetrix
autoloader carousel and scanned using the GeneChip®
Scanner 3000 (Affymetrix, Sunnyvale, CA). All scanned array images were visually inspected for chip surface arti-facts that could adversely impact the data, and then data from each array was quantified using GeneChip®
Operat-ing Software (Affymetrix, Sunnyvale, CA). GCOS auto-matically acquires and analyzes image data, defines probe cells and computes an intensity value for each probe cell. These intensity values were pre-processed for analysis using quality control filters and normalization.
GeneChip quality controls and normalization
A number of quality control checks were conducted to evaluate GeneChip quality. First, background values (which can range from 20 to 100) of GeneArray scanners calibrated to the new PMT setting (10% of maximum) were assessed for comparability. Second, the GAPDH gene was used to assess RNA sample and assay quality specifi-cally for the GeneChip array. The signal values for the 3' probe set for GAPDH were compared to the 5' probe set. The ratio of the 3' to the 5'probe sets were expected to be no more than 3. Third, hybridization controls on the GeneChip array (four E. Coli genes, bioB, bioC and bioD and the cre gene) were spiked into each sample independ-ent of RNA sample preparation to evaluate hybridization efficiency. Fourth, raw noise (Q value), a measure of pixel-to-pixel variation of probe cells on a GeneChip array due to operation-associated electrical noise of the GeneArray scanner (unique to each scanner) was evaluated. Arrays that were scanned on the same scanner should ideally have comparable Raw Q values. Fifth, PolyA control genes, comprised of the dap, lys, phe, thr and trp genes from B. subtilis, were amplified and spiked into the RNA
samples prior to amplification to serve as internal control genes. Finally, data were normalized using an error-weighted model with Rosetta Resolver Error Models (Rosetta, Seattle, WA) [30]. In order to distinguish 'signal' and 'noise' intensity, background filtering was done by removing error model based "absent-called" sequences and those with intensity values lower than 2× standard deviations of chip background.
Real time quantitative polymerase chain reaction (RT-qPCR) experiment
A real time quantitative polymerase chain reaction (RT-qPCR) experiment was conducted to measure expression of nine selected genes that were differentially expressed in peripheral blood collected from women who delivered preterm as a confirmatory step of microarray based gene expression measures. In the first step, 1 μg total RNA from each of the 30 samples was reverse transcribed using the Transcriptor first strand cDNA synthesis kit (Roche Applied Science, Indianapolis, IN) according to manufac-turer's instructions. Briefly, 1 μl of anchored-oligo (dT) 18
primer (2.5 μM final concentration) was added to each
sample and heated at 65°C for 10 min and immediately cooled to 4°C. A mastermix was prepared on ice for all the samples with final concentrations of 1× Transcriptor reverse transcriptase reaction buffer (containing 8 mM MgCl2), 20 U of Protector RNase inhibitor, 1 mM each dNTP and 10 U of Transcriptor reverse transcriptase. The samples were mixed by pipetting and incubated in a ther-mocycler at 55°C for 30 min followed by 85°C for 5 min to inactivate the reverse transcriptase. Additional 4 sam-ples were selected from the 30 in which the Transcriptor reverse transcriptase was replaced by PCR grade water and used to perform reverse transcription negative control reactions. The concentration of each reverse transcription was determined spectrophotometrically and diluted to 40 ng/μl using PCR-grade water for use as template for qPCR. The qPCR reactions were performed using the Roche
LightCycler 480® Probes kit and the LightCycler 480®
instrument according to the Lightcycler 480® probes
mas-ter protocol. Pre-designed exon spanning Taqman® assays
for each gene target were obtained from Applied Biosys-tems (Foster City, CA).
Each individual assay was run on an individual 96-well plate in duplicate for each sample; and, 2 reverse tran-scription negative controls and 2 no template control wells were included with each assay. A mastermix was pre-pared for each assay on ice to enable a final reaction con-centration of 1× primer-probe mix and 1 Lightcycler 480®
Probes Master. Twelve μl of mastermix was dispensed into the appropriate wells of a Lightcycler 480® 96 well plate
for 10 min followed by 45 cycles of 95°C for 10 sec and annealing and extension at 60°C for 30 sec with fluores-cence captured following each extension step. Assay sensi-tivity, reproducibility and transcript concordance with microarray platforms and primer efficiency were assessed and assay optimization was carried out to achieve better sensitivity, specificity, reproducibility and a wider linear dynamic range.
Individual reactions were characterized by the PCR cycle at which fluorescence first rises above threshold back-ground fluorescence (the threshold cycle, Ct). The assay relies on fluorescence signal, which is proportional to the amount of DNA produced during each PCR cycle. This correlation between fluorescence and amount of ampli-fied DNA permits accurate quantification of target over a wide dynamic range, while retaining high sensitivity and specificity making this experiment useful as a confirma-tory tool for microarray gene expression measurements. Samples were processed simultaneously to avoid batch-to-batch variation. Normalization of expression measure-ments were done using three reference genes (RHOA, KHDRBS1 and BAT1) which were selected based on their non-variant gene expression in the microarray platform across cases and controls.
Data analysis
After data normalization, principle components analysis (PCA) was used to identify significant outliers based on expression measurements. Based on this analysis, one sample (PTD case), was identified as a significant outlier was removed from further analysis. Thus, for the final ana-lytic set included 14 PTD cases and 16 controls.
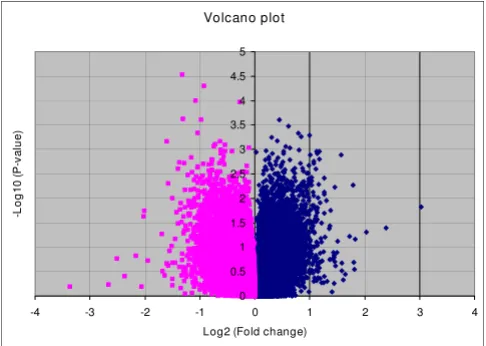
Fold change of comparison for each sequence across the two groups (cases and controls) based on normalized data together with Student's t-test (two sample, unequal vari-ances) were performed in order to identify differentially expressed genes. Volcano plot was used to depict distribu-tions of fold change (log2 [fold change]) for biological significance and Student's t-test p-values (-log10 [p-value]) for statistical significance. Genes that met cutoffs of absolute fold change differences ≥ 1.5 and Student's t-test (p-values < 0.05) constituted the set of differentially expressed genes associated with PTD. Two-Dimensional hierarchical clustering analysis (2-D), using Cluster and TreeView softwares that employ a hierarchical clustering approach based on Pearson's correlation coefficient and PCA techniques were used to evaluate whether differen-tially expressed genes cluster arrays into groups (PTD and term delivery groups) [31,32].
Relationships between differentially expressed genes were investigated in pathway analysis using Ingenuity Pathway
Analysis (IPA) software (Ingenuity, Redwood City, CA). In IPA, Ingenuity Pathways Knowledge Base (IPKB), a pub-lished and peer-reviewed database and computational algorithms will be used to identify local networks that are particularly enriched for the Network Eligible Genes, defined as genes in our list of differentially expressed genes with at least one previously defined connection to another gene in the IPKB. A score, that takes into account the number of Network Eligible Genes and the size of the networks, was calculated using a Fisher's exact test as the negative log of the probability that the genes within that network are associated by chance. Gene-enrichment of networks (network score), measured in IPA, using a mod-ified Fisher's exact test was used to rank biological signifi-cance of gene function networks in relation to PTD.
In exploratory analysis, we applied Partek's single-level cross-validation method (Partek® software, Partek Inc., St.
Louis, MO) using a portion of the samples in each group as training dataset to generate a candidate signature gene list, and tested them on the rest of the arrays as the testing dataset to evaluate if the gene list would correctly identify array's group.
Common regulatory sequences for the differentially expressed genes as well as their cognate regulators (tran-scription factors (TFs)) were searched using ConTra (con-served transcription factor binding sites, TFBs) and MAPPER. ConTra is a promoter alignment analysis tool for identification of transcription factor binding sites across species. MAPPER (multi-genome analysis of posi-tions and patterns of elements of regulation) is a platform for the computational identification of transcription fac-tor binding sites (TFBSs) in multiple genomes which uses an innovative technique that combines TRANSFAC and JASPAR data with the search power of profile hidden Markov models. Since genes with similar expression pro-files are likely to encode interacting proteins, we also eval-uated protein-protein interactions (PPI) using Cytoprophet, a Cystoscape plug-in for protein and domain interaction network inference and results of our gene expression study (protein counterparts of differen-tially expressed genes) [33].
Primer EfficiencyΔΔCt. True fold change was represented by
the following: if FC > 1, true fold change = FC; if FC< 1, true fold change = -1/FC.
Results
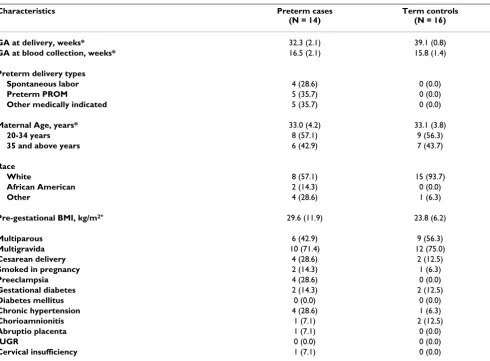
In this study, we investigated 14 PTD cases and 16 con-trols (Table 1). Blood was collected at 16 weeks of gesta-tion, on average, comparably between cases and controls. A third of PTD cases followed spontaneous onset of labor while a third each followed preterm rupture of membrane and medically indicated labor induction and/or Cesarean delivery. Most study participants were white. Higher rates of preeclampsia, and chronic hypertension as well as smoking during the current pregnancy were observed for PTD cases compared with controls. PTD cases had also higher pre-pregnancy body mass index (BMI) compared with term controls.
A volcano plot that demonstrates the Student's t-test based p-value and fold change differences in gene
expres-sion between the 14 PTD cases and 16 controls is shown in Figure 1. There are a total of ~47,400 probe sets (tran-scripts) representing >38,500 genes on the GeneChip. Of these, 1579 probe sets representing 209 genes were up or down regulated (99 up regulated and 110 down regu-lated) in PTD cases using the criteria of p-value < 0.05 and absolute fold change > 1.5 (Additional File 1). The result-ing gene list included strong candidate genes such as LOC442421, a gene similar to prostaglandin E receptor 4, prolactin, Protein C, cystathionine-beta-synthase, tumor necrosis factor receptor superfamily, member 13B, and FLT1 as well as a number of novel genes with potential sig-nificance such as TEX1 (testis expressed gene 1), Transge-lin and methylthioadenosine phosphorylase.
PCA using these 209 genes and the 30 arrays was able to clearly separate the two groups of PTD cases and term delivery controls (Figure 2). Similarly, in the 2-D cluster-ing analysis, as shown in the heat map in Figure 3, the 209 differentially expressed genes grouped most of cases and
Table 1: Characteristics of study population
Characteristics Preterm cases
(N = 14)
Term controls (N = 16)
GA at delivery, weeks* 32.3 (2.1) 39.1 (0.8)
GA at blood collection, weeks* 16.5 (2.1) 15.8 (1.4)
Preterm delivery types
Spontaneous labor 4 (28.6) 0 (0.0)
Preterm PROM 5 (35.7) 0 (0.0)
Other medically indicated 5 (35.7) 0 (0.0)
Maternal Age, years* 33.0 (4.2) 33.1 (3.8)
20-34 years 8 (57.1) 9 (56.3)
35 and above years 6 (42.9) 7 (43.7)
Race
White 8 (57.1) 15 (93.7)
African American 2 (14.3) 0 (0.0)
Other 4 (28.6) 1 (6.3)
Pre-gestational BMI, kg/m2* 29.6 (11.9) 23.8 (6.2)
Multiparous 6 (42.9) 9 (56.3)
Multigravida 10 (71.4) 12 (75.0)
Cesarean delivery 4 (28.6) 2 (12.5)
Smoked in pregnancy 2 (14.3) 1 (6.3)
Preeclampsia 4 (28.6) 0 (0.0)
Gestational diabetes 2 (14.3) 2 (12.5)
Diabetes mellitus 0 (0.0) 0 (0.0)
Chronic hypertension 4 (28.6) 1 (6.3)
Chorioamnionitis 1 (7.1) 2 (12.5)
Abruptio placenta 1 (7.1) 0 (0.0)
IUGR 0 (0.0) 0 (0.0)
Cervical insufficiency 1 (7.1) 0 (0.0)
*Mean, otherwise n (%)
Abbreviations: GA: gestational age, PROM: premature rupture of membrane, IUGR: intrauterine growth retardation, BMI: body mass index; kg/m2:
controls separately. In the exploratory analysis using Partek's automated model selection method, overall, 1-level cross validation rates based on over 10 testing sets were between 65-69%. In other words, a gene list gener-ated from each training dataset gave a correct prediction rate of around 65-69% (about two out of three).
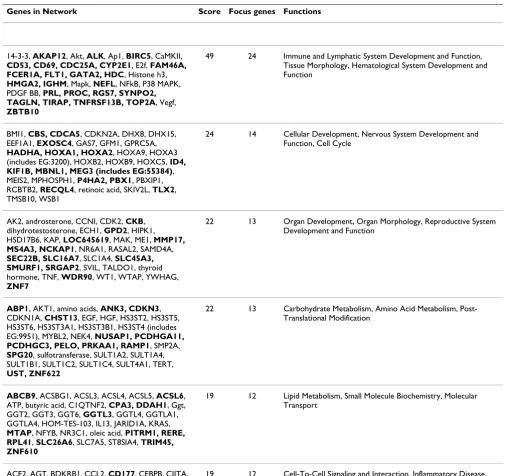
Results from functions and functional relationships of the differentially expressed genes using IPA are shown in Table 2 and Additional Files 2, 3, 4, 5, 6 and 7. Genes in our list of differentially expressed genes over represented six networks. The top network (Score = 49) as well as another network among significantly represented net-works (Score = 19) has functions in the immune system and inflammation, lymphatic system, tissue morphology and hematological system development and function. Other networks that were also well represented included those related to development (cellular and organ develop-ment involving the nervous system, reproductive system and cardiovascular system) and metabolism (lipid, carbo-hydrate and amino acid). In addition, networks in the IPA analysis provide supportive evidence for genes such as NFKB, P38MAPK, Mapk, Akt, Vegf, retinoic acid, HOXA9, TNF, dihydrotestosterone, thyroid hormone, CDKNA1, sulfotransferase, Ggt, Oleic acid, progesterone, CCL2 and KNG which were not differentially expressed in our data set but could play significant roles in PTD.
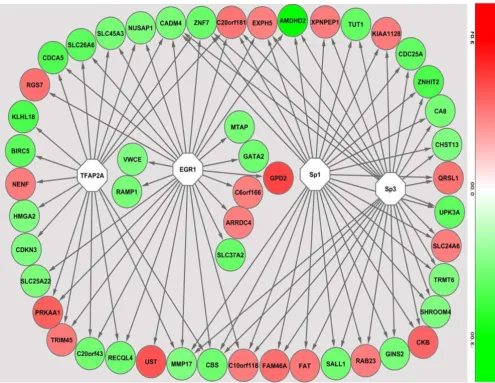
In the promoter analysis, a number of common regulatory sequences, motifs, were identified. These sequences corre-sponded to binding sites of transcription factors TFAP2A (transcription factor AP2A), EGR1 (early growth response factor 1), Sp1 (specificity protein 1) and Sp3 (specificity
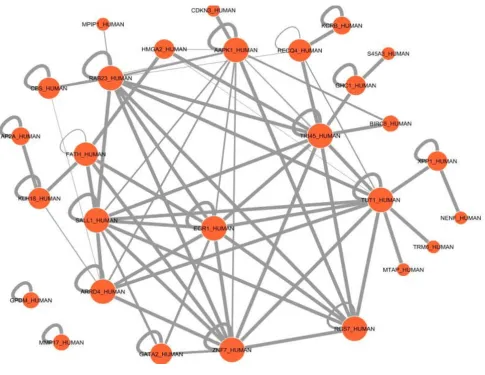
protein 3) on genes that were differentially expressed in PTD cases compared to controls (Figure 4). In the pre-dicted protein domain interaction analysis based on our gene expression results, evidence for significant interac-tions of the EGR1 protein domain with other putative protein domains is presented (Figure 5). Further, several protein domains of potential importance in PTD were identified such as TR145 and TUT1.
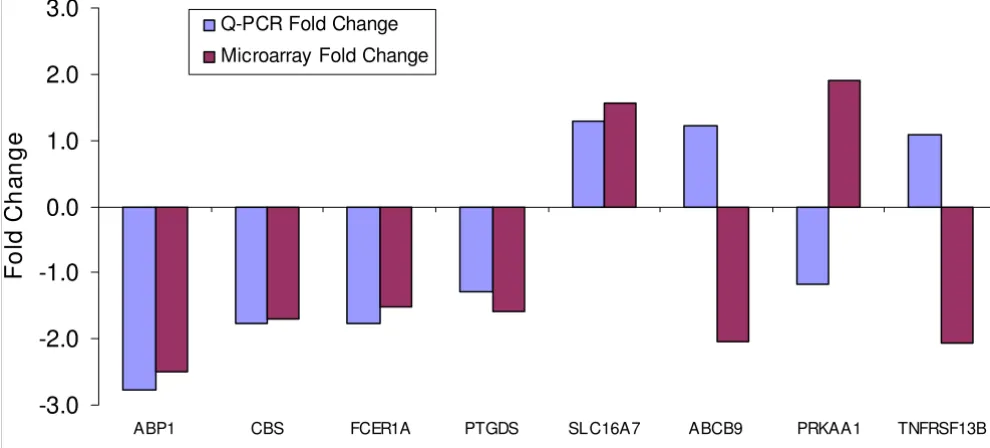
In the confirmatory RT-qPCR experiment, expressions of nine genes (ABCB9, ABP1, CBS, FCER1A, PRKAA1, PTGDS, SLC16A7, TNFRSF13B and QRSL1) differentially expressed in PTD cases in the microarray experiment were evaluated. Three housekeeping genes (RHOA, KHDRBS1 and BAT1) were used in the experiment. For six of the nine genes, similar fold change differences and were observed between microarray and RT-qPCR expression measure-ments for an overall concordance rate of about 67% (Fig-ure 6).
Discussion
In this study, we show that early pregnancy peripheral blood gene expression is associated with PTD. Differen-tially expressed genes participate in diverse cellular path-ways including immune function, inflammation, organ development, hematological system, metabolism and cell signaling underscoring the different pathophysiologic processes leading to PTD. Further, binding sites for tran-scription factors, EGR1, TFAP2A, Sp1 and Sp3 were over-represented in promoter sequences of differentially expressed genes, potentially accounting for observed co-expressions.
Several pathophysiological mechanisms contribute to the occurrence of PTD following spontaneous preterm labor, PPROM or other medically indicated PTD. These include inflammation and infection, hormonal deregulation, decidual hemorrhage, uterine over-distension as well as local cervical abnormalities [34-39]. Previous uterine and cervical gene expression studies, mostly experimental, have shown that labor is associated with up/down regula-tion of genes involved in chemokine/cytokine activaregula-tion, signal transduction, acute phase response, growth-differ-entiation, adhesion, extracellular matrix remodeling, con-traction (calcium signaling, ion channels), complement and coagulation cascades, kinases, VEGF-family signaling, arginine and proline metabolism and apoptosis [35-39]. In the current study, supportive evidence for differential expression of genes participating in similar pathways in peripheral blood (e.g. FLT1) in early pregnancy is pre-sented.
Proinflammatory cytokines and immune related chemok-ines stimulate prostaglandin production and uterine con-traction through mechanisms that involve cycloxygenase-Volcano plot of gene expression differences between cases
and controls
Figure 1
2 [34,40,41]. They act on cervical smooth muscles enhancing cervical ripening, activate matrix metallopro-teinasess expression; and, increase protease production leading to extracellular matrix degradation, related cervi-cal changes and premature rupture of membrane [34,40,41]. Both term and preterm labor are associated with a reduction in the percentage of monocytes express-ing MHC class II depictexpress-ing a pattern referred to as "mono-cyte hyporesponsiveness" or "immune paresis" [42]. HLA-DOB that suppresses peptide loading of MHC class II mol-ecules by inhibiting HLA-DM, was upregulated in our study. Several other genes participating in immune func-tion and inflammafunc-tion (such as LILRB5, TIRAP, CD69 and CD53) were up regulated in our study.
Hormonal dysregulation (related to progesterone, pros-taglandins and prolactin) has been associated with PTD. Progesterone withdrawal or a progestin-resistant environ-ment may precede preterm labor [40]. Prostaglandin sub-types (E and F), released by the membranes in response to stretch and actions of pro-inflammatory cytokines, act not only upon the myometrium and cervix, but may also exert paracrine/autocrine effects on cell viability and matrix protein integrity [41]. On the other hand, other
prostag-landins (such as subtype D) have roles in pregnancy maintenance [43]. LOC442421, a gene coding for a pro-tein similar to the prostaglandin E4 receptor was up regu-lated in the current study. Further, PTGDS, a gene coding prostaglandin D2 synthase was down regulated in our study. The progesterone responsiveness of prostaglandin receptors is in part regulated by transcription factors belonging to the class of homeobox genes [40]. HOXA1, a previously described breast cancer related gene [44] that belongs to this class, was down regulated in our study. The PRL gene coding for prolactin, a growth hormone associ-ated with lactation and that has been suggested for use in PTD prediction from cervicovaginal washings [45], was down regulated in our study.
PTD is frequently associated with abruption and/or decid-ual hemorrhage. These events result in intense local thrombin generation, binding to protease activated recep-tor-1 to stimulate decidual protease production promot-ing rupture of membranes and myometrial contractions to induce PTD [41]. Genes participating in the coagula-tion cascade including PROC and VWCE were differen-tially expressed in peripheral blood in our study.
Principal component analyses
Figure 2
Cervical remodeling (including softening, ripening, dila-tion and labor) associated with PTD is related to collagen solubility [46-49]. Since, cervix is composed of extracellu-lar matrix components such as collagen, elastin, prote-oglycans and others, systemic effects can influence cervical remodeling [46,47]. Fortunato et al demonstrated an increased mRNA expression for MMP2, MMP9, and MT1-MMP and a decreased expression for TIMP2 in prema-turely ruptured membranes [48]. Suggestions for further studies to determine steps in collagen synthesis, cross-linking and fibril assembly that may be altered in early pregnancy have been put forth [47]. Our study has identi-fied a number of potential genes such as COL23A1, P4HA2, participating in collagen metabolism and up reg-ulated in peripheral blood in early pregnancy. Myometrial activation leading to PTD may result from the coordinated expression of a cassette of contraction-associated proteins that include ion channels (calcium and potassium), ago-nist receptors (i.e. oxytocin and prostaglandin) and gap junctions [50,51]. A number of genes involved in ion
channel function regulation (S100A5, SLC24A6, KCNMB4, KCNH2 and ABP1) were differentially expressed in our study.
Labor involves a number of interacting pathomechanisms that are integrated by various regulatory mechanisms involving upstream regulators and/or transcription factors [52]. These regulators include a) basic domains (e.g. AP-1, cAMP, CRE) b) zinc coordinating DNA binding domains (e.g. SP1 and nuclear factors such as PPAR) c) homeo-domain transcription factors and d) beta-scaffold tran-scription factors (e.g. NFAT, NFKB and STAT) [52]. For instance, NFKB regulates functional progesterone with-drawal, pro-labor mediators such as cytokines, phosphol-ipid metabolites and release of ECM remodeling enzymes [52]. In our study, direct (e.g. GATA2) and indirect (in pathway analysis, e.g. NFKB) evidence for involvement of these regulatory transcription factors in PTD is presented. For instance strong evidence for role of EGR1, from both promoter analysis and protein-protein-domain interac-Heat map illustration of samples and selected differentially expressed genes
Figure 3
Table 2: Gene networks* overrepresented by differentially expressed genes associated with preterm delivery
Genes in Network Score Focus genes Functions
14-3-3, AKAP12, Akt, ALK, Ap1, BIRC5, CaMKII,
CD53, CD69, CDC25A, CYP2E1, E2f, FAM46A, FCER1A, FLT1, GATA2, HDC, Histone h3,
HMGA2, IGHM, Mapk, NEFL, NFkB, P38 MAPK, PDGF BB, PRL, PROC, RGS7, SYNPO2, TAGLN, TIRAP, TNFRSF13B, TOP2A, Vegf,
ZBTB10
49 24 Immune and Lymphatic System Development and Function,
Tissue Morphology, Hematological System Development and Function
BMI1, CBS, CDCA5, CDKN2A, DHX8, DHX15, EEF1A1, EXOSC4, GAS7, GFM1, GPRC5A,
HADHA, HOXA1, HOXA2, HOXA9, HOXA3 (includes EG:3200), HOXB2, HOXB9, HOXC5, ID4, KIF1B, MBNL1, MEG3 (includes EG:55384), MEIS2, MPHOSPH1, P4HA2, PBX1, PBXIP1, RCBTB2, RECQL4, retinoic acid, SKIV2L, TLX2, TMSB10, WSB1
24 14 Cellular Development, Nervous System Development and
Function, Cell Cycle
AK2, androsterone, CCNI, CDK2, CKB, dihydrotestosterone, ECH1, GPD2, HIPK1, HSD17B6, KAP, LOC645619, MAK, ME1, MMP17, MS4A3, NCKAP1, NR6A1, RASAL2, SAMD4A,
SEC22B, SLC16A7, SLC1A4, SLC45A3, SMURF1, SRGAP2, SVIL, TALDO1, thyroid hormone, TNF, WDR90, WT1, WTAP, YWHAG,
ZNF7
22 13 Organ Development, Organ Morphology, Reproductive System
Development and Function
ABP1, AKT1, amino acids, ANK3, CDKN3, CDKN1A, CHST13, EGF, HGF, HS3ST2, HS3ST5, HS3ST6, HS3ST3A1, HS3ST3B1, HS3ST4 (includes EG:9951), MYBL2, NEK4, NUSAP1, PCDHGA11, PCDHGC3, PELO, PRKAA1, RAMP1, SMP2A,
SPG20, sulfotransferase, SULT1A2, SULT1A4, SULT1B1, SULT1C2, SULT1C4, SULT4A1, TERT,
UST, ZNF622
22 13 Carbohydrate Metabolism, Amino Acid Metabolism,
Post-Translational Modification
ABCB9, ACSBG1, ACSL3, ACSL4, ACSL5, ACSL6, ATP, butyric acid, C1QTNF2, CPA3, DDAH1, Ggt, GGT2, GGT3, GGT6, GGTL3, GGTL4, GGTLA1, GGTLA4, HOM-TES-103, IL13, JARID1A, KRAS,
MTAP, NFYB, NR3C1, oleic acid, PITRM1, RERE, RPL41, SLC26A6, SLC7A5, ST8SIA4, TRIM45, ZNF610
19 12 Lipid Metabolism, Small Molecule Biochemistry, Molecular Transport
ACE2, AGT, BDKRB1, CCL2, CD177, CEBPB, CIITA,
CRYBB2, CSF3, DARC, EMR1, ENPEP, EP300, HDAC1 (includes EG:3065), HLA-DOA, HLA-DOB, HLA-DQB1, HOPX, HP, IK, INMT, KNG1 (includes EG:3827), LPP, MCOLN2, MSH5, NAP1L1, PFKFB3, progesterone, PTGDS, RFXAP, RRM2, SALL1, SERBP1, TMEM176A, XPNPEP1
19 12 Cell-To-Cell Signaling and Interaction, Inflammatory Disease, Cardiovascular System Development and Function
*The networks were generated through the use of Ingenuity Pathways Analysis (Ingenuity® Systems, http://www.ingenuity.com). Each gene identifier
tion analysis, supporting previous reports [38], is pre-sented. EGR1 can be a potential target for enhancing preventive, early prediction or therapeutic efforts in PTD.
Previous gene expression studies investigating preterm labor and delivery were conducted on cervical and uterine tissue, mostly post partum under experimental settings. While evidence for changes in gene expression preceding clinical signs of labor have been put forward [51], to our knowledge, we are not aware of any "published study" that investigated gene expression in peripheral blood in early pregnancy to predict PTD. The timing of activation of each cascade of activities related to PTD [37] is not clear. Our study provides hypothesis-generating evidence for PTD risk factors and their interactions, particularly for those involving systemic processes. While PTD remains a
significant public health problem, methodological limita-tions have hindered research in this area. Development of methods utilizing use of peripheral blood for investigat-ing risk factors of PTD has great potential in understand-ing pathophysiologic pathways and predictive applications [53]. Other strengths of our study include the following. First, the study was conducted nested within a larger well-characterized prospective pregnancy cohort. Second, we used appropriate measures to collect and sta-bilize maternal antepartum peripheral blood samples for isolating high quality pure mRNA. Third, we conducted extensive evaluation of differentially expressed genes using pathway, promoter and protein-protein-domain interaction analysis using powerful statistical and bioin-formatics tools to gain insights into processes underlying the pathophysiology of PTD.
Promoter analysis results of differentially expressed genes
Figure 4
Several potential limitations of our pilot study deserve mention. First, single measurement of peripheral blood gene expression may not provide a full picture of the gene expression changes associated with PTD. Second, since PTD is associated with a set of diverse pathological condi-tions, some of the observed changes may be related to the disease conditions and not to PTD specifically. Third, we may not have enough power to assess all expression changes associated with PTD. In absence of previous pilots for gene expression variations in PTD, we were not able to assess the statistical power of our study. Fourth, while we have frequency matched cases and controls for maternal age, and gestational age at blood draw, residual confounding by these variables or uncontrolled con-founding by others (e.g. race) may account for these gene
expression differences. Fifth, inter-individual variability of gene expression in peripheral blood related to differences in cellular constituency of collected samples may account for differences. Finally, since we are evaluating early preg-nancy changes, most of our findings in gene expression changes are likely to identify systemic disease processes that start early in pregnancy and are associated with PTD. Nevertheless, given the substantial burden of PTD and the concordance of our findings with other cross sectional studies, our preliminary findings, if confirmed, are likely to have strong clinical and public health relevance.
In the confirmatory RT-qPCR experiment, 3 of the 9 genes (ABCB9, PRKAA1 and TNFRSF1) we evaluated did not have concordant expression measures with the microarray Protein domain interactions of differentially expressed genes
Figure 5
Protein domain interactions of differentially expressed genes. Predicted domain interactions of differentially
experiment. We investigated potential reasons (primer efficiencies, splice variants, choice of calibrator genes for normalization) for this discordance. Including primer efficiencies in recalculation of fold change differences did not improve the discordance. Of the three genes, one, PRKAA, had an Affymetrix target region located in a non-overlapping region with the ABI assay primer set. How-ever, no information could be found in the public sequence or published domain for evidence of PRKAA splice variants. Further in-depth sequence analysis is needed to investigate this lack of overlap which may account for the discordance. Choice of alternative house-keeping genes (KHDRBS1 and BAT1) did not improve the concordance. The concordance observed in our study (67%) is comparable to the concordance from other pub-lished microarray studies, given the small number of genes assessed (nine). For example, two previous studies reported confirmation of 70% to 75% of gene expression trends determined by cDNA microarray analysis using real-time RT-PCR [54,55].
In summary, we have shown that PTD is associated with maternal early pregnancy blood gene expression changes. Maternal early pregnancy peripheral blood gene expres-sion patterns may be useful for better understanding of the pathophysiology of PTD and risk prediction. Further-more, since evaluating gene expression of peripheral blood in early pregnancy is practical, knowledge and experience gained from this area of research may allow for similar applications in other pregnancy disorders.
Conclusion
Early pregnancy peripheral blood gene expression is asso-ciated with PTD. Differentially expressed genes participate in diverse cellular pathways including immune function, inflammation, organ development, hematological sys-tem, metabolism and cell signaling underscoring the dif-ferent pathophysiologic processes leading to PTD. Further, binding sites for transcription factors, EGR1, TFAP2A, Sp1 and Sp3 were overrepresented in promoter sequences of differentially expressed genes, potentially accounting for observed co-expressions. Maternal early pregnancy blood gene expression patterns may be useful for better understanding of PTD pathophysiology and PTD risk prediction.
Competing interests
A patent application, related to study findings reported in this manuscript, "Preterm delivery diagnostic assay (Wil-liams MA and Enquobahrie DA" (Application No: 61049709, Filed, May 1, 2008) is pending. All authors declare that they have no other competing interests.
Authors' contributions
Each author participated actively and sufficiently in study design (MW, DE, TS and CQ), data acquisition (MW, CQ, KS and ZG), data analysis (DE, CQ, SM, KS and ZG), data interpretation (all) and manuscript preparation (all). All authors have read and approved the submission of the final manuscript.
Fold changes of selected genes in microarray and RT-QPCR experiments
Figure 6
Fold changes of selected genes in microarray and RT-QPCR experiments.
-3.0
-2.0
-1.0
0.0
1.0
2.0
3.0
ABP1 CBS FCER1A PTGDS SLC16A7 ABCB9 PRKAA1 TNFRSF13B
F
o
ld C
ha
nge
Q-PCR Fold Change
Additional material
Acknowledgements
The authors are indebted to participants of the Omega study for their cooperation. They are also grateful for the expertise of The Center for Perinatal Studies, Swedish Medical Center staff; and, the staff of Almac Diag-nostics. This study was supported in part by a grant from the National Insti-tute of Child Health and Development, National InstiInsti-tutes of Health, NICHD/NIH (HD R01-32562). The funding agency had no role in study design, data collection and analysis, decision to publish, or preparation of the manuscript.
References
1. Pennell CE, Jacobsson B, Williams SM, Buus R, Muglia LJ, Dolan SM, Morken NH, Ozcelik H, Lye SJ, PREBIC Genetics Working Group, Relton C: Genetic epidemiologic studies of preterm birth: guidelines for research. Am J Obstet Gynecol 2007,
196(2):107-118.
2. Behrman RE, Butler AS: Preterm Birth: Causes, Consequences, and Pre-vention Washington DC: The National Academies Press; 2006. 3. Adams MM, Elam-Evans LD, Eilson HG, Gilbertz DA: Rates of and
factors associated with recurrence of preterm delivery. JAMA
2000, 283(12):1591-1596.
4. Bakketeig LS, Hoffman HJ: Epidemiology of preterm birth: results from a longitudinal study of births in Norway. In Pre-term Labor Edited by: Elder MG, Hendricks CH. London: Butterworth; 1981:17-46.
5. Clausson B, Lichtenstein P, Cnattingus S: Genetic influence on birth weights and gestational length determined by studies in offspring of twins. BJOG 2000, 107(3):375-381.
6. Esplin MS: Preterm birth: A review of genetic factors and future directions for genetic studies. Obstet Gynecol Survey 2006,
61(12):800-806.
7. Winkvist A, Mogren I, Hogberg U: Familial patterns in birth char-acteristics: impact on individual and population risks. Intl J Epidemiol 1998, 27(2):248-254.
8. McManemy J, Cooke E, Amon E, Leet T: Recurrence risk for pre-term delivery. Am J Obstet Gynecol 2007, 196(6):e1-6.
Additional file 1
Selected differentially* expressed genes in early pregnancy blood among women who delivered preterm. Selected genes differentially expressed in whole blood among women destined to deliver preterm in order of fold change values (fold), P-value: Students' t-test p-value. Click here for file
[http://www.biomedcentral.com/content/supplementary/1471-2393-9-56-S1.DOC]
Additional file 2
Network 1 identified in Ingenuity Pathway Analysis. The networks were generated through the use of Ingenuity Pathways Analysis (Ingenu-ity® Systems, http://www.ingenuity.com). Each gene identifier was mapped to its corresponding gene object in the Ingenuity Pathways Knowl-edge Base (IPKB) and overlaid onto a global molecular network developed from information contained in the IPKB. Colored genes are genes in our set of differentially expressed genes.
Click here for file
[http://www.biomedcentral.com/content/supplementary/1471-2393-9-56-S2.DOC]
Additional file 3
Network 2 identified in Ingenuity Pathway Analysis. The networks were generated through the use of Ingenuity Pathways Analysis (Ingenu-ity® Systems, http://www.ingenuity.com). Each gene identifier was mapped to its corresponding gene object in the Ingenuity Pathways Knowl-edge Base (IPKB) and overlaid onto a global molecular network developed from information contained in the IPKB. Colored genes are genes in our set of differentially expressed genes.
Click here for file
[http://www.biomedcentral.com/content/supplementary/1471-2393-9-56-S3.DOC]
Additional file 4
Network 3 identified in Ingenuity Pathway Analysis. The networks were generated through the use of Ingenuity Pathways Analysis (Ingenu-ity® Systems, http://www.ingenuity.com). Each gene identifier was mapped to its corresponding gene object in the Ingenuity Pathways Knowl-edge Base (IPKB) and overlaid onto a global molecular network developed from information contained in the IPKB. Colored genes are genes in our set of differentially expressed genes.
Click here for file
[http://www.biomedcentral.com/content/supplementary/1471-2393-9-56-S4.DOC]
Additional file 5
Network 4 identified in Ingenuity Pathway Analysis. The networks were generated through the use of Ingenuity Pathways Analysis (Ingenu-ity® Systems, http://www.ingenuity.com). Each gene identifier was mapped to its corresponding gene object in the Ingenuity Pathways Knowl-edge Base (IPKB) and overlaid onto a global molecular network developed from information contained in the IPKB. Colored genes are genes in our set of differentially expressed genes.
Click here for file
[http://www.biomedcentral.com/content/supplementary/1471-2393-9-56-S5.DOC]
Additional file 6
Network 5 identified in Ingenuity Pathway Analysis. The networks were generated through the use of Ingenuity Pathways Analysis (Ingenu-ity® Systems, http://www.ingenuity.com). Each gene identifier was mapped to its corresponding gene object in the Ingenuity Pathways Knowl-edge Base (IPKB) and overlaid onto a global molecular network developed from information contained in the IPKB. Colored genes are genes in our set of differentially expressed genes.
Click here for file
[http://www.biomedcentral.com/content/supplementary/1471-2393-9-56-S6.DOC]
Additional file 7
Network 6 identified in Ingenuity Pathway Analysis. The networks were generated through the use of Ingenuity Pathways Analysis (Ingenu-ity® Systems, http://www.ingenuity.com). Each gene identifier was mapped to its corresponding gene object in the Ingenuity Pathways Knowl-edge Base (IPKB) and overlaid onto a global molecular network developed from information contained in the IPKB. Colored genes are genes in our set of differentially expressed genes.
Click here for file
9. Goldenberg RL, Andrews WW, Hauth JC: Choriodecidual infec-tion and preterm birth. Nutr Rev 2002, 60:S19-S25.
10. Varner MW, Esplin S: Current understanding of genetic factors in preterm birth. BJOG 2005, 112(Suppl):28-31.
11. Macones GA, Parry S, Elkosu M, Clothier B, Ural SH, Strauss JF: A polymorphisms in the promoter region of TNF and bacterial vaginosis: preliminary evidence of gene-environment inter-action in the etiology of spontaneous preterm birth. Am J Obstet Gynecol 2004, 190(6):1504-1508.
12. Nukui T, Day RD, Sims CS, Ness RB, Romkes M: Maternal/new-born GSTT1 null genotype contributes to risk of preterm delivery, low birthweight infants. Pharmacogenetics 2004,
14(9):569-576.
13. Romero R, Espinoza J, Gotsch F, Kusanovic JP, Friel LA, Erez O, Maz-aki-Tovi S, Than NG, Hassan S, Tromp G: The use of high-dimen-sional biology (genomics, transcriptomics, proteomics, and metabolomics) to understand the preterm parturition syn-drome. BJOG 2006, 113(Suppl 3):118-135.
14. Aguan K, Carvajal JA, Thompson LP, Weiner CP: Application of a functional genomics approach to identify differentially expressed genes in human myometrium during pregnancy and labour. Mol Hum Repro 2000, 6(12):1141-1145.
15. Dizon-Townson DS, Lu J, Morgan TK, Ward KJ: Genetic expres-sion by fetal chorionic villi during the first trimester of human gestation. Am J Obstet Gynecol 2000, 183(3):706-711. 16. Esplin MS, Fausett MB, Peltier M, Hamblin S, Silver RM, Branch DW,
Adashi EY, Whiting D: The use of cDNA microarray to identify differentially-expressed labor-specific genes within human myometrium. Am Obstet Gynecol 2005, 193(2):303-313. 17. Haddad R, Tromp G, Kuivaniemi H, Chaiworapongsa T, Kim YM,
Mazor M, Romero R: Human spontaneous labor without histo-logic chorioamnionitis is characterized by an acute inflam-mation gene expression signature. Am J Obstet Gynecol 2006,
195(2):394e1-e24.
18. Tromp G, Kuivaniemi H, Romero R, Chaiworapongsa T, Kim YM, Kim MR, Maymon E, Edwin S: Genome-wide expression profiling of fetal membranes reveals a deficient expression of proteinase inhibitor 3 in premature rupture of membranes. Am J Obstet Gynecol 2004, 191(4):1331-1338.
19. Lossos IS, Czerwinski DK, Alizadeh AA, Wechser MA, Tibshirani R, Botstein D, Levy R: Prediction of survival in diffuse large-b-cell lymphoma based on the expression of six genes. N Engl J Med
2004, 350(18):1828-1837.
20. Sharma P, Sahni NS, Tibshirani R, Skaane P, Urdal P, Berghagen H, Jensen M, Kristiansen L, Moen C, Sharma P, Zaka A, Arnes J, Sauer T, Akslen LA, Schlichting E, Børresen-Dale AL, Lönneborg A: Early detection of breast cancer based on gene-expression pat-terns in peripheral blood cells. Breast Cancer Res 2005,
7(5):R634-R644.
21. Valk PJ, Verhaak RG, Beijen MA, Erpelinck CA, Barjesteh van Waalw-ijk van Doorn-Khosrovani S, Boer JM, Beverloo HB, Moorhouse MJ, Spek PJ van der, Löwenberg B, Delwel R: Prognostically useful gene-expression profiles in acute myeloid leukemia. N Engl J Med350(16):1617-1628.
22. Lampe JW, Stepaniants SB, Mao M, Radich JP, Dai H, Linsley PS, Friend SH, Potter JD: Signatures of environmental exposures using peripheral leukocyte gene expression: tobacco smoke. Can-cer Epidemiol Biomarkers Prev 2004, 13(3):445-453.
23. Wang Z, Neuburg D, Li C, Su L, Kim JY, Chen JC, Christiani DC: Glo-bal gene expression profiling in whole-blood samples from individuals exposed to metal fumes. Environ Health Perspect
2005, 113(2):233-241.
24. De B, Lin S, Lohsoonthorn V, Williams MA: Risk of preterm deliv-ery in relation to maternal low birth weight. Acta Obstet Gyne-col Scand 2007, 86(5):565-571.
25. Hossain R, Harris T, Lohsoonthorn V, Williams MA: Risk of pre-term delivery in relation to vaginal bleeding in early preg-nancy. Eur J Obstet Gynecol Reprod Biol 2007, 135(2):158-163. 26. Lohsoonthorn V, Qiu C, Williams MA: Maternal serum
C-reac-tive protein concentrations in early pregnancy and subse-quent risk of preterm delivery. Clin Biochem 2007, 40(5-6):330-335.
27. Thompson ML, Miller RS, Williams MA: Construction and charac-terization of a longitudinal clinical blood pressure database for epidemiological studies of hypertension in pregnancy.
Paediatr Perinat Epidemiol 2007, 21(6):477-486.
28. Rudra CB, Frederick IO, Williams MA: Pre-pregnancy body mass index and weight gain during pregnancy in relation to pre-term delivery subtypes. Acta Obstet Gynecol Scand 2008,
87(5):510-517.
29. Rainen L, Oelmueller U, Jurgensen S, Wyrich R, Ballas C, Schram J, Herdman C, Bankaitis-Davis D, Nicholls N, Trollinger D, Tryon V:
Stabilization of mRNA expression in whole blood samples.
Clin Chem 2002, 48(11):1883-1890.
30. Weng L, Dai H, Zhan Y, He Y, Stepaniants SB, Bassett DE: Rosetta error model for gene expression analysis. Bioinformatics 2006,
22(9):1111-1121.
31. Eisen MB, Spellman PT, Brown PO, Botstein D: Cluster analysis and display of genome-wide expression patterns. Proc Natl Acad Sci USA 1998, 95(25):14863-14868.
32. Yeung KY, Ruzzo WL: Principal component analysis for cluster-ing gene expression data. Bioinformatics 2001, 17(9):763-774. 33. Morcos F, Lamanna C, Sikora M, Izaguirre J: Cytoprophet: a
Cyto-scape plug-in for protein and domain interaction networks inference. Bioinformatics 2008, 24(19):2265-2266.
34. Nesin M: Genetic basis of preterm birth. Front Biosci 2007,
12:115-24.
35. Breuiller-Fouche M, Charpigny G, Germain G: Functional genom-ics of the pregnant uterus: from expectations to reality, a compilation of studies in the myometrium. BMC Pregnancy Childbirth 2007, 7(S1):S4. (doi:10.1186/1471-2393-7-S1-S4) 36. Charpigny G, Leroy MJ, Breuiller-Fouché M, Tanfin Z, Mhaouty-Kodja
S: A functional genomic study to identify differential gene expression in the preterm and term human myometrium.
Biol Reprod 2003, 68(6):2289-2296.
37. Hassan SS, Romero R, Tarca AL, Draghici S, Pineles B, Bugrim A, Kha-lek N, Camacho N, Mittal P, Yoon BH, Espinoza J, Kim CJ, Sorokin Y, Malone J Jr: Signature pathways identified from gene expres-sion profiles in the human uterine cervix before and after spontaneous term parturition. Am J Obstet Gynecol 2007,
197(3):250.e1-7.
38. Girotti M, Zingg HH: Gene expression profiling of rat uterus at different stages of parturition. Endocrinology 2003,
144(6):2254-2265.
39. Muhle RA, Pavlidis P, Grundy WN, Hirsch E: A high-throughput study of gene expression in preterm labor with a subtractive microarray approach. Am J Obstet Gynecol 2001, 185(3):716-724. 40. Sarno JL, Schatz F, Lockwood CJ, Huang ST, Taylor HS: Thrombin and interleukin-1beta regulate HOXA10 expression in human term decidual cells: implications for preterm labor. J Clin Endocrinol Metab 2006, 91(6):2366-2372.
41. Blumenstein M, Keelan JA, Bowen-Shauver JM, Mitchell MD: Sup-pressors of cytokine signaling proteins in human preterm placental tissues. J Mol Endocrinol 2005, 35(1):165-175.
42. Lloyd J, Allen M, Azizia M, Klein N, Peebles D: Monocyte major his-tocompatibility complex class II expression in term and pre-term labor. Obstet Gynecol 2007, 110(6):1335-1342.
43. Saito S, Tsuda H, Michimata T: Prostaglandin D2 and reproduc-tion. Am J Reprod Immunol 2002, 47(5):295-302.
44. Chariot A, Castronovo V: Detection of HOXA1 expression in human breast cancer. Biochem Biophys Res Commun 1996,
222(2):292-297.
45. Leylek OA, Songur S, Erselcan T, Cetin A, Izgic E: Cervicovaginal washing prolactin assay in prediction of preterm delivery. Int J Gynaecol Obstet 1997, 59(1):7-12.
46. Meirowitz NB, Smulian JC, Hahn RA, Zhou P, Shen-Schwarz S, Lam-bert GH, Gerecke DR, Gordon MK: Collagen messenger RNA expression in the human amniochorion in premature rup-ture of membranes. Am J Obstet Gynecol 2002, 187(6):1679-1685. 47. Read CP, Word RA, Ruscheinsky MA, Timmons BC, Mahendroo MS:
Cervical remodeling during pregnancy and parturition: molecular characterization of the softening phase in mice.
Reproduction 2007, 134(2):327-340.
48. Fortunato SJ, Menon R: Distinct molecular events suggest dif-ferent pathways for preterm labor and premature rupture of membranes. Am J Obstet Gynecol 2001, 184(7):1399-1405. 49. Ogita K, Kimura T, Nakamura H, Koyama S, Tsujie T, Tomiie M,
Publish with BioMed Central and every scientist can read your work free of charge "BioMed Central will be the most significant development for disseminating the results of biomedical researc h in our lifetime."
Sir Paul Nurse, Cancer Research UK
Your research papers will be:
available free of charge to the entire biomedical community
peer reviewed and published immediately upon acceptance
cited in PubMed and archived on PubMed Central
yours — you keep the copyright
Submit your manuscript here:
http://www.biomedcentral.com/info/publishing_adv.asp
BioMedcentral
50. Grigsby PL, Sooranna SR, Adu-Amankwa B, Pitzer B, Brockman DE, Johnson MR, Myatt L: Regional expression of prostaglandin E2 and F2alpha receptors in human myometrium, amnion, and choriodecidua with advancing gestation and labor. Biol Reprod
2006, 75(2):297-305.
51. Bukowski R, Hankins GD, Saade GR, Anderson GD, Thornton S:
Labor-associated gene expression in the human uterine fun-dus, lower segment, and cervix. PLoS Med 2006, 3(6):e169. (doi:10.1371/journal.pmed.0030169)
52. Lappas M, Rice GE: The role and regulation of the nuclear fac-tor kappa B signalling pathway in human labour. Placenta
2007, 28(5-6):543-556.
53. Nowicki S, Izban MG, Pawelczyk E, Agboto VK, Pratap S, Olson G, Nowicki B: Preterm labor: CD55 in maternal blood leuko-cytes. Am J Reprod Immunol 2009, 61(5):360-367.
54. Jenson SD, Robetorye RS, Bohling SD, Schumacher JA, Morgan JW, Lim MS, Elenitoba-Johnson KS: Validation of cDNA microarray gene expression data obtained from linearly amplified RNA.
Mol Pathol 2003, 56(6):307-312.
55. Rajeevan MS, Vernon SD, Taysavang N, Unger ER: Validation of array-based gene expression profiles by real-time (kinetic) RT-PCR. J Mol Diagn 2001, 3(1):26-31.
Pre-publication history
The pre-publication history for this paper can be accessed here: