http://dx.doi.org/10.4236/cs.2013.47060
A Robust Denoising Algorithm for Sounds of Musical
Instruments Using Wavelet Packet Transform
Raghavendra Sharma, Vuppuluri Prem Pyara
Department of Electrical Engineering, Dayalbagh Educational Institute, Agra, India Email: [email protected]
Received September 17, 2013; revised October 17, 2013; accepted October 24,2013
Copyright © 2013 Raghavendra Sharma, Vuppuluri Prem Pyara. This is an open access article distributed under the Creative Com-mons Attribution License, which permits unrestricted use, distribution, and reproduction in any medium, provided the original work is properly cited.
ABSTRACT
In this paper, a robust DWPT based adaptive bock algorithm with modified threshold for denoising the sounds of musi-cal instruments shehnai, dafli and flute is proposed. The signal is first segmented into multiple blocks depending upon the minimum mean square criteria in each block, and then thresholding methods are used for each block. All the blocks obtained after denoising the individual block are concatenated to get the final denoised signal. The discrete wavelet packet transform provides more coefficients than the conventional discrete wavelet transform (DWT), representing ad-ditional subtle detail of the signal but decision of optimal decomposition level is very important. When the sound signal corrupted with additive white Gaussian noise is passed through this algorithm, the obtained peak signal to noise ratio (PSNR) depends upon the level of decomposition along with shape of the wavelet. Hence, the optimal wavelet and level of decomposition may be different for each signal. The obtained denoised signal with this algorithm is close to the original signal.
Keywords: DWPT; Adaptive Block Denoising; Peak Signal to Noise Ratio; Wavelet Thresholding
1. Introduction
In the field of denoising the sounds of musical instru-ments, time frequency based transforms play an impor-tant role. They allow us to work with a sound signal from both time and frequency perspectives simultaneously. Such transforms have traditionally been useful in study-ing the nature of the sound signal, noise, and in facilitat-ing the application of aesthetically interestfacilitat-ing and novel modification to specific sound signals [1]. We are inter-ested in a transform that is useful in working with musi-cal instrument sound signals, and we look at the applica-tion of the discrete wavelet packet transform (DWPT) to remove the additive white Gaussian noise. There are several reasons for choosing the DWPT, it is inherently multi-resolution, making it more suited to human psyc-hoacoustics than fixed resolution transforms as short time Fourier transform (STFT) [2]. It is easily reconfigured to allocate time frequency resolution in different ways through various basis selection approaches. Furthermore, efficient discrete time algorithms are available, and the transform basis function is inherently time localized without the introduction of a separate window function.
Signals may be transformed, modified and re-synthesized using DWPT without affecting the quality of the signal [3].
value. The extension of discrete wavelet transform is discrete wavelet packet transform in which we split both low pass and high pass filters at all scales in filter bank implementation to obtain flexible and detail analysis transform for denoising the sound signals [8]. In [9], wavelet packet approach which deals with heterogeneous noise for preprocessing of mass spectrometry data is discussed which incorporate a variance change point de-tection method in thresholding. Wavelet packet method has been used to reduce the Additive White Gaussian Noise from the speech signal which shows significant SNR improvement [10]. The rest of the article is organ-ized as follows: In Section 2, brief theory of discrete wavelet packet transform (DWPT) is given. Wavelet packet adaptive block denoising scheme is discussed in Section 3, which is preceded by block denoising algo-rithm based on DWPT in Section 4. The various experi-mental results are discussed in Section 5. Section 6 gives the concluding remarks based on the experimental re-sults.
2. Discrete Wavelet Packet Transform
(DWPT)
Discrete wavelet packet transforms are used to get the advantage of better frequency resolution representation. When the wavelet transform is generalized to wavelet packet transform, not only the low pass filter output is decomposed through further filtering, but the high pass filter output decomposed as well. The ability to decom-pose the high pass filter outputs means that the wavelet packet allows for more than one basis function at a given scale, versus the wavelet transform which has one basis function at each scale other than the deepest level, where it has two.
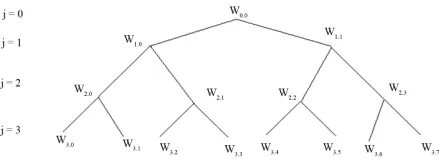
The set of wavelet packets collectively make up the complete family of possible basis, and many potential basis can be constructed from them. If only the low pass filter is decomposed, the result is wavelet basis. If all low pass and high pass filters are decomposed, the complete tree basis results. This basis has the time frequency parti-tioning like STFT. Between these two extremes lie a large number of possible basis and their associated sub trees. Nodes can be merged or split based on the re-quirement of application. In all cases, the leaves of each connected sub tree of the complete wavelet packet tree from the basis of initial space; they span the space in linearly independent fashion. The tree diagram of a depth-3 complete tree basis is shown in the Figure 1.
As with the wavelet transform tree diagram in [11], denotes the depth within the transform and the posi-tion of each node
k
[image:2.595.311.535.83.164.2]
j k, , but now the position index conveys more information, specifically which wavelet packet it corresponds to a given scale. We refer to the associate wavelet packet as wj k p, , analogus to theFigure 1. Depth-3 discrete wavelet packet transform tree.
wavelet k p, . The tree diagram does not convey time
domain information, so the index
w
p is not used in node naming. Hence in wavelet packet, if all the packets are at the same scale, we may simply refer to them as as shown in the Figure 1.
k
w
Furthermore, j k, is either the scaling function, or
derived from the scaling function. DWPT does not re-quire the explicit definition of wavelet, only filter defini-tions are enough. To see the wavelet packet at given level of decomposition, we can do a recursion of them at each node moving down the tree, to get the wavelet at next level. Specifically, if we split a wavelet packet node at level and position into two nodes at level
w
j k
1
j and locations and , we get the follow-ing two packets:
2k 2k1
m
1
1,2 0 ,
0
2 M
j k j k
m
w n h m w n m
(1)and
1
1,2 1 1 ,
0
2 M
j k j k
m
w n h m w n
(2)Then the wavelet packet transform coefficients cj k p, ,
are given by:
1
, , , ,
0 M
j k p j k p
m
c s m w
m (3)And the original signal can be expressed in terms of these coefficients and the corresponding wavelet packets as:
, , , ,
, ,
, j k p j k p j k p
s m
c w m (4)
j k, all leaf nodes of basis.where p ranges over all time offsets at scale j for which signal s is defined.
3. Wavelet Packet Adaptive Block Denoising
filtering the additive white Gaussian noise using wavelet thresholding [12]. The block denoising is explained in
the following sub sections:
, if
0, if
, if s
x x
f x x
x x
(7)
3.1. Thresholding Based Denoising
In [13], we see that the soft thresholding gives lesser mean square error. Due to this reason soft thresholding is preferred over hard thresholding, but in case of some si- gnals, we could see that hard thresholding results in les- ser amount of mean square error.
A noise reduction technique developed by donoho, uses the wavelet coefficients contraction and its principle consists of three steps;
1) Apply discrete wavelet transform to noisy signal: W y W s W z (5)
3.2. Block Selection where y s z, , and W are the noisy musical
instru-ment sound, original clean sound signal, noise signal and the matrix associated to the discrete wavelet trans- form respectively.
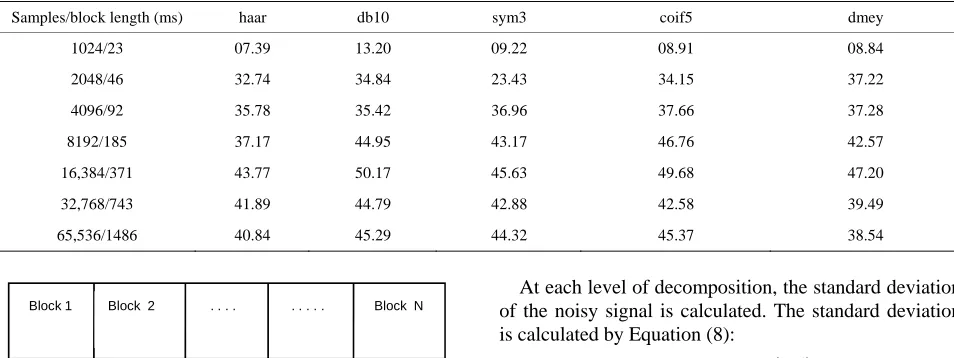
Most of the musical instrument sound signals are far too long to be processed in their entirety; for example a 10 second sarangi sound signal sampled at 44.1 KHz will contain 441,000 samples. Thus, as with spectral methods of noise reduction, it is necessary to divide the time do-main signal in multiple blocks and process the each block individually. The block formation of the signal is shown in the Figure 2. The important task is to choose the block length. Berger et al. [14] shows that, blocks which are too shorts fail to pick important time structures of the signal. Conversely, blocks which are too long miss cause the algorithm to miss the important transient details in the musical instrument sound signal. Due to the binary splitting nature of the tree bases in wavelet analysis to decompose the signal, it is better to choose the length of each block with a number of samples to a power of two. 2) Threshold the obtained wavelet coefficients.
3) Reconstruct the desired signal by applying the inverse wavelet transform to the thresholded wavelet coeffi-cients.
The thresholding function which is also known as wavelet shrinkage function is categorized as hard olding and soft thresholding function. The hard thresh-oldingfunction retains the wavelet coefficients which are greater than the threshold λ and sets all other to zero. The hard thresholding is defined as:
, if 0, otherwiseh
x x f x
(6)
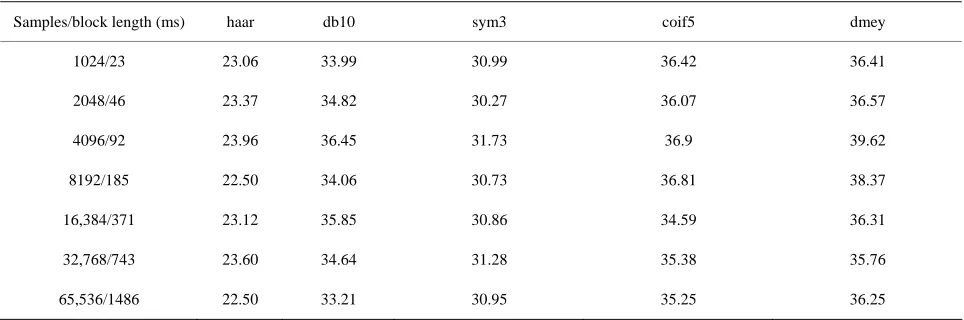
As discussed previously, the block size chosen must strike a balance between being able to pick up important transient detail in the sound signal, as well as recognizing longer duration, sustained events. Tables 1 and 2 shows the PSNR values which are quality measures, obtained for various block sizes and for different signals.
The threshold is chosen according to the signal energy and the standard deviation of the noise. If the wavelet coefficient is greater than , then it is assumed that it is significant and contributes to the original signal. Otherwise it is due to the noise and discarded. The soft thresholding function shrinks the wavelet coefficients by towards zero. Hence this function is also called as
Tables 1 and 2 show that the PSNR values for differ-ent wavelets are varying with the block size. Hence the optimum block is that for which we have maximum PSNR or minimum mean square error. The optimal block shrinkage function. The soft thresholding function is de-
[image:3.595.57.539.571.731.2]fined as:
Table 1. PSNR values obtained for different block length on shehnai sound with different wavelets.
Samples/block length (ms) haar db10 sym3 coif5 dmey
1024/23 23.06 33.99 30.99 36.42 36.41
2048/46 23.37 34.82 30.27 36.07 36.57
4096/92 23.96 36.45 31.73 36.9 39.62
8192/185 22.50 34.06 30.73 36.81 38.37
16,384/371 23.12 35.85 30.86 34.59 36.31
32,768/743 23.60 34.64 31.28 35.38 35.76
Table 2. PSNR values obtained for different block length on dafli sound with different wavelets.
Samples/block length (ms) haar db10 sym3 coif5 dmey
1024/23 07.39 13.20 09.22 08.91 08.84
2048/46 32.74 34.84 23.43 34.15 37.22
4096/92 35.78 35.42 36.96 37.66 37.28
8192/185 37.17 44.95 43.17 46.76 42.57
16,384/371 43.77 50.17 45.63 49.68 47.20
32,768/743 41.89 44.79 42.88 42.58 39.49
65,536/1486 40.84 45.29 44.32 45.37 38.54
Block 1 Block 2 . . . . . . . Block N
Total length of signal
Figure 2. Block formation of signal
size for shehnai sound is 4096 samples and for dafli 16,384 samples. The informal listening test agree with this statement in a general sense, hence the block size is variable for musical instrument sound signals.
3.3. Threshold Selection
Donoho and Johnstone derived a general optimal univer-sal threshold for the Gaussian white noise under a mean square error (MSE) criterion described in [12]. However this threshold is not ideal for musical instrument sound signals due to poor correlation between the MSE and subjective quality and the more realistic presence of cor-related noise. Here we use a new time frequency de-pendent threshold estimation method. In this method first of all the standard deviation of the noise, is calcu-lated for each block. For given , we calculate the threshold for each block. Noise component removal by thresholding the wavelet coefficients is based on the ob-servation that in musical instrument sound signal, energy is mostly concentrated in small number of wavelet di-mensions. The coefficients of these dimensions are rela-tively very large compared to other dimensions or to any other signal like noise that has its energy spread over a large number of coefficients. Hence by setting smaller coefficients to be zero, we can optimally eliminate noise while preserving important information of the signal. In wavelet domain noise is characterized by smaller coeffi-cients, while signal energy is concentrated in larger coef-ficients. This feature is useful for eliminating noise from signal by choosing the appropriate threshold. Generally the selected threshold is multiplied by the median value of the detail coefficients at some specified level which is called threshold processing.
At each level of decomposition, the standard deviation of the noisy signal is calculated. The standard deviation is calculated by Equation (8):
median
0.6745
j j
c
(8)
where cj are high frequency wavelet coefficients at jth
level of decomposition, which are used to identify the noise components and j is Median Absolute
Devia-tion (MAD) at this level. This standard deviaDevia-tion can be further used to set the threshold value based on the noise energy at that level. The modified threshold value [15] can be obtained by the equation (9):
2
2 log log
h j j
T k L Lj (9)
where Th is threshold value, Lj is the length of each block of noisy signal and k is the constant whose value is varying between 0 - 1. For determining the optimum threshold, value of k should be estimated.
4. Denoising Algorithm
The proposed wavelet packet based block denoising al-gorithm for reduction of white Gaussian noise is ex-plained in the following steps:
1) Take a musical instrument sound signal of suitable length.
2) Add White Gaussian Noise to the original signal de-pending upon the standard deviation .
3) Divide the noisy signal into blocks of different length depending upon the length of the signal in time do-main, and the number of samples should be to a po- wer of two.
4) Determine the optimal block size based on minimum mean square error criteria.
5) Compute the discrete wavelet packet transform (DWPT) of one block of the noisy signal at level 1.
co-efficients using Equations (6) and (7).
7) Take inverse discrete wavelet packet transform (IDWPT) of the coefficients obtained through step 6, which has reduced noise.
8) Calculate mean square error (MSE), peak signal to noise ratio (PSNR) for denoised signal.
9) Repeat steps 4 to step 7 for other level of decomposi-tion 2 - 5.
10)Concatenate all the blocks of the denoised signals obtained through step 8 and do averaging operation for MSE and PSNR of the musical instrument sound signal.
The complete DWPT based denoising algorithm is shown graphically in Figure 3.
5. Results and Discussions
The denoising algorithm developed in the previous sec-tion is applied to the sound samples of the various Indian musical instruments sampled at 44.1 K samples per sec-ond. For experimental purpose the sounds of three musi-cal instruments shehnai, dafli and flute are taken. For comparing the performance of the various wavelets for musical instrument sound signals, six wavelets haar, db10, sym3, coif5, dmey and bior 2.2 are taken. Besides observing the performance of the wavelets, the effect of decomposition is also discussed.
For comparing the performance and measurement of quality of denoising, the peak signal to noise ratio (PSNR) is determined between the original signal and the signal denoised by our algorithm.
i S , d S 2 max 10
PSNR 10 log
MSE S
(10) where max is the maximum value of the signal and is given by,
S
max max max i , max
S S Sd (11)
And MSE is mean square error, given by:
original signal noisy signal gaussian noise
divide noisy
signal into
blocks
DWPT
of block
level
dependent
modified
thresholding IDWPT of
modified
coefficients Denoised
block concatenate
all denoised
blocks
denoised signal
select
optimal
[image:5.595.320.529.402.535.2]block
Figure 3. DWPT based block denoising algorithm with modified threshold.
2 11 N
d i
l
MSE S l S l N
(12)where N is the length of the signal. The PSNR vaues obtained for different wavelets applied on shehnai, dafli and flute signals at different level of decomposition are shown in Tables 3-5. The additive white Gaussian noise is taken at 0.1, which is approximately 50% of the signal value.
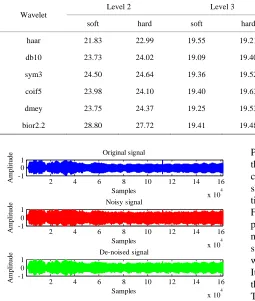
It is observed from Tables 3-5 that the PSNR values are dependent upon the shape of the wavelet, type of thresholding and the level of decomposition. Hard thresholds are better than soft thresholds for denoising the musical instrument sound signals. The selection of level of decomposition plays a significant role, and should be optimal for best denoising results. Hence, the shehnai sound will give best results when denoised with db 10 wavelet at level 5, dafli sound with dmey at level 5 and flute sound with db10 at level 4, respectively. The different signals denoised with optimal wavelet and level of decomposition are shown in the Figures 4-6.
6. Conclusion
Adaptive wavelet packet transform has been widely used in denoising the sounds of musical instruments and
2 4 6 8 10 12 14
x 104 -1 0 1 Samples A m pl it ude Original signal
2 4 6 8 10 12 14
x 104 -1 0 1 Samples A m pl it ud
e Noisy signal
2 4 6 8 10 12 14
x 104 -1 0 1 Samples A m p litu d
e De-noised signal
Figure 4. Original, noisy and denoised shehnai signal with db 10 at level 5.
1 2 3 4 5 6
x 104 -1 0 1 Samples A m pl it ud
e Noisy signal
1 2 3 4 5 6
x 104 -1 0 1 Samples A m pl it ud
e De-noised signal
1 2 3 4 5 6
x 104 -1 0 1 Samples A m pl it ud
[image:5.595.59.287.546.708.2]e Original signal
Figure 5. Original, noisy and denoised dafli signal with mey at level 5.
[image:5.595.317.533.568.705.2]Table 3. PSNR values of shehnai sound after decompostion at different levels.
Level 2 Level 3 Level 4 Level 5
Wavelet
soft hard soft hard soft hard soft hard
haar 26.02 31.33 18.57 18.72 23.09 27.65 16.89 25.32
db10 23.95 23.43 18.53 18.55 20.14 27.23 16.52 31.62
sym3 26.44 25.68 18.56 18.56 19.65 27.21 14.85 30.39
coif5 24.02 23.71 18.68 19.65 21.05 27.22 18.13 29.65
dmey 23.92 23.78 18.57 18.76 23.34 23.48 22.76 23.43
bior2.2 31.06 26.27 18.44 18.54 25.26 25.75 20.61 26.93
Table 4. PSNR values of dafli sound after decomposition at different levels.
Level 2 Level 3 Level 4 Level 5
Wavelet
soft hard soft hard soft hard soft hard
haar 20.07 19.88 17.56 17.72 27.76 27.58 26.08 27.48
db10 20.14 19.56 17.66 17.75 24.30 24.56 26.05 27.67
sym3 20.12 19.86 17.46 17.56 26.12 25.24 26.92 26.93
coif5 19.65 20.05 17.50 17.59 25.88 24.88 27.05 26.79
dmey 20.05 19.78 17.44 17.65 24.47 25.18 27.05 27.97
[image:6.595.62.539.254.382.2]bior2.2 20.00 19.77 17.35 17.53 23.58 21.73 24.21 23.11
Table 5. PSNR values of flute sound after decomposition at different levels.
Level 2 Level 3 Level 4 Level 5
Wavelet
soft hard soft hard soft hard soft hard
haar 21.83 22.99 19.55 19.21 16.16 18.82 9.07 18.97
db10 23.73 24.02 19.09 19.40 13.65 35.71 11.31 33.00
sym3 24.50 24.64 19.36 19.52 16.49 28.64 11.48 30.47
coif5 23.98 24.10 19.40 19.63 13.75 33.98 11.42 29.68
dmey 23.75 24.37 19.25 19.53 13.74 34.53 11.76 30.26
bior2.2 28.80 27.72 19.41 19.48 13.46 18.94 10.87 19.70
Providing better performance in terms of PSNR values than the other denoising techniques. In this paper, dis-crete wavelet packet transform is used for denoising-shehnai, dafli and flute sound signal corrupted with addi-tive white Gaussian noise, 50% of the signal strength. First, sound signal is divided into multiple blocks de-pending upon the optimal block size for each signal. De-noising of signal is performed with these optimal block sizes in wavelet packet domain by thresholding the wavelet coefficients at different level of decomposition. It is observed that hard thresholding gives better PSNR than soft thresholding at all the decomposition levels. The choice of the optimal level of decomposition is im-portant, and different for each sound signal. If the level of decomposition is not optimal then the PSNR value
2 4 6 8 10 12 14 16
x 104 -1
0 1
Samples
A
m
p
litu
d
e Noisy signal
2 4 6 8 10 12 14 16
x 104 -1
0 1
Samples
A
m
p
litu
d
e De-noised signal
2 4 6 8 10 12 14 16
x 104 -1
0 1
Samples
A
m
p
lit
u
d
e Original signal
[image:6.595.57.312.411.712.2]will not be maximum, hence denoising will not be the best. Maximum PSNR value for shehnai sound is at level 5 with db10 wavelet, dafli at level 5 with dmey and flute at level 4 with db10 respectively. When each block is denoised, all the blocks are concatenated to form the fi-nal denoised sigfi-nal. It is also observed that when modi-fied threshold with is used, the PSNR values are in-creased. Higher thresholds remove the noise well but some parts of the original signal are also removed be-cause it is not possible to remove the noise without af-fecting the original signal.
REFERENCES
[1] M. Lang, H. Guo, J. E. Odegard, C. S. Burrus and R. O. Wells, “Noise Reduction Using an Undecimated Discrete Wavelet Transform,” IEEE Signal Processing Letters, Vol. 3, No. 1, 1996, pp. 10-12.
[2] J. Yang, Y. Wang, W. Xu and Q. Dai, “Image and Video Denoising Using Adaptive Dual Tree Discrete Wavelet Packets,” IEEE Transaction on Circuit and Systems for Video Technology, Vol. 19, No. 5, 2009, pp. 642-655. [3] B. J. Shankar and K. Duariswamy, “Wavelet Based Block
Matching Process: An efficient Audio Denoising Tech- nique,” European Journal of Scientific Research, Vol. 48, No. 1, 2010, p. 16.
[4] R. Sharma and V. P. Pyara, “A Novel Approach to Syn- thesize Sounds of Some Indian Musical Instruments Us- ing DWT,” International Journal of Computer Applica-tions, Vol. 45, No. 13, 2012, pp. 19-22.
[5] R. Sharma and V. P. Pyara, “A Comparative Analysis of Mean Square Error Adaptive Filter Algorithms for Gen- eration of Modified Scaling and Wavelet Function,” In- ternational Journal of Engineering Science and Technol- ogy, Vol. 4, No. 4, 2012, pp. 1396-1401.
[6] J. Yu and D. C. Liu, “Thresholding Based Wavelet Packet Methods for Doppler Ultrasound Signal Denoising,” IF-
MBE Proceedings Springer Verlag Berlin Heidelberg, Vol. 19, No. 9, 2008, pp. 408-412.
[7] T. Mourad, S. Lotfi and C. Adnen, “Spectral Entropy Employment in Speech Enhancement Based on Wavelet Packet,” International Journal of Computer and Informa- tion Engineering, Vol. 1, No. 7, 2007, pp. 404-411. [8] N. S. Nehe and R. S. Holambe, “DWT and LPC Based
Feature Extraction Methods for Isolated Word Recogni- tion,” EURASIP Journal of Audio, Speech and Music Pro- cessing, Vol. 7, No. 1, 2012, pp. 1-7.
http://dx.doi.org/10.1186/1687-4722-2012-7
[9] D. Kwon, M. Vannucci, J. J. Song, J. Jeong and R. M. Pfeiffer, “A Novel Wavelet Based Thresholding Method for the Pre-Processing of Mass Spectrometry Data That Accounts for Heterogeneous Noise,” Proteomics, Vol. 8, No. 15, 2008, pp. 3019-3029.
[10] Y. Ren, M. T. Johnson and J. Tao, “Perceptually Moti-vated Wavelet Packet Transform for Bio-Acoustic Signal Enhancement,” Journal of Acoustic Society of America, Vol. 124, No. 1, 2008, pp. 316-327.
[11] K. Ramchandran and M. Vetterli, “Best Wavelet Packet Bases in a Rate-distortion Sense,” IEEE Transaction on Image Processing, Vol. 2, No. 2, 1993, pp. 160-175. [12] D. L. Donoho and I. M. Johnstone, “Adapting to Un-
known Smoothness via Wavelet Shrinkage,” Journal of the American Statistical Association, Vol. 90, No. 432, 1995, pp. 1200-1224.
[13] S. G. Chang, B. Yu and M. Vetterli, “Adaptive Wavelet Thresholding for Image Denoising and Compression,” IEEE Transaction on Image Processing, Vol. 9, No. 9, 2000, pp. 1532-1546.
[14] J. Berger, R. R. Coifman and J. G Maxim, “Removing Noise from Music Using Local Trigonometric Bases and Wavelet Packets,” Journal of The Audio Engineering So- ciety, Vol. 42, No. 10, 1994, pp. 808-818.