THE PREDICTED IMPACT OF ORGANIC COATINGS ON ISOPRENE DERIVED SECONDARY ORGANIC AEROSOL FORMATION
Mutian Ma
A thesis submitted to the faculty of the University of North Carolina at Chapel Hill in partial fulfillment of the requirements for the degree of Master of Science in the Department of Environmental Sciences and Engineering in the Gillings School of Global Public Health.
Chapel Hill 2017
Approved by:
William Vizuete
Havala Pye
@2017 Mutian Ma
ABSTRACT
Mutian Ma: The Predicted Impact of Organic Coatings on Isoprene Derived Secondary Organic Aerosol Formation
(Under the direction of William Vizuete)
Fine particulate matter (PM2.5) is known to have an adverse impact on health and climate. Secondary organic aerosol (SOA) is a source of PM2.5 and the multiphase reactions of isoprene epoxydiols (IEPOX) is an important reaction pathway. Current
chemical transport models do not include the impact of organic coatings of aerosols on
IEPOX-derived SOA formation. This work for the first time predicts coating impact on
IEPOX-derived SOA formation with the new lab based kinetic data and a 0-Dimentional
model that reduced 31% qSOA formation. It was found that Henry’s law constant (H)
increase10-fold led to 8-fold increase in IEPOX-derived SOA concentration. Diffusion
coefficient of organic coating (Dorg) was also critical on predicting IEPOX-derived SOA formation. Studies relying on different approaches resulted in a range of Dorg value from
10# 𝑚&/𝑠 to 10)* 𝑚&/𝑠 resulting 1-100% SOA reduction. Assumptions regarding the RH above which diffusivity limitations were negligible also affected the model SOA
TABLE OF CONTENTS
LIST OF TABLES……… v
LIST OF FIGURES………... vi
LIST OF ABBREVIATIONS...……….………... vii
LIST OF SYMBOLS……… ix
CHAPTER I: INTRODUCTION……….. 1
CHAPTER II: MATERIAL AND METHODS………..5
2.1 Reactive Uptake Algorithm………...5
2.2 Measurement Data………8
Organic Coating Diffusion Coefficient………8
Field Site Measurement………...9
2.3 Model Data………10
2.4 Model Performance Evaluation……….10
CHAPTER III: RESULTS………..12
3.1 Model Sensitivity………..14
3.2 Model Optimization………..17
CHAPTER IV: DISCUSSION………19
APPENDIX A: ADDITIONAL TABLE AND FIGURES………...29
APPENDIX B: 0-D MODEL CODES………32
LIST OF TABLES
Table 1 Summary of parameters used in all 0-D model simulation runs... ... 21
Table 2 The normalized mean bias (NMB) and normalized mean error (NME) for of 2-methyltetrols (tetrols), isoprene epoxydiols
organosulfates (IEPOXOS) and total secondary organic aerosol
(SOA)……….. ... 22
LIST OF FIGURES
Figure 1 Model SOA predictions versus filter measurements (A) for the full range of the concentration and (B) for the measurement
concentration range from 0-0.5 𝜇𝑔/𝑚3 ... 23 Figure 2 Percent bias compared to filter measurement (A) for the
full range of the concentration and (B) for the measurement
concentration range from 0-0.5 𝜇𝑔/𝑚3 ... 24 Figure 3 Model species predictions versus filter measurement for
(A) IEPOXOS and (B) tetrols ... 25 Figure 4 The percent reduction of predicted hourly 𝛾 as a function of RH ... 26 Figure 5 Total predicted SOA sensitivity runs versus filter measurement
for (A) coat and newH, and (B)) apDorg, Song, newHorg, 25p and 5p ... 27 Figure 6 Total predicted SOA from optimization run versus filter
measurement (A) for the full range of the concentration and
(B) for the measurement concentration range from 0-0.5 𝜇𝑔/𝑚3 ... 28
LIST OF ABBREVIATIONS
PM2.5 Particulate matter
POA Primary Organic Aerosol
SOA Secondary Organic Aerosol
VOC Volatile Organic Compound
BVOC Biogenic Volatile Organic Compound
C5H8 Isoprene, 2-methyl-1,3-butadiene
NOx Nitrogen oxides
RH Relative Humidity
OH Hydroxyl Radical
ISOPOOH Isoprene Hydroxyl Hydroperoxide
IEPOX Isoprene Epoxydiols
SAPRC07 Statewide Air Pollution Research Center 07
CMAQ Community Multiscale Air Quality Model
Tetrols 2-methyltetrols
2-MG 2-methylglyceric Acid
OS Sulfate Ester Derivatives
AS Ammonium Sulfate
ABS Ammonium Bisulfate
PEG Polyethylene Glycol
O:C Oxygen-to-Carbon
0-D 0-dimention
IEPOXOS Isoprene Epoxydiols Organosulfates
𝛾 Reactive Uptake Coefficient
LWC Liquid Water Content
PAM Potential Aerosol Mass
HR-ToF-CIMS High-resolution Time-of-flight Chemical Ionization Mass
Spectrometer
LRK Look Rock site, Tennessee, USA
SOx Sulfate Oxides
GC/EI-MS Gas Chromatography Interfaced to an Electron Impact-mass
Spectrometer
UPLC/DAD-ESI- High-resolution Quadrupole Time-of-flight Electrospray Ionization
HR-QTOFMS Mass Spectrometry
NMB Normalized Mean Bias
NME Normalized Mean Error
LIST OF SYMBOLS
𝐼𝐸𝑃𝑂𝑋4 IEPOX Gas Phase Concentration (𝜇𝑔/𝑐𝑚6)
𝐼𝐸𝑃𝑂𝑋𝑆𝑂𝐴(:;<=>=?) IEPOX-derived SOA Concentration (𝜇𝑔/𝑐𝑚6)
𝑆𝐴 Surface Area (µ𝑚&/𝑐𝑚6)
𝜈 IEPOX Gas Mean Molecular Speed (𝑚/𝑠)
𝑟C Effective Molecular Particle Radius (𝑐𝑚)
𝐷4 IEPOX diffusivity in the gas phase (𝑐𝑚&/𝑠)
𝑀𝑊 Molecular Weight of IEPOX (𝑔/𝑚𝑜𝑙)
𝛼 Accommodation Coefficient
𝐻 Henry’s Law Coefficient (𝑀/𝑎𝑡𝑚)
𝑅 Gas Constant (𝐿 ∗ 𝑎𝑡𝑚/(𝐾 ∗ 𝑚𝑜𝑙))
𝑇 Temperature (𝐾)
𝐷: IEPOX Diffusivity in the Aerosol Phase (𝑐𝑚&/𝑠)
Kparticle Pseudo-first Order Rate Constant (𝑠R))
𝐻=<4 Effective Henry’s Law Constant for an Organic Coating
(𝑀/𝑎𝑡𝑚)
lorg Organic Coating Thickness (m)
Dorg Organic Coating Diffusivity (𝑐𝑚^2 /𝑠)
𝑣 Mean Molecular speed (m/s)
𝑟C Aerosol Seed Radius (m)
𝑞 Diffuso-reactive Parameter
𝑘YZ,\:];<𝑎YZ Reactive parameter from ISORROPIA II
𝑘YZ^ _
`,\:];< Reactive parameter from ISORROPIA II
𝑘aY_Z,\:];< Reactive parameter from ISORROPIA II
𝑘YZ,b^
_c`𝑎YZ Reactive parameter from ISORROPIA II
𝐻𝑆𝑂*R Bisulfate Ion Concentration (𝑚𝑜𝑙/𝐿)
𝑁𝐻*e Ammonium Ion Concentration (𝑚𝑜𝑙/𝐿)
[𝑆𝑂*&R] Sulfate Ion Concentration (𝑚𝑜𝑙/𝐿)
𝛽 Speciation conversion rate
𝑁: Avogadro’s Number
𝜂 Particle Viscosity (𝑃𝑎 ∙ 𝑠)
CHAPTER I: INTRODUCTION
Fine particulate matter (PM2.5), particulate matter with a diameter 2.5 𝜇𝑚 or less, is known to have an adverse impact on health and climate1. Forty-five percent of the global PM2.5 consists of organic materials that can be directly emitted as primary organic aerosols (POA) or is formed in the atmosphere as secondary organic aerosols (SOA)2. SOA is formed via atmospheric chemical processes that rely on reactions of gas phase
volatile organic compounds (VOCs) that are emitted into the atmosphere. A large
emission source of VOCs into the atmosphere, and an important SOA precursor, are
biogenic volatile organic compounds (BVOCs)3. There are many different types of BVOCs being emitted, but the largest global source is isoprene (2-methyl-1,3-
butadiene, C5H8)4 and it is reported by Guenther et al.5 to have estimated emission of 500 to 750 Tg yr-1
.
Isoprene and its influence on SOA formation have been the focus of recent
studies that have discovered increases of PM2.5 via a low nitrogen oxides (NOx)
multiphase pathway. It is now known that this pathway is influenced by aerosol seed acidity, ambient relative humidity (RH), and sulfate availability4, 6-26. Under limited NOx conditions, isoprene first reacts with hydroxyl radical (OH) to form first generation
isoprene oxidation products such as isoprene hydroxyl hydroperoxide (ISOPOOH)27. ISOPOOH can then further react with OH to form isoprene epoxydiols (IEPOX) which
including relative humidity, diffusion hindrances with an organic coating, particle
reactivity, and the ability of aerosol seeds to absorb mass18-20. Aerosol acidity can also enhance IEPOX-derived SOA formation21. As a result, the IEPOX reactive uptake process amidst high RH conditions with acidified inorganic aerosol seed is considered
the main IEPOX-derived SOA reaction pathway in the atmosphere10. IEPOX-derived SOA will then undergo further reactions with or within aerosols to increase PM2.5 mass.
The IEPOX related oxidation products and reaction pathways are important and
need to be included in models for accurate prediction and regulatory purposes. Gas
phase reactions for IEPOX were introduced in the Statewide Air Pollution Research
Center 07 (SAPRC07tic)28, 29 mechanism. This version of the mechanism introduced new IEPOX SOA species along with corresponding reaction rate constants30. This mechanism was then implemented in the Community Multiscale Air Quality Model
(CMAQ 5.1) permitting the prediction of isoprene derived SOA precursor. To predict
SOA formation from these precursors additional particle phase reactions were added to
the aerosol module via a heterogeneous reaction parametrization18, 28. Using this new parameterization, CMAQ could predict the location of observed peaks in the Southeast
US for the following isoprene derived SOA tracers18-20: 2-methyltetrols (tetrols), 2- methylglyceric acid (2-MG) and sulfate ester derivatives (organosulfate, OS). The new
heterogeneous pathway predicted tetrols and 2-MG were more consistent against the
measurement yet OS were still significantly under predicted. This heterogeneous
reactive uptake pathway provides a framework for this important pathway for isoprene
SOA prediction, but uncertainty exists on many of its parameters. Furthermore, this
phase, only contain inorganic components, and that the organic constituents have no
impact on the reactive uptake process.
In the CMAQ model, the process of IEPOX partitioning on to aerosol is treated as
a homogeneous phase reaction with reactive parameters derived from empirical data.
While in the real atmosphere, aerosol can be coated by organic layers formed by gas
phase VOCs that will change the physical and chemical properties of the aerosol. A
study by Zhang et al.31 used a flow tube reactor to generate 𝛼-pinene derived organic aerosol and used what observational data to estimate viscosity. The results found that
𝛼-pinene derived SOA had ~108 times higher viscosity than compared to water. Based on the Stokes-Einstein equation32, the 𝛼-pinene derived SOA diffusion coefficient is inversely proportional to the particle viscosity. Therefore, the organic diffusion
coefficient should be reduced compared to pure inorganic diffusion impacting the
organic coating diffusivity and hindering SOA formation. Riva et al.21 also used 𝛼-pinene derived oxidation product, but unlike Zhang, these researches formed an organic
coating on ammonium sulfate (AS) and ammonium bisulfate (ABS) aerosol seeds. The
IEPOX reactive uptake rates in these experiments were found to be reduced by up to 80%
under a ~50% RH condition. Additional experiments with other organic coatings also
found comparable results. Gaston et al.33 found that Polyethylene glycol (PEG) derived coatings on the AS and ABS seeds reduced the IEPOX reactive uptake under 3
different RH condition and the reactive update was further reduced from 0.08 to less
than 0.01 with higher PEG mass fraction.
The CMAQ implementation assumes a homogenous phase, however, in the
microscope observing droplets formed with various oxygen-to-carbon (O:C) indicated
that aerosol droplet can have phase separation occurring under low O:C ratio
(O:C<0.56) at low RH (<50%) and for test species with high O:C ratio (>0.8), phase
separation never occurred. Pye et al19 predicted that over the continental US that organic and inorganic constituents within the aerosols are phase separated over 70% of
the time. This phase separation has the potential to hinder SOA formation and hence
influence model predictions.
A more accurate IEPOX-derived SOA model representation could be achieved
by addressing the impacts of organic coatings and phase separation in heterogeneous
reactive uptake algorithms. New chamber experimental data are now available allowing
some constrains on critical parameters needed to simulate the changes in aerosol seed
uptake due to coating type and under various RH conditions35. This work developed a 0- dimension (0-D) box model incorporating the latest kinetic data that accounts for coating
influences. Model inputs are constrained using measurement data from the 2013 South
Oxidant Aerosol Study (SOAS). SOAS also provided particle phase filter measurement
data of isoprene epoxydiols organosulfates (IEPOXOS) and tetrols that is used for a
CHAPTER II: MATERIAL AND METHOD
2.1 Reactive Uptake Algorithm
The formation of IEPOX-derived SOA is modeled in this work as a first order
heterogeneous uptake reaction18-20, 36:
𝐼𝐸𝑃𝑂𝑋 4 → 𝐼𝐸𝑃𝑂𝑋𝑆𝑂𝐴(:;<=>=?) (1)
In this first order heterogeneous reaction, rate constant khet is defined as
𝑘l;] = opbn qre _ st
(2)
where 𝑆𝐴 is the aerosol surface area (µm2/cm3), 𝜈 is the mean molecular speed (m/s) in the gas phase, 𝑟C is the effective molecular particle radius (cm), 𝐷4 is IEPOX diffusivity in the gas phase, 𝑀𝑊 is the molecular weight of IEPOX (g/mol), and 𝛾 is the reactive
uptake coefficient.
For all simulation runs, the measured gas phase IEPOX concentration and
temperature were provided for every 30 minutes as the input and the SA and rp terms
were calculated based on measurement dry mass16. 𝐷4 (1.9 ∗ 𝑀𝑊 Rcw) was taken from Schnoor37 and Nguyen et al14, and 𝜈 was estimated by root mean square speed37.
The heterogeneous reaction is parametrized using a reactive uptake coefficient
C5-dicarboxylic acids (glutaric, methylsuccinic, and dimethylmalonic acid), ammonium
sulfate with C6-dicarboxylic acids (2-methylglutaric, 3- methylglutaric, and 2,2-
dimethylsuccinic acid), and ammonium sulfate with C7-dicarboxylic acids(3-methyladipic
acid, 3,3- dimethylglutaric acid and diethylmalonic acid). Zhang et al35 used scanning electron microscopy and atomic force microscopy methods to show the core-shell
morphology of laboratory generated 𝛼-Pinene derived SOA coated aerosol. This core-
shell morphology assumption were also made by Anttila et al.39 and Gaston et al.40 to update the resistor model with a coating term. These data suggest continuing to
assume a core shell approach in this reactive uptake coefficient. The reactive uptake
coefficient used in this study is defined in equation 318-20, 36
) x =
) y+
{
*Y∗|∗} ~•∗€p•o•‚ƒ„… ) †‡ˆ‰ Š R‹Œ+
{∗?•or∗<p
*∗Y•or∗|∗}∗~•or∗<ƒ•o… (3)
where α is the accommodation coefficient, 𝐻 is the Henry’s Law coefficient (𝑀/𝑎𝑡𝑚), 𝑅
is the gas constant (𝐿 ∗ 𝑎𝑡𝑚/(𝐾 ∗ 𝑚𝑜𝑙)), 𝑇 is temperature (𝐾), 𝐷: is the IEPOX diffusivity in the aerosol core (𝑐𝑚&/𝑠R)), and 𝑘
C:<]ŽV?; is the pseudo-first order rate constant (𝑠R)), H
org (𝑀/𝑎𝑡𝑚) is the effective Henry’s Law constant for an organic coating and lorg is the organic coating thickness (𝑚), 𝐷=<4 is the organic coating
diffusivity (𝑐𝑚&/𝑠R)), 𝑣 is the mean molecular speed (𝑚/𝑠), 𝑟
C is the aerosol seed radius (𝑚), and 𝑟V=<; is the aerosol inorganic core radius (𝑚). In equation 3 𝑞 is the
diffuso-reactive parameter defined in equation418-20, 36
q = (r• ‘’“”•–—˜™
An α of 0.241 and H of 3.0e7 M/atm18-20, 28, 33, 40 were assumed to match the values used in CMAQ v5.218-20. A 𝐻=<4 value of 0.3 𝑀/𝑎𝑡𝑚 was used reported by Gaston et al.33, 40. lorg has not been measured thus an initial estimation of coating thickness was made as
10% of total aerosol seed radius as shown in equation 5
𝑙=<4= 0.1 ∗ 𝑟C (5)
𝑟V=<; is defined in equation 6
𝑟V=<;= 𝑟C− 𝑙=<4 (6)
This study uses a 𝐷=<4 relationship with RH that was based on the potential
phase separation42 and is defined in equation 731, 43. The data provided by Zhang et al31 was obtained from experiments with a RH range of 15% to 70%. In this study an
extrapolation of the diffusion coefficient was used for RH less than 15% and when RH is
greater than 70% Dorg is assumed to revert to the value of Da.
𝐷=<4 = e•.žž∗|YR6*.*# 𝑤ℎ𝑒𝑛 𝑅𝐻 < 70%
𝐷=<4 = 𝐷: 𝑤ℎ𝑒𝑛 𝑅𝐻 > 70% (7)
The 𝑘C:<]ŽV?; for IEPOX will be calculated assuming protonation of the IEPOX and
nucleophilic addition as defined in equation 8. The ISORROPIA II44 model used measured liquid water content (LWC) to calculate the parameters needed for 𝑘C:<]ŽV?; 20
𝑘C:<]ŽV?; = 𝑘YZ,\:];<𝑎YZ𝐿𝑊𝐶 + 𝑘YZ^ _
`,\:];< 𝐻𝑆𝑂*R 𝐿𝑊𝐶 + 𝑘aY
_Z,\:];< 𝑁𝐻*
e 𝐿𝑊𝐶 +
𝑘YZ,b^
_c`𝑎YZ[𝑆𝑂*
Equation 9 is used to define speciation between 2 different IEPOX SOA products,
IEPOXOS and tetrols, based on the relative rates of precursor conversion.
𝐼𝐸𝑃𝑂𝑋𝑆𝑂𝐴 = 𝛽 ∗ 𝐼𝐸𝑃𝑂𝑋𝑂𝑆 + 1 − 𝛽 ∗ 𝑡𝑒𝑡𝑟𝑜𝑙𝑠 (9)
This conversion rate 𝛽 is defined by the fraction of sulfate converted per total kparticle shown in equation 10,
𝛽 =€¨Z,©ª_c`:¨Zb^_
c`
€p•o•‚ƒ„… (10)
2.2 Measurement Data
Organic Coating Diffusion Coefficient
The estimation of the diffusion coefficient of IEPOX in the organic coating (Dorg) were based on two indoor flow tube studies by Shrestha et al.45 and Zhang et al.31. In these studies SOA was produced in a flow tube reactor with or without BVOC derived
coatings. 𝛼-pinene was used to generate one coating layer at different concentrations
under several RH levels. The Stokes-Einstein equation was then used to convert
viscosity to diffusivity as shown in Equation 1131
𝐷=<4 =a|}
«∗ )
•¬-: (11)
where R is the gas constant (0.0821 L atm KR) molR)), T is the ambient temperature (𝐾), NA is Avogadro’s number (6.022 ∗ 10&6), 𝜂 is the particle viscosity (𝑃𝑎 ∙ 𝑠), and a is the gas particle radius (𝑚).
A second study estimated Dorg via reactive uptake measurements base on the
particles. These particles were conditioned at selected relative humidity (RH) and then
injected to a flow tube reactor to react with IEPOX at different time scales. The reactive
uptake coefficient, g, was determined by measuring the gas phase IEPOX concentration
via an iodide-adduct high-resolution time-of-flight chemical ionization mass
spectrometer (HR-ToF-CIMS, Aerodyne Research, Inc). By calculating gIEPOX from selected coating thicknesses, a resistor model was applied to derive the value of
Horg*Dorg40 at the RH where the experiments were conducted. Varying the RH of the air where the particles were exposed to, each Horg*Dorg value at selected RH was calculated.
Field Site Measurements
Field measurements at the Look Rock, Tennessee (LRK) ground site during the
SOAS field campaign provided inputs for the model simulations and IEPOX SOA tracer
concentrations needed for the model evaluation. Ambient temperature, RH, and aerosol
concentrations were obtained from measurements described in Budisulistiorini et al16. IEPOX and ISOPOOH were detected as the [CH3COO.C5H10O3]- ion at m/z 177 by the Aerodyne high-resolution time-of-flight chemical ionization mass spectrometry (HR-ToF-
CIMS) described in Budisulistiorini et al20. The PM
2.5 samples were collected every 3 hours during the high-NOx and sulfate oxides (SOx) periods (intensive sampling
periods), and every 11 hours during the low-NOx and SOx periods (regular sampling
periods) 16. Two punches were extracted per filter and one punch was used for analysis by gas chromatography interfaced to an electron impact-mass spectrometer (GC/EI-
MS) and the other one was used for ultra-performance liquid chromatography coupled
ionization mass spectrometry (UPLC/DAD-ESI-HR-QTOFMS).
Tetrol concentrations were analyzed by GC/EI-MS (Hewlett-Packard (HP) 5890
Series II Gas Chromatograph equipped coupled to an HP 5971A Mass Selective
Detector) and were quantified using authentic standards synthesized in-house16. IEPOXOS concentrations were analyzed by UPLC/DAD-ESI-HR-QTOFMS (Agilent
6500 series system equipped with a Waters Acquity UPLC HSS T3 column) and were
quantified using an authentic standard synthesized in-house16. 2.3 Model Data
The equations described above were implemented in a 0-D model via Matlab
software (version 2017a) to predict hourly average concentrations for tetrols and
IEPOXOS. Based on previous work, a 6-hour model run was used to estimate the final
concentration output of the tracer per input timestep15,20. For example, to estimate the IEPOX SOA concentrations for 6 pm, a modeling run was initialized at 6 pm and only
the final hour of that 6-hour run was used in the analysis. Then all the hourly output data
were matched and averaged to compare with the 3-hour and 11-hour filter data16. All model runs were completed from 06/01/2013 to 07/15/2013 using SOAS 2013 field
measurement at the LRK site as input for the model.
2.4 Model Performance Evaluation
Normalized mean bias (NMB) and normalized mean error (NME) were calculated
for all runs. Normalized mean bias and normalized mean error were used for model
evaluation as shown in equations 12 and 13.
𝑁𝑀𝐵 = º‹(·=¸;?R^¹>) (^¹>) º
‹ ∗ 100 (12)
𝑁𝑀𝐵 = º‹ ·=¸;?R^¹> (^¹>) º
where Model are the 0-D model predictions and Obs are the measurement data from
CHAPTER III: RESULTS
All model evaluations used hourly model predictions of total IEPOX-derived SOA
from the 0-D model that were then averaged to match the 3 or 11-hour filters samples
collected during SOAS at the LRK. The first simulation is the “base” run where IEPOX
SOA formation was predicted by equation 4 without the third term, identical to the
implementation in Budisulistiorini et al20. In a second run, labelled “coat,” the full equation 4 with the coating term was used using the parameters described above and
shown in Table 1. Figure 1 shows the correlation of predicted total IEPOX-derived SOA
from the base run versus the measurements. As shown in figure 1 the correlation has a
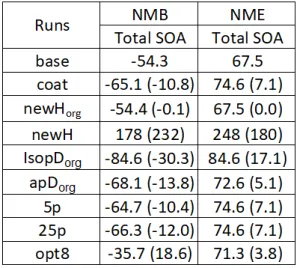
slope of 1.07, but the R2 of 0.59 suggests a large variability. Table 2 provides the bias and error statistics and shows for the base run a NMB of -54.3% and a 67.5% NME.
Most of predictions of total SOA were less than 0.7 𝜇𝑔/𝑚6 with only less than 10% of
the data points having higher concentrations with a peak of 1.8 𝜇𝑔/𝑚6. Figure 2 shows the changes in bias and error across this concentration range. As shown in figure 2 the
base run only over predicted 5 observed concentrations on average by 74% and under
predicted all other measurements. As shown in figure 2 the under predicted bias
increased linearly from 0% at 0.5 𝜇𝑔/𝑚6 to 70% by 0.1 𝜇𝑔/𝑚6 to nearly 100% at the lowest concentrations. The percent error showed a similar trend as shown in Appendix
1 figure S1. The prediction that had a bias of 140% was from a 11-hour filter that was
0.7 𝜇𝑔/𝑚6 SOA concentration for all 11 hours, while the field samples showed a measured concentration of 0.5 𝜇𝑔/𝑚6.
The addition of phase separation and organic coatings reduced the amount of
IEPOX uptake and amount of SOA produced for every simulation. On average the coat
run predicted 31% less total IEPOX-derived SOA when compared to predictions from
the base run. Figure 1 shows the correlation of predicted total IEPOX-derived SOA for
the coat run versus the measurements and the base run. The coat run predictions
resulted in a decrease of the slope from the base run to 0.77 and a reduction of R2 to 0.55. As shown in Table 2 the predictions from the coat run increased the NMB from -
54.3% to -65.1% and increased the NME by 7.1%. Figure 2 shows correlation of total
SOA percent bias versus model SOA concentrations. The coating term always reduced
SOA formation increasing the negative bias from -61.4 to -74.9% for concentrations less
than 0.5 𝜇𝑔/𝑚6. The bias was improved from 45.4% to 31.0% for the five filters that were over predicted.
The total predicted IEPOX-derived SOA was speciated into IEPOXOS and tetrols
using equations 10 and 11. Figure 3 shows the correlation of the base and coat run
predictions against filter measurements for individual tracers. The base run predicted
slopes of 0.50 and 1.28 for IEPOXOS and tetrols. The under prediction of IEPOXOS
and over prediction in tetrols resulted in a slope close to 1 for the total SOA correlation
shown in figure 1. As shown in Table 2 the predictions of IEPOXOS from the base run
had a NMB of -80.5% and for tetrols NMB of -28.6%. When coating effects were
included the prediction of both IEPOXOS and tetrols were deceased for all model
tetrols concentrations. This resulted in reducing the correlation slopes for IEPOXOS to
0.28 and tetrols to 1.05, R2 were changed to 0.40 and 0.57. The reduction of the predicted overestimation of tetrols resulted in a better R2 value. The greater decrease in tetrols is due to the relatively larger amount of 𝐻𝑆𝑂*R and 𝑁𝐻
*e ions versus sulfate ions leading to larger predictions of tetrols.
The model used in this study generated 792 hours of predicted IEPOX-derived
SOA that were then averaged to match the 66 3 and 11-hour filters that were collected
at the LRK site. Analysis of the pre-averaged hourly model data provides insights on the
environmental conditions that were most impacted by the coatings effect. This data
suggested that RH conditions had a notable change to 𝛾. Figure 4 shows the average 𝛾
percentage reduction per 10% RH bin with N showing the number of hourly model
predictions in each bin. For the coat run, the average 𝛾 reduction below the 70% RH
cutoff were nearly 100% with the RH dependence and close to 0% above the 70% RH
cutoff. Also shown in Figure 4 are the Dorg values in cm2/s. The 100% reduction in 𝛾 is
largely the result of the magnitude of the assumed Dorg value (10R)* V» c
> ) and the RH dependence only changes by 1 order of magnitude. For all model predictions with a RH
of 70% the Dorg is reduced by 9 orders of magnitude to 10Rž V» c
> resulting in a negligible influence of coatings.
3.1 Model Sensitivity
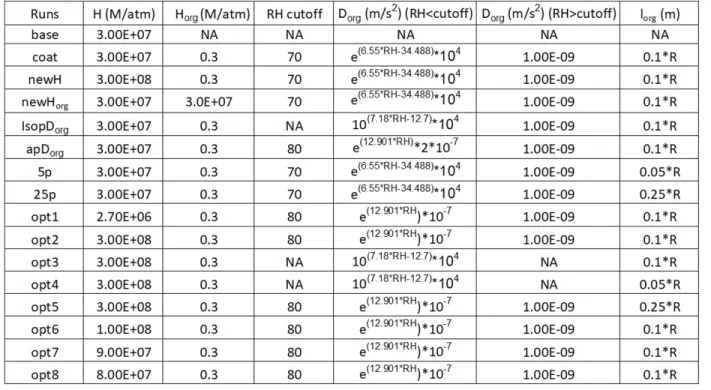
The 𝛾 has several uncertainties including H, Horg, Dorg, and lorg. All the uncertain variables were explored via model sensitivity runs. For this analysis, we focused on
total SOA to mitigate the intrinsic uncertainties brought by the model speciation. Table 1
run addressed the uncertainty of Henry’s law constant with a 10-fold H increase to 3e8
M/atm, which is within the reported upper range found in the literature40, 46, 47. The newHorg run increased Horg to a value of 3e7 M/atm as an upper bound test. The Song run uses a larger Dorg value than the coat run converted from the viscosity of isoprene oxidation products generated from an oxidation flow reactor19, 42. It is important to note that the Dorg in the Song run assumes no RH cutoff. The apDorg run increases Dorg value than the coat run based on experiments that used injected 𝛼-pinene oxidation products
as a coating. In this work the authors assumed a Dorg with an 80% RH cutoff35. The 5p and 25p runs focused on the sensitivity of the thickness of the coating. In these
simulations, a 5% or a 25% coating thickness was assumed in contrast to the 10%
coating thickness assumed in the coat run.
Figure 5 shows the correlation of total modeled SOA versus observations for all
sensitivity runs and the coat run. As shown in Figure 5, with a 10 times greater H, the
newH run increased the correlation by more than 7 times compared with the IEPOX-
derived SOA predicted in the coat run. When compared to the coat run the newH run
produced the largest increases in model predicted SOA. The NMB increased from -38%
to 223%. The increase in Horg in the newHorg run also produced increases relative to the coat run. As shown in Table 2 these increases resulted in model performance of the
newHorg being similar to that of the base run. As the Horg and the Dorg dictate gas phase IEPOX uptake onto the coating layer, the highest Horg used in the newHorg run made the coating layer behave like the aerosol core and stopped IEPOX gas uptake inhibition.
In all other sensitivity runs the changes in parameters resulted in lowering the
compared to the coat run changed the correlation to 0.62 as shown in Figure 5. Table 2
shows that worsened NMB of -68.1%. The Dorg increase in the Song run predicted the least amount of SOA concentration and reduced the slope to 0.22. The NMB was
changed from -54.3% to -84.6%. As also shown Figure 5 the correlation predicted by
modifying different coating thickness had relatively less impact on SOA when compared
to predictions made in the coat run. Both increasing or decreasing the coating thickness
changed the correlations less than 0.01.
Figure 4 also shows the 𝛾 reduction and Dorg values for the apDorg and Song runs against RH. The remaining runs can be found in figure S2. These 𝛾 reductions are
driven by the change of Dorg which is a function of RH. And the RH cutoff assumed minimal coating impact beyond the cutoff value also affected the 𝛾 predictions. Average
Dorg values are shown on the top of each column in figure 4. 3 RH range, <70%, 70- 80%, 80-100%, were picked for analysis due to 3 different RH cutoff: 70% for the coat
run, 80% for the apDorg run, and no cutoff for the Song run.
With different RH cutoff for different Dorg functions, the model performance were affected with varied 𝛾. When the RH is between 70-80%, the coat, the apDorg, and the Song run predicted -91%, -88%, and -93% NMB. When the RH is greater than 80%, the
3 runs predicted -74%, -74%, and -79% NMB. Changing RH cutoff from 70% to 80%
improved model performance for 70-80% RH range but by removing RH cutoff
worsened the model performance for 80-100% RH range.
3.2 Model optimization
To determine an optimized set of model parameters a total of 8 simulations,
shown in table S1, were produced and compared against filter data with a goal of
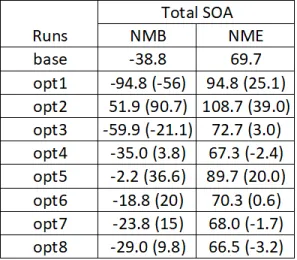
minimizing NMB and NME. As shown in Table 2 the NMB and NME for the opt8 run
were improved to -26.2% and 66.6% and is the overall best run in all 8 optimization runs.
In the opt8 run the parameters for the apDorg was used with an increase of H from 3.0e7 to 8.0e7 M/atm. The opt8 run was able to increase lower concentration 700 times
compared to the coat run. The significant increase was mainly contributed by the SOA
formed under the 70-80% RH condition. Figure 6 shows the coat, base, and opt8 runs
versus observations. The opt8 run had the best overall slope of 1.04 and R2 of 0.60. No significant R2 improvement was observed due to the under predictions at measurement
< 0.5 𝜇𝑔/𝑚6 as shown in figure 6. The under prediction in this range was -24.7% NMB.
For these lower predictions to match observations, an H value of 3e8 M/atm, which is
still within the highest reported H range from the literature40 had to be used. Implementing this H value would over predict more than 8 times for the high
concentrations. The opt4 run predicted the overall best NMB of -34.5% and NME of
predicted 38.9% NMB at measurement < 0.5 𝜇𝑔/𝑚6, which consists 90% of the measurement data, compared to 24.7% NMB for the opt8 run. Hence the opt8 run is still
CHAPTER IV: DISCUSSION
The updated coating term in the reactive uptake algorithm affected IEPOX gas
uptake by reducing 31% predicted SOA. The 0-D model shows the H parameter has the
highest impact on model SOA prediction. A 10-fold increase in H to 3.0e8 M/atm led to
8-fold increase in IEPOX-derived SOA concentration. This value is within the current
literature reported H range from 2.7e6 M/atm to 4.0e8 M/atm18-20, 33, 40, 46, 48. D org is reducing IEPOX-derived SOA formation and assumes electrolyte rich seeds19. When the Dorg is 10)* 𝑚&/𝑠, IEPOX uptake is completely inhibited in the model while when the Dorg is 10# 𝑚&/𝑠, IEPOX uptake is reduced by less than 1%. Dorg was either converted from viscosity19, 31, 42, 49 or estimated with empirical data fitted with the resistor model from Gaston et al35, 40. Different RH cutoff with corresponding Dorg functions were able to affect the model performance with less than 10% for RH <70%, 70-80% and 80-100%.
At least 40% 𝛾 reduction was predicted for RH <70%. In contrast, a maximum of 13% 𝛾
reduction was predicted for RH>70% within all sensitivity runs showing less significant
RH impact on IEPOX-derived SOA formation at high RH. All model runs except for the
newH run under predicted concentrations at the low end (𝑚𝑒𝑎𝑠𝑢𝑟𝑒𝑚𝑒𝑛𝑡 < 0.5 𝜇𝑔/𝑚6). With the updated resistor 0-D model and H of 8e7 M/atm, Horg of 0.3 M/atm, RH cutoff at 80%, Dorg from 𝛼-pinene derived data35, the model predicted more SOA concentration at the lower end yet still generated -43% NMB and -13% NMB for
This work uses organic diffusion coefficient derived from 𝛼-pinene oxidant and
only represents part of the organic coating constituents. Other constituents include
anthropogenic and other biogenic sources could have a different impact on the uptake19, 46, 47, 50, 51. D
org function is converted based on flow tube experiment data35 under RH condtion between 15-50% and empirical uptake calculation18, 40. Further, ISORROPIA II20 predicted kparticle assuming a pure inorganic condition44 leading to the uncertainty in these predictions. Further studies on constraining these parameters including H, Dorg, and Horg in the resistor model and predicting more accurate kparticle could help the model better predict IEPOX-derived SOA.
The under prediction of total SOA in 0-0.5 𝜇𝑔/𝑚6 suggests H value used in the current CMAQ v5.2 (3.0e7 𝑀/𝑎𝑡𝑚) should be higher. The updated resistor model
suggests that the organic coating layer could have significant impact on the IEPOX-
derived SOA formation and the potential to implement this resistor model in to
regulatory model for IEPOX-derived SOA schematic update. RH is another important
modulator of coating diffusion coefficient which directly affect 𝛾.
The expansion of IEPOX heterogeneous reaction in CMAQ18, 48 helped better understand NOx and Sulfur control strategy and impact on PM2.5 formation. The update of IEPOX coating resistor model in regulatory air quality model can provide a more
accurate SOA formation pathway for IEPOX. Including organic coatings can change the
impact by both anthropogenic and biogenic emission hence affect SOA control strategy
and method for different regions.
Table 1. Summary of parameters used in all 0-D model simulation runs. H is the
effective Henry’s law coefficient for IEPOX partitioning onto inorganic aerosol, Horg is the effective Henry’s law coefficient for IEPOX partitioning onto organic coating, RH is
relative humidity, Dorg is the IEPOX gas diffusion coefficient through organic coating, lorg is the thickness of coating layer, and R is the radius of aerosol seed.
Table 2. The normalized mean bias (NMB) and normalized mean error (NME) for total
secondary organic aerosol (SOA) with the difference compare to the base in
parentheses. Run parameters are summarized in table 1.
Figure 1. Model predictions of 45 days from the base (red circle) and coat (blue triangle)
runs versus filter measurements collected at Look Rock site for total IEPOX-derived
SOA for the (A) all data and (B) for concentration range from 0-0.5 𝜇𝑔/𝑚6.
Figure 2. Percent bias of predicted compared to the filter measurements from Look
Rock site for (A) across all predicted concentrations and (B) for concentration range
from 0-0.5 𝜇𝑔/𝑚6 for the base (red circle) and coat (blue triangle) runs.
Figure 3. Model predictions from the base (red circle) and coat (blue triangle) runs
versus filter measurements from Look Rock site for (A) the isoprene epoxydiols (IEPOX)
derived SOA tracers of isoprene epoxydiols organosulfates (IEPOXOS) and (B) 2- methyltetrols (tetrols).
Figure 4. The percent reduction of predicted hourly 𝛾 and Dorg vlues as a function of RH (10% bin). For the coat (red), apDorg (blue) and Song (green) runs, N is the number of hourly prediction points under corresponding RH bin. Lines with corresponding colors
are Dorg values (V» c
> ) calculated by RH. Model run parameters are summarized in table 1.
Figure 5. Total predicted SOA sensitivity runs versus measurement from Look Rock site
for (A) coat (red circle), newH (light green square), and (B) apDorg (blue triangle), Song (teal diamond), newHorg (dark green square), 25p (brown circle) and 5p (yellow circle) runs. Model runs parameters are summarized in Table 1.
Figure 6. Total predicted SOA from optimization run versus filter measurement data
Look Rock site with base (red circle), coat (blue triangle) and opt8 (green diamond) runs
for (A) the full range of the concentration and (B) for the measurement concentration
range from 0-0.5 𝜇𝑔/𝑚6.
APPENDIX A: ADDITIONAL TABLE AND FIGURES
Table S1. The normalized mean bias (NMB) and normalized mean error (NME) for total
secondary organic aerosol (SOA) of the optimization runs with the difference compare
to the base in parentheses. Run parameters are summarized in table 1.
Figure S1. Percent bias of predicted compared to the filter measurements from Look Rock site for the base (red circle) and coat (blue triangle) runs.
Figure S2. The percent reduction of hourly 𝛾 as a function of measured RH (10% bin). N
is the number of hourly prediction points under corresponding RH bin. For the coat
(red), 5p (blue), 25p(green), and newHorg runs, Model run parameters are summarized in
table 2.
APPENDIX B: 0-D MODEL CODES
Cmaq_driver.m
% Main CMAQ uptake driving routine
% This routine interacts with the other files including inputs and separate functions
%%%%%%%%%%%%%%%%%%%%%%%%
% 9/17/14 SHB
% Added nested for loop
%%%%%%%%%%%%%%%%%%%%%%%%%
% August 2015 HOTP
% Modified to include IEPOX conc calculation, similar kp formula for both CMAQ and
simpleGAMMA,
% and BETA calculation for simpleGAMMA
%%%%%%%%%%%%%%%%%%%%%%%%%
% 8/27/15 SHB
% Added kpout in routine to get kp values
%%%%%%%%%%%%%%%%%%%%%%%%%%
% 4/9/16 SHB
% Added parameter aRp for estimated radius of particle
%%%%%%%%%%%%%%%%%%%%%%%%%%
% 8/2016 HOTP
% Updated aRp, awL, and aSa for missing species (water, organics, water)
% added 3VdivSrp diagnostic which should be between 0.8 and 10,000 for valid points
% 8/2016 SHB
% Added routine to save awL per line outside loop
% Added routine to save LWC, newSA
%=================================================================
========
clc;;
close all;;
clear;;
% Importing Look Rock (LRK) data.
headerlinesIn = 1;;
delimiterIn=',';;
LRK = importdata('SOAS_LRK_iso6_rev2.csv',delimiterIn,headerlinesIn);;
[m,n] = size(LRK.data);;
% unit conversion factors
ugtog = 1e-6;;
OAdensity = 1.4;; %g/cm3, Hallquist et al. 2009 in Budisulistiorini et al.
2016 ACP
m3tocm3 = 100^(-3);; %1m^3=100^3cm3
inorgdensity = 1.7;; %g/cm3, density of ammonium sulfate, ammonium
bisulfate
waterdensity = 1.0;; %g/cm3, water density
% Computing uptake for LRK data
iepoxos = [];;
tetrol = [];;
totsoa = [];;
beta = [];;
gma = [];;
threeVdivSrp = [];;
savenewawL = [];;
kparticle = [];;
iepox = [];;
savenewLWC = [];;
savenewSA = [];;
savenewHplus = [];;
pH = [];;
lcoat = [];;
for i=1:m
awL = LRK.data(i,2);; % cm3/cm3 air
aHplusActivity = LRK.data(i,3);; % H+, mol/L aerosol
ay072 = LRK.data(i,4);; % HSO4, mol/L aerosol
ay073 = LRK.data(i,5);; % SO4, mol/L aerosol
awaterconc = LRK.data(i,6);; % H2O, mol/L aerosol
aIEP = iepox_fun( LRK.data(i,7), LRK.data(i,1) );; % inputs: aIEP, datetime
%aSa = LRK.data(i,8);; % particle surface area, cm2/cm3
aT = LRK.data(i,9);; % temperature, K
aRH = LRK.data(i,10);; % RH, fraction (0,1)
apH = LRK.data(i,11);; % pH
% not in original CMAQ version:
aNH4 = LRK.data(i,12);; % NH4, mol/L aerosol
%aRp = LRK.data(i,13);; % wet particle radius, cm (dry
radius converted by adding isorropia water)
% August 2016 updates: new quantities
org = LRK.data(i, 14);; % ug/m3 air, organics (ACSM)
water = LRK.data(i, 15);; % ug/m3 air, liquid water (ISORROPIAII)
lmass = LRK.data(i, 16);; % ug/m3 air, total ISORROPIA aerosol
mass (inorganic + water)
sadry = LRK.data(i, 17);; % cm2/cm3, dry aerosol surface area
rpdry = LRK.data(i, 18);; % cm, dry partile radius (mode of size dist)
% correct aerosol volume for organics
actualvol = (org.*ugtog./OAdensity.*m3tocm3+awL);; % add organics (w/ unit
conv) to particle volume, cm3 aerosol/cm3 air
aHplusActivity = aHplusActivity./actualvol.*awL;;
ay072 = ay072./actualvol.*awL;;
ay073 = ay073./actualvol.*awL;;
awaterconc = awaterconc./actualvol.*awL;;
aNH4 = aNH4./actualvol.*awL;;
awL = actualvol;; % add organics (w/ unit conv) to particle
volume, cm3 aerosol/cm3 air
% correct aerosol surface area for water. Measured Sa includes organics and
inorganics but not water. cm2/cm3
aSa =
sadry.*((lmass./inorgdensity+org./OAdensity+water./waterdensity)./(lmass./inorgdensity
+org./OAdensity))^(2.0/3.0);;
% correct aerosol radius for water, cm
aRp =
rpdry.*((lmass./inorgdensity+org./OAdensity+water./waterdensity)./(lmass./inorgdensity+
lcoat(i)=0.1*aRp;; %coating thickness
% Calculate diagnostic ratio 3*V/(S*rp), units: length/length
threeVdivSrp(i) = 3.0.*awL./(aSa.*aRp);;
% Diffusivity for coating (Dcoat)
%Dcoat=1e-12
%if aRH<0.7 % Default cutoff at 70%, new cutoff with Surratt
group coating data at 80%
if aRH<0.8
% Dcoat = exp(6.55*aRH-34.488);; % Derived from Zhang et al 2015 base on
alpha-pinene oxidation products coating.
Dcoat = 2E-11*exp(12.901*aRH);; % Fitted curve from Surratt lab a-pinene
coating experiment (2017)
else
Dcoat = 1e-5;; % CMAQ default coating diffusivity cm^2/s
end
%Dcoat=10^(7.18*aRH-12.7);; % Pye 2017 coat diffusivity calculation without
cutoff point
for tduration = 1:6
[runsuccess,iepoxosout,tetrolout,betaout,gmaout,kpout] = cmaq_uptake(i, awL,
awaterconc, aIEP, aSa, aT, aRH, apH, aNH4, aRp,
tduration,Dcoat,lcoat);;
iepoxos(i,tduration)= iepoxosout;;
tetrol(i,tduration) = tetrolout;;
totsoa(i,tduration) = tetrolout+iepoxosout;;
beta(i)=betaout;; % beta will be the same for all tduration, just save last one
kparticle(i)=kpout;; % kp will be the same for all tduration, just save last one
iepox(i)=aIEP;;
gma(i)=gmaout;;
savenewawL(i) = awL;; % save new awL for this line to array
savenewLWC(i) = awaterconc;; % save new awaterconc
savenewSA(i) = aSa;; % save new aSa
savenewHplus(i) = aHplusActivity;; % save new aHplusActivity
pH(i) = apH;; % save apH
Dorg(i)=Dcoat;; % save coating diffusion coefficient
% Diagnostic info
if ( runsuccess)
fprintf('Row completed: %d\n', i);;
else
fprintf('Hour did not complete, STOP AND DEBUG!!!!!!!!!! %d\n', i);;
end;;
runsuccess = false;;
end;;
end;;
SOAtotal = iepoxos(:,6)+tetrol(:,6);;
%SOAtotal = iepoxos(:,60)+tetrol(:,60);;
%% diagnostic information
%datapts = linspace(1,m,m);;
%
%plot( datapts, iepoxos(:,12))
%%plot( datapts, iepoxos(:,60))
%
%title('IEPOXOS CMAQ-box')
%saveas( gcf, 'iepoxos.cmaq3.png')
%
%plot( datapts, tetrol(:,12))
%%plot( datapts, tetrol(:,60))
%title('Tetrol CMAQ-box')
%saveas( gcf, 'tetrol.cmaq3.png')
%
%plot( datapts, SOAtotal)
%title('SOA total CMAQ-box')
%saveas( gcf, 'soatotal.cmaq3.png')
%
%plot( datapts, beta(:))
%title('Beta CMAQ-box')
%saveas( gcf, 'beta.cmaq3.png')
% determine mean and standard deviation of beta
mean(beta)
std(beta)
% exit
fileID = fopen('cmaq_base.txt','w');;
fprintf(fileID,'%12s %12s %12s %12s %12s %12s %12s\n',
'line','hour','soa','kp','Dorg','lcoat','gamma');;
aiepox=0;;
for line = 1:m;;
fprintf(fileID,'%12d %12d %12.6e %12.6e %12.6e %12.6e %12.6e\n', line, tduration,
totsoa(line,tduration),kparticle(line),Dorg(line),lcoat(line),gma(line));;
end;;
end;;
cmaq_uptake.m
% CMAQ uptake algorithms. Box model originally from
% Simplified Gas-Aerosol Model for Mechanism Analysis ~ simpleGAMMA.m
%%%%%%%%%%%%%%%%%%%%%%%%%%%%%%%%%%%%%%%%%%%
%%%%%%
% 9/8/14 HOTP (CMAQ v1)
% Modified to compute uptake following CMAQ algorithms. Extraneous information
removed for clarity.
%
%%%%%%%%%%%%%%%%%%%%%%%%%%%%%%%%%%%%%%%%%%%
%%%%%%
% 9/10/14 SHB
% Modified to save data every hour for each input line
%
%%%%%%%%%%%%%%%%%%%%%%%%%%%%%%%%%%%%%%%%%%%
%%%%%%
% 9/11/14 SHB (CMAQ v1.1)
% H_iepox from 3e7 (original simpleGAMMA) to 2.7e6 (Pye et al. 2013)
% k_H+_tetrol from 9e-4 M2/s to 2e-4 M2/s
% k_H+_iepoxos = 2e-4 * (5.2e-1/5.3e-2) = 2e-3 %% Piletic et al. (2013)
% k_HSO4-_iepoxos = 2.9e-6 * (5.2e-1/5.3e-2) = 2.8453e-05 %% Piletic et al. (2013)
%
%%%%%%%%%%%%%%%%%%%%%%%%%%%%%%%%%%%%%%%%%%%
%%%%%%%
% 9/17/14 SHB (CMAQ v2)
% Added 3.1e-7*NH4 into kp calculations
%
%%%%%%%%%%%%%%%%%%%%%%%%%%%%%%%%%%%%%%%%%%%
%%%%%%%
% 9/29/14 SHB (CMAQ v3)
% Changed the data input (SOAS_LRK_v3).
% Used LRK ambient inorganic loading (ACSM SO4+NH4+NO3) to calculate awL.
%
%%%%%%%%%%%%%%%%%%%%%%%%%%%%%%%%%%%%%%%%%%%
%%%%%%%
% 9/30/14 SHB (CMAQ v4)
% Replaced [waterconc] with 55.5 M
%%%%%%%%%%%%%%%%%%%%%%%%%
% Modified to include IEPOX conc calculation, similar kp formula for both CMAQ and
simpleGAMMA,
% and BETA calculation for simpleGAMMA
%%%%%%%%%%%%%%%%%%%%%%%%%
% 8/27/15 SHB
% Added kp in function to get kp values
%%%%%%%%%%%%%%%%%%%%%%%%%
% 8/2016 HOTP
% Cleanup and added Riedel 2016 rate constants
%%%%%%%%%%%%%%%%%%%%%%%%%
% 8/2016
% Add gma, kp in function
%%%%%%%%%%%%%%%%%%%%%%%%%
% 5/2017 MM
% Add diffusivity resistor in gma (Gaston 2014), add coating diffusiviy Dcoat (Zhang
2015)
%%%%%%%%%%%%%%%%%%%%%%%%%
% 7/2017 MM
% Change lcoat=0.1*rp to lcoat=0.3*rp
% 9/2017 MM