Studying lateral mobility of surface molecules on the plasma membrane using biophysical approaches
Yun Chen
A dissertation submitted to the faculty of the University of North Carolina at Chapel Hill in partial fulfillment of the requirements for the Doctor of
Philosophy degree in the Department of Biomedical Engineering.
Chapel Hill 2007
Approved by
Advisor: Professor Ken Jacobson, Ph.D.
Abstract
Yun Chen: Studying lateral mobility of surface molecules on the plasma membrane using biophysical approaches
(Under the direction of Ken Jacobson)
Fluorescence recovery after photobleaching (FRAP), fluorescence correlation spectroscopy (FCS) and Single particle tracking (SPT) are common biophysical methods to measure lateral mobility of membrane molecules. These methods typically sample lateral mobility in micron-sized regions of the membrane so that they can be used to measure diffusion in regions of single cells. The methods are based on fluorescence from the molecules of interest or from light scattered from particles attached to single or small groups of membrane lipids or proteins. FRAP methodologies are described for a dedicated wide field microscope, which can be applied to confocval-based FRAP too. SPT can be applied to track single fluorescent molecules in membranes but this aspect will not be treated in detail.
phenomenon was observed with two different GPI-anchored proteins: Thy-1 and CD73, a 5’ exonucleotidase. Cholesterol depletion and Src family kinase (SFK) inhibition abolished transient anchorage, indicating the involvement of cholesterol and SFKs in cross-linking dependent transient anchorage. Further evidence for the involvement of SFKs was obtained from Src, Yes, Fyn
defective cells, in which transient anchorage of CD73 was not detected. Caveolin-1 knockout cells exhibited reduced transient anchorage time, suggesting the partial participation of caveolin-1. Additionally, in PI3 kinase inhibited IMR 90 cells expressing CD73, short-period transient anchorage (< 1 second) increased sharply and no long-period anchorage occurred. By
Acknowledgement
TABLE of CONTENTS
Page
LIST OF TABLE... vii
LIST OF FIGURES ...viii
LIST OF ABBREVIATIONS ... ix
Chapter 1: introduction...1
Chapter 2: Overview ...2
Chapter 3: Methods to measure the lateral diffusion of membrane lipids and proteins ...6
1. Fluorescence recovery after photobleaching (FRAP)...6
1.1. Instrumentation ...9
1.2. Analysis of recovery curves ...12
2. Fluorescence correlation spectroscopy (FCS)...13
3. Single particle tracking (SPT) ...18
3.1. Methodology ...19
3.2. Rudimentary analysis of trajectories ...21
Chapter 4: Hardware and software engineering for lateral diffusion measurement-- Configuration of the FRAP system ...23
Introduction ...23
FRAP...24
Hardware ...24
Timing program...24
Single Particle Tracking...28
TCZ detection program (rewritten in Matlab) ...29
Chapter 5: Transient confinement zones: a type of lipid raft? ...30
Introduction ...30
Detection of TCZ and the significance...32
Example of TCZ ...34
Transient confinement is induced by cross-linking ...36
Chapter 6: Mechanisms of transiently anchoring cross-linked glycosyl-phosphatidylinositol-anchored proteins to the membrane associated cytoskeleton -- Signal transduction via membrane nanodomains ...40
Introduction ...41
Results ...43
Transient Anchorage ...43
Transient anchorage also occurs with preassembled complexes: estimate of cluster size...45
Regulation of transient anchorage ...46
Transient anchorage exhibited by a transmembrane protein is regulated in a different manner...49
Discussion...51
Materials and Methods ...55
Cells...55
Gold conjugation to cells...56
Time lapse gold imaging for SPT...58
Data Analysis...59
Estimation of maximum number of GPIAPs bound to pre-assembled complexes...60
Acknowledgement of the published work ...62
LIST OF TABLE
Table page 1. Dependence of CD73 transient anchorage on dilution of the tertiary
LIST OF FIGURES
Fig. 1. Schematic of a FRAP experiment ...65 Fig. 2. Instrument schematic BDC: ...66 Fig. 3. Simulated fluorescence intensity raw data and calculated normalized
aoutocorrelation function, G(τ). ...67 Fig. 4. Overall schematic of an SPT experiment...68 Fig. 5 Mean square displacement of lateral mobility. ...69 FIG. 6. Various trajectories from single-particle tracking (SPT) experiment on
murine fibroblasts or simulation ...70 FIG. 7. Fence and picket structure of the plasma membrane model proposed
by Ritchie et al. ...71 FIG. 8. Cross-linking scheme to cluster Thy-1 molecules on the cell surface 72 FIG. 9. Two different types of confinement induced by cross-linking. ...73 Figure 10: Maximal cross-linking scheme that produces transient anchorage
...74 Figure 11: Both SFK inhibition and cholesterol depletion suppressed transient
anchorage...75 Figure 12: Effects of PI3 inhibition on transient anchorage...76 Figure 13: Caveolae participated in transient anchorage...77 Figure 14: CFTR demonstrated transient anchorage independent of maximal
cross-linking, SFK activities and cholesterol presence ...79 Figure 15: Transient anchorage hypothesis...81
LIST OF ABBREVIATIONS
CFTR: cystic fibrosis transmembrane conductance regulator FCS: Fluorescence Correlation Spectroscopy
FRAP: Fluorescence Recovery after Photobleaching GPIAP: glycosyl-phosphatidylinositol-anchored proteins RAT: relative anchorage time
Chapter 1: introduction
The dissertation is arranged into 6 chapters. In Chapter 1, an overview of doctoral study is described; introducing the evolution of membrane biology, various approaches studying membrane structures of live cells, and the
Chapter 2: Overview
The view for the structure of the plasma membrane shifted over the past 15 years from the original fluid mosaic model proposed by Singer and Nicolson (Singer and Nicolson, 1972) to the one emphasizing the lateral heterogeneities in membranes. In the fluid mosaic model, the plasma
membrane is depicted as 2-D fluid where lipids, proteins and other membrane components diffuse more or less freely in random motions. Lateral
heterogeneity is prominent in the lipid raft model, where it is proposed that there are small entities on the plasma membrane with distinct
biochemical/biophysical characteristics, such as viscosity and molecular composition (Simons and van Meer, 1988; van Meer and Simons, 1988). These microdomains, or lipid rafts, are speculated to serve specialized cellular functions. For example, it is proposed that lipid rafts are responsible for conveying signals into the cell from outside the cell upon stimuli, such as ligand binding, oligomerization/cross-linking of surface molecules and entry of pathogens (Simons and Toomre, 2000). The lipid raft model postulates that these small entities are composed of sphingolipids, cholesterol, GPI-anchored proteins and some specific transmembrane proteins. Moreover, these
platforms recruit the essential signaling molecules and thus allow the
protein kinase C (PKC) could be both found in detergent resistant membrane (DRM) fractions of the cell lysates (Simons and Ikonen, 1997; Simons and Toomre, 2000). In addition, microscopic evidence also showed that
microdomains formed upon cross-linking or ligation. Such microdomains not only consisted of the surface molecules being engaged, but also of other molecules which are speculated to be raft components. For example, after T cell receptors (TCRs) are engaged by antigens, TCRs clusters containing cholesterol and Lck are formed (Janes et al., 1999). It is evident that upon stimuli, certain microdomains can be observed by light microscopy. But the origin of these visible microdomains is still yet to be elucidated. That is, whether the microdomains are formed from smaller lipid rafts or there are no such smaller lipid rafts existing on the surface of resting cells is still unclear. Furthermore, recent studies have shown that the co-fraction of putative lipid raft components in detergent-resistant membrane (DRM) might be artifacts induced by the detergent treatment.
diffusional mobilities belonging to raft markers and non-raft markers on the cell membrane (Bacia et al., 2004). Foster resonance energy transfer (FRET) has also been employed to study the spatial relationships between surface molecules labeled by acceptor and donor fluorophores (Kenworthy et al., 2000; Rao and Mayor, 2005; Sharma et al., 2004), and generated mixed results about the existence of lipid rafts on the resting cell membrane. Single particle tracking (SPT) has been used in our lab to characterize the
heterogeneity of the cell membrane. In SPT, surface molecules are labeled with nano-sized particles and their lateral motions on the cell membrane are recorded by tracking the particles bound to the surface molecules. It has been found that there are small regions on the cell membrane in which surface molecules are temporarily confined with lower diffusion rates, indicating the biophysical heterogeneity of the cell membrane. These regions are called transient confinement zones (TCZs). TCZs can be detected even on relatively unstimulated cells, though with less abundance.
On the other hand, the relationship of TCZs and lipid rafts defined in the original lipid raft model is still to be defined. To further exploit the
advantages provided by SPT, which are minimal perturbation, long
observation period and dynamic recording, we used SPT to investigate the lateral motion of clustered surface molecules. The clusters being investigated were induced by deliberate cross-linking and were of a size less than 150 molecules. Clusters of this size are still beyond the resolution of optical microscopes and represent the population formed immediately upon
microscopes. In this work, we found that in addition to TCZs, such cross-linking induced clusters also demonstrated another unique behavior, transient anchorage, where the gold-labeled clusters stopped moving for up to 10 seconds. The occurrence of transient anchorage suggests the involvement of other factors than thermal forces and surface heterogeneity. In the following experiments, transient anchorage was characterized, and the possible mechanisms were discussed and evaluated using SPT. It is concluded that transient anchorage requires the involvement of Src family kinases,
cholesterol, caveolin. Interpreting results from the experiments, it is
Chapter 3: Methods to measure the lateral diffusion of membrane lipids and proteins
In this chapter, methods are discussed to measure lateral mobility of membrane lipids and proteins using techniques based on the light microscope. These methods typically sample lateral mobility in very small, micron-sized regions of the membrane so that they can be used to measure diffusion in regions of single cells. The methods are based on fluorescence from the molecules of interest or from light scattered from particles attached to single or small groups of membrane lipids or proteins. Fluorescence recovery after photobleaching (FRAP), fluorescence correlation spectroscopy (FCS) and Single particle tracking (SPT) are presented in that order. FRAP and FCS methodologies are described for a dedicated wide field microscope although many confocal microscopes now have software permitting these
measurements to be made; nevertheless, the principles of the measurement are the same for a wide field or confocal microscope. SPT can be applied to trace the movements of single fluorescent molecules in membranes but this aspect will not be treated in detail.
Fluorescence recovery after photobleaching (FRAP) is a single cell technique used to study the mobility of fluorescent molecules. The method has been employed since the mid 1970s to examine molecular mobility in the plasma membrane, other organellar membranes and the cytoplasm (Kapitza et al., 1985). A resurgence in use occurred in the 90s due to the advent of GFP fusion proteins (Lippincott-Schwartz et al., 2001).
In a FRAP experiment, a pulse of high intensity light from a laser is used to photobleach fluorophores, typically in a small micron-sized region. Subsequently, fluorescence recovers due to lateral transport of unbleached fluorophores into the bleached region and concomitant movement of bleached fluorophores out of the region. Under optimal conditions, the recovery kinetics depend only on the molecular mobility, which usually is determined by the diffusion and flow of the labeled molecules as well as the binding kinetics of the fluorescent molecules to anchored or slowly moving structures. In most cases, a diffusion coefficient and/or flow velocity and mobile fraction can be determined.
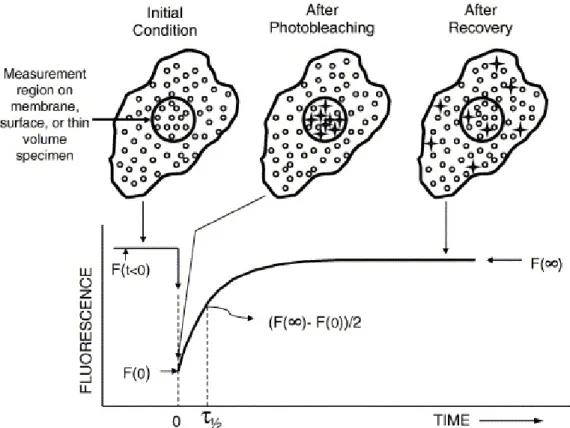
The simplest version of the photobleaching technique is spot
photobleaching which is schematically depicted in Fig. 1. First, the emission,
photobleached area is recorded as a function of time with a beam coincident with the photobleaching beam and of the same intensity as that used to
measure F (t < 0). The recovery curve increases in fluorescence intensity from
F (0) at time zero to F (∞) at the time when the recovery is considered complete.
The kinetics of recovery can be empirically characterized by the time,
τ1/2, required to reach 50% of complete recovery. The mobile fraction is calculated by the extent to which the initial fluorescence F (t < 0) is regained by the end of the experiment
(1)
Fluorophores immobile on the time scale of measurement are indicated by mobile fractions of less than 100%. In calculating transport coefficients, it is assumed that spontaneous recovery of fluorescence does not occur and the probe beam does not itself induce photobleaching. If recovery occurs by lateral diffusion, the diffusion coefficient, D, is given by
(2) where ro is the 1/e2 radius of the Gaussian profile laser beam used for both photobleaching and measuring fluorescences, and γ is a parameter that
1.1. Instrumentation
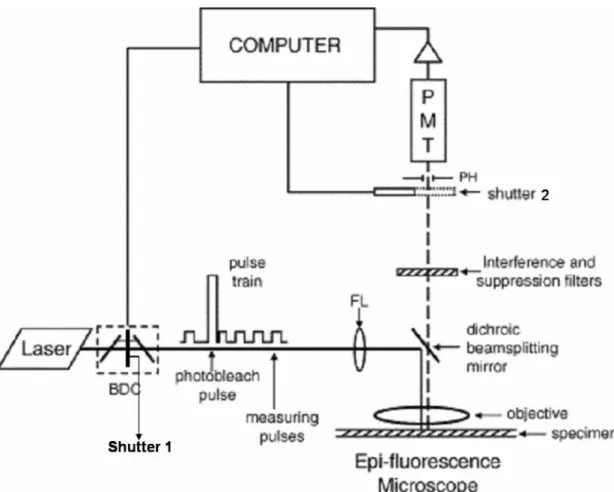
FRAP measurements require three major components: (1) a laser, operating in the TEM00 mode which produces a Gaussian intensity profile, that serves as the excitation source for both photobleaching and measurement of fluorescences; (2) a microscope equipped for epifluorescence; and, (3) a detector for the fluorescence emission combined with electronics to record the measured fluorescence intensity. Fig. 2 shows a schematic diagram for the optical and electronic elements in a FRAP system such as described above. A beam divider and recombiner (Koppel, 1979) is placed in the light path
between the light source and the microscope. This device, consisting of two optical flats placed at +45° to the optical axis, divides the laser beam into two beams and then after an arbitrary distance recombines them on the optical axis. One beam serves as a high power bleaching beam, and the other is for measuring the fluorescence by exciting the specimen with low power. A shutter is placed after the first optical flat in the path of the high power beam to block it during the time of recovery. This shutter only opens during the photobleaching step, which generally takes one hundred milliseconds or less. Mechanical shutters that can open and close in a few milliseconds are
convex lens (Kusumi) on the primary image plane in the excitation path. In this case, the beam radius on the specimen plane is approximately that on the primary image plane divided by the magnification of the objective. The
specimen is therefore excited or bleached by the laser in a very small area that is determined primarily by the power of the objective.
The fluorescence emitted from the specimen is detected with a cooled photomultiplier (PMT) placed on or near an image plane of the microscope. Cooling can reduce the noise by 100-fold when the temperature drops from room temperature to −25 °C. Water-cooled thermoelectric elements are preferable to fan-driven air-cooling because the fan vibrations will be transmitted through the microscope. To avoid physical damage caused by exposing the PMT to fluorescence excited by the bleaching beam, another shutter blocks the PMT only when the specimen is being bleached. The signal, a photocurrent, from the PMT is amplified and passed to a computer for
analog to digital conversion if required and recorded by a multichannel, multiscaling card. A photon counting photomultiplier is used and pulses from the PMT are counted on a multiscaling analyzer card in the computer. Often a pinhole is placed on the image plane just before the PMT—this serves to eliminate out-of-focus fluorescence, much as in a confocal microscope (Koppel, 1979). A computer is also employed to control the entire FRAP experiment. The investigator can set the timing of the opening and closing of the shutters, control the length of data collection period or make other optional commands for the system, such as background noise collection and the
1.2. Analysis of recovery curves
A number of procedures have been developed to extract diffusion coefficient from fluorescence recovery curves (Elson and Qian, 1989; Koppel et al., 1976; Petersen and Elson, 1986; Soumpasis, 1983). Axelrod et al. (Koppel et al., 1976) have developed spot photobleaching analysis
This allows one to determine if it is justified statistically to employ an
additional component to fit the data. Fitting to more than two components is difficult unless the recovery curves have a high signal to noise ratio.
2. Fluorescence correlation spectroscopy (FCS)
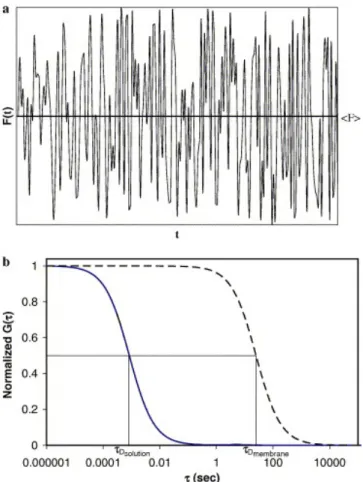
Fluorescence correlation spectroscopy (FCS) is another technique which can be used to study translational mobilities in membranes. Similar to FRAP, this method requires molecules of interest to either be fluorescent or, alternatively, be conjugated to a fluorescent dye or protein. In this method, the fluctuations in the fluorescence intensity from a minute sample observation volume are recorded and temporally autocorrelated to reveal information about the concentration and dynamics of the fluorescent species in the
sample (Fig. 3). Recent technological advances have revived FCS as a useful technique for measuring translational mobilities in solution including in the cytoplasm and nucleus as well as in cellular membranes. FCS has been the subject of many recent reviews (Bacia and Schwille, 2003; Elson, 2004;
Haustein and Schwille, 2004; Hess and Webb, 2002; Levin and Carson, 2004; Thompson et al., 2002) and a book (Rigler and Elson, 2001).
The instrumental set-up for FCS is very similar to that required for FRAP with the major exceptions typically being the addition of a hardware correlator but no high intensity photobleaching light beam (Fig. 2). There are many procedural differences though. To start, because the measured signal in an FCS experiment constitutes fluctuations from the time averaged
defining a very small observation volume and by analyzing very dilute samples such that only very few molecules are present in the observation volume at any one time. The sample observation volume is in most cases defined by focusing a laser to a diffraction-limited spot in the sample plane. The observation volume is further limited by placement of a pinhole in an image plane in front of the detector which essentially limits collection of emitted photons to those emanating from the specimen plane. Alternatively, FCS has also been used with total internal reflection fluorescence excitation in conjunction with a pinhole (Lieto et al., 2003) or by two photon excitations (Berland et al., 1995) and (Schwille et al., 1999a). Commercial versions are available from Carl Zeiss (ConfoCor2, www.zeiss.com), Leica (FCS2, www.leica.com) and ISS (Alba, www.iss.com).
The theoretical framework of FCS was originally described in the early 1970s (Magde, ; Magde et al., 1974; Schwille et al., 1999a). The normalized fluorescence fluctuation autocorrelation function is given by
(3)
where δF(t) is the difference between the instantaneous fluorescence at time t and the time average of the fluorescence intensity, left angle bracketFright-pointing angle bracket,
and τ is the correlation time. Numerous forms of the autocorrelation function have been derived to account for a variety of experimental conditions. In general these forms are dependent on the shape of the observation volume, the detection efficiency and on the properties of the studied fluorophore.
In the case of a free diffusion in three dimensions and with a Gaussian observation volume, the temporal autocorrelation function G(τ) is given by
(5)
where N is the number of fluorescent molecules in the observation volume,
τ1/2 is the characteristic diffusion time and is a measure of the average time it takes a fluorescent molecule to diffuse through the observation volume, and ro and zo are the radial and axial distances where the laser intensity of the observation volume has decayed to 1/e2. In the case of diffusion within a membrane (diffusion in two dimensions; limit as zo → 0), the autocorrelation function G(τ) is given by
(6)
diffusion coefficient, D, of the fluorescent molecule is calculated from the characteristic diffusion time, τ1/2
(7)
where the distances ro and zo are obtained by careful independent calibration of the sample observation volume with a fluorescent dye of known solution diffusion coefficient (i.e., Rhodamine-6-G; D = 280 µm2/s). Autocorrelation functions for a fast and a slowly diffusing species are given in Fig. 3B. It is also possible to calculate the concentration of fluorescent molecules in the sample, C] from
(8)
where NA is Avogadro’s number and V is the sample observation volume which for a typical Gaussian confocal volume is given by
(9)
In general, FCS can measure diffusion coefficients over five orders of magnitude ranging from diffusion of small molecules in solution (similar300 µm2/s) to the diffusion of membrane proteins within cell membranes
through the observation volume. To date, FCS has been used to measure diffusion of fluorescent lipids and proteins in model membranes including giant unilamellar vesicle (GUV) membranes (Bacia et al., 2004; Kahya et al., 2003; Kahya et al., 2004; Korlach et al., 1999; Schwille et al., 1999a; Schwille et al., 1999b) and in cellular plasma membranes (Bose et al., 2004; Hegener et al., 2004; Schwille et al., 1999a) as well as diffusion of fluorescent
molecules within the cytoplasm (Hegener et al., 2004; Schwille et al., 1999a; Watanabe et al., 2004) and the nucleus (Politz et al., 1998; Watanabe et al., 2004).
Potential problems with using FCS for measuring translational
mobilities within a cell membrane include the difficulty associated with aligning the observation volume to coincide with the membrane. Another problem is that the depth of the observation volume (not, vert, similarµm) is significantly larger than the thickness of biological membranes (not, vert, similar10 nm) which can lead to mixed sampling of the mobility in the membrane and adjacent aqueous surrounds. This problem can be avoided by selecting probes with high membrane specificity or probes whose quantum yield is significantly larger when located in the hydrophobic interior of the membrane as opposed to adjacent aqueous surround. Problems with aligning the
observation volume to coincide with a membrane have been addressed in some commercial instruments by combining FCS with confocal microscopy. Using this set-up one may first align and image a particular membrane by confocal microscopy and subsequently switch to FCS. Cellular
proteins that emit in the red part of the spectra (i.e., DsRed, Cy5). For a more thorough discussion of these limitations and others see the reviews by
Schwille and workers (Bacia and Schwille, 2003) and Webb and co-workers (Hess and Webb, 2002) and the recent book on FCS (Rigler and Elson, 2001).
3. Single particle tracking (SPT)
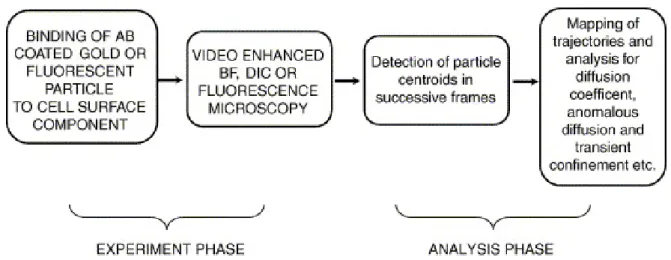
Single particle tracking (SPT) is a powerful method for studying the movement of individual or small groups of proteins or lipids in the plasma membrane of live cells or in model membranes. The dynamic behavior of these molecules can be recorded and then analyzed to reveal the
PAL standard have a frame rate of 25 Hz. However, SPT has been performed with specialized video cameras that have time resolution of 25 µs (Fujiwara et al., 2002). The SPT experiment is depicted schematically in Fig. 4.
3.1. Methodology
To make gold particles traceable markers for membrane molecules, they are coated with antibodies or ligands that can either directly or indirectly bind to the target surface molecules. Conjugation of gold to antibodies
requires care and has been described in several publications (Fujiwara et al., 2002; Politz et al., 1998; Simson et al., 1998). In addition to gold particles that users themselves conjugate to antibodies or ligands, there are now several commercial ready-to use options, such as gold particles covalently coated with anti-biotin, anti-mouse IgG antibodies, streptavidin and protein A (BBInternational Ltd., Britain). In the case of indirect binding between gold particles and surface molecules, cells are first incubated with primary antibodies that specifically recognize the target molecules on the cell membrane, and after washing out the excess primary antibodies, gold
particles coated with appropriate agents are applied to the cells. After excess non-bound gold particles are removed by washing, cells are mounted on a slide and sealed with wax. In this way, the sample can be observed using an inverted microscope oil condenser to provide maximum resolution in the image.
Single gold particles can be imaged in bright field by employing analog and digital contrast enhancement (Lee et al., 1998; Simson et al., 1998). In our version, a bright field 100X oil immersion objective (NA 1.3) and an oil-immersion condenser (NA 1.4) are employed. The images are further
magnified by a factor of four (total magnification of 400X) and projected to a Hamamatsu Newvicon camera (Bridgewater, NJ). After background
subtraction and contrast enhancement by image processing software (Image-1, Universal Imaging, West Chester, PA), the processed video images are displayed on the monitor and recorded by a recording device (such as the computer hard drive, DVD disc or video tape) in real time. Video enhanced differential interference contrast microscopy (DIC) can also be used to image gold particles (Gelles et al., 1988).
process. In addition, the tracking software should be able to fit the image of the shape of the gold particles with a kernel of choice and find the centroid of the particle with sub-pixel precision. To choose appropriate tracking software, careful tests using sample movies of single particles moving under various conditions, including the presence of multiple particles, or in fields with dark spots as part of the background, are required. Nevertheless, even the best tracking software does not always work in certain situations. Therefore it is essential to have a manual track function built in the software, letting the user instruct the program where to find the single particle with a cursor.
For most SPT experiments, it is common to have more than 1000 frames in a single movie file, which usually exceeds 700 Mb. Therefore it is important for the computer to have both fast processing speed and large data storage capacity.
3.2. Rudimentary analysis of trajectories
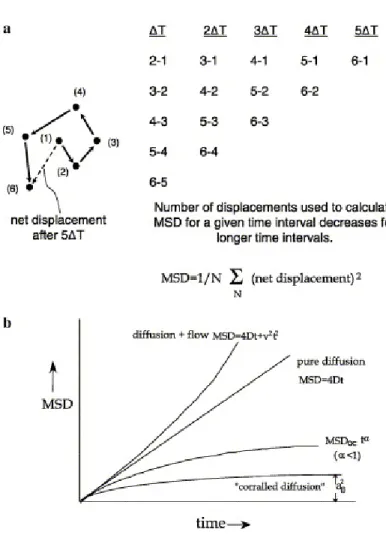
A schematic of how lateral diffusion coefficients can be calculated from a single particle trajectory is given in Fig. 5a. The x-y coordinates of single particles in each frame of the movie are located by the selected tracking software. After converting the trajectories in the movies into lists of x- and y-positions in time, the displacements are calculated for each time interval, ∆t. As one can see, there are fewer data points as the time interval grows so the uncertainty at long time intervals is correspondingly greater (Qian et al., 1991). The displacements are squared and averaged to give the mean square
(10)
However, one of the most interesting and revealing aspects of SPT is the analysis of departures from random diffusion. For example, such analyses have yielded confined diffusion of particles on various time scales (Dietrich et al., 2002; Fujiwara et al., 2002; Simson et al., 1995), anomalous diffusion (for review, see (Saxton and Jacobson, 1997)) or directed flow of particles
(Sheetz et al., 1989) (figure 5b). The relationship between confined diffusion and membrane structure and function has been interpreted in terms of
Chapter 4: Hardware and software engineering for lateral diffusion measurement-- Configuration of the FRAP system
Introduction
As mentioned in Chapter 2, FRAP measurements with a wide field microscope require three major components: (1) a laser, operating in the TEM00 mode which either produces a Gaussian intensity profile, or with a pinhole, a circular intensity profile, that serves as the excitation source for both photobleaching and measurement of fluorescences; (2) a microscope equipped for epifluorescence; and, (3) a detector for the fluorescence emission combined with electronics to record the measured fluorescence intensity. A pair of shutters (shutter 1 and 2 in figure 2) is placed to control the passage of light during the FRAP process: shutter 1 is placed between the beam divider and combine; shutter 2 is placed in front of the PMT. The timing of the opening/closing of the shutters is very important in order to protect the PMT from overexposure due to the overloading of photons while
photobleaching and collect critical initial recovery data at the moment
the algorithm for the detection of transient confinement zones out of the trajectories recorded in single particle tracking experiments.
FRAP
Hardware
The mechanical shutters controlling the passing of the laser beam were purchased from Uniblitz. The control board (BNC 2120) was purchased from National Instruments. The beam splitters were purchased from Newport. The multiscalar card which is connected to the PMT was purchased from MSC cooperation . The PC which conveys the electric commands to the control card is a PC installed with Windows 98 operating system. The control board is connected to the PC, the mechanical shutters, and the multiscalar card.
Timing program
The Visual basic module for the National Instruments control board was also purchased from National Instruments. The module was used to program the timing of sequential operations during FRAP. The algorithm for the timing program is listed below:
(1) Once the start button of the FRAP program is hit by the user on the computer screen, a TTL signal is sent to trigger the multiscalar card to start counting the input intensity. The shutter blocking the bleaching laser beam placed in the middle of BDC is now set at the closed position (figure 2), thus the bleaching beam cannot pass through sample. The shutter placed before PMT is set at the open position so that multiscalar card is reading the
(2) When the timer reaches the time set to start the photobleaching, the control board sends a signal to open the shutter after beam splitter to allow the bleaching laser beam to pass through and bleach the fluorophores in the sample. Simultaneously the shutter before PMT is set closed to protect PMT from damage caused by overexposure. Therefore no fluorescence readout is available during the bleaching period.
(3) After the photobleaching is completed, the control board resets the shutters: the shutter after the beam splitter is closed again and the shutter before the PMT opens again. The recovery of the fluorescence is now being recorded with the user-specified sampling rate.
(4) When signal collection is finished (the length of such period is set by users), the control board sends another TTL signal to the multiscalar card to stop the recording and start transferring the data to the PC from the built-in memory of the multiscalar card. The data will be stored as a 2-column text file, with the first column being time points and the second one being the
fluorescence intensity (amplified by the PMT).
Data Fitting
We adopted the method published previously by Gordon et al. (Gordon et al., 1995). The fitting procedure is based on Marquardt algorithm to
(Eq. 1) K is a measure of the fractional depth of bleach, F(O)/Fi.
(2) The one-component model takes the form
(Eq. 2) where F(t) is the intensity at time t, Φ represents the mobile fraction (), and f(t )is the series
(Eq. 3) where T is the characteristic time of diffusion.
(3) To form the two-component model, two one-component recovery curves are added together. The subscripts 1 and 2 distinguish the two diffusing components with a common K value. The model is based on the two series
(Eq. 4) and
(Eq. 5) (4) Now the two-component model then becomes
(Eq. 6) where α is the fraction of component 1. This model has six parameters: K,
though the six-parameter model works well, the five-parameter model below performs better at lower signal levels and, thus, the five-parameter model was used to produce the results in the present report. Substituting Eq. 1 for
F(O) in Eq. 6 and rearranging yields
(Eq. 7) (5) In Equation 7 the three parameters α, Φ1, andΦ2 occur only as the products amp and (1 - α)Φ2, indicating that they are dependent. The two products are used in place of the three original parameters, which yields two independent parameters (αΦ) and (1 - α)Φ2) for a total of five parameters. The two products are the mobile fractions weighted by the component fractions (weighted mobile fractions). It is not possible to determine uniquely either the mobile fractions or the component fraction, but only the weighted mobile fractions. The fraction of the fluorescence due to immobile molecules of both components (net or aggregate immobile fraction), before the bleach is 1 - (αΦ1 + (1 -α)Φ2).
The curve fitting algorithm is listed below:
(2) Smooth the recovery curve (optional). A smoothed point is created by taking a contiguous group of points in the raw recovery curve and replacing the group with a single point usually derived by averaging the group or
interpolating within the group. The smoothing algorithm reported by Petersen et al. (Petersen et al., 1986) is modified. In the beginning, only one raw data point is counted as a group until reaching the first postbleach point, after which the group size is increased by two points. The group size keeps increasing by points after every 2 groups of data points are processed. This strategy allows sampling the fast early rising part of the curve best and smoothes the late, slow rising part the most.
(3) Use the three-point fit estimates as the starting guesses for a
one-component fit, which assumes the one-one-component model above (Eq. 2). The results of the one-component fit are recorded and also used to generat starting guesses for the two component fit, which assumes the
two-component model above (Eq. 7). For both models the number of terms of the series (Eq. 3 for the one-component model or Eqs. 4 and 5 for the
two-component model) increased with the estimated value of K as in the report by Petersen et al. (Petersen et al., 1986). The numbers of points of the recovery curve to be analyzed are varied by the user. The results of the analysis program are the fitted parameters, the reduced Χ2 values for the one- and two-component fits, and the F-test values comparing the two fits. The fit with higher F-test value is selected as the model better fitted the FRAP curve.
TCZ detection program (rewritten in Matlab)
In order to perform batch analysis, the TCZ detection program was redesigned to enable the selection of multiple files before analysis starts. In the new program, the result for each file selected is stored in the specified directory. Furthermore, a spreadsheet listing the statistics of the analysis results is also generated and saved.
The algorithm for TCZ detection used in this new program is the same as the previously described one, which was developed by Simson et al. (Simson et al., 1995) (also see the details in Chapter 4).
Evaluating centroid detection algorithm for particle tracking purpose In work with Shawn Janiro, a Biomedical Engineering graduate student of master degree, whom I supervised, we evaluated the available programs for dynamic centroid detection used to the trajectory of mobile particles. The programs under investigation include video spot tracker (created by Dr. Russel Taylor from Computer Science Department at University of North Carolina), Labview NI vision component (National Instruments, Texas), Metamorph (Universal Imaging), and IDL (RSI, Colorado). Accuracy, efficiency, user-friendliness, and module-based functionality expansion are evaluated for each program. And it is determined that IDL v 6.3 has the best overall performance. IDL can detect the centroid of a moving particle, whose trajectory is known, with less than 3% error rate even in a noisy and
fluctuating background. In addition, IDL provides capacity to build on the basic tracking routine for future more specific use. Users can track objects by
Chapter 5: Transient confinement zones: a type of lipid raft?
Many important signaling events are initiated at the cell membrane. To facilitate efficient signal transduction upon stimulation, membrane
microdomains, also known as lipid rafts, are postulated to serve as platforms to recruit components involved in the signaling complex, but few methods exist to study rafts in vivo. Single particle tracking provides an approach to study the plasma membrane of living cells on the nanoscale. The trajectories of single gold particles bound to membrane proteins and lipids are
characterized in terms of both random and confined diffusion; the latter occurs in “transient confinement zones”. Here we review transient confinement zones and some of their implications for membrane structure and function.
Introduction
includes glycosylphosphatidylinositol (GPI)-anchored proteins and certain transmembrane proteins (Brown and London, 1997; Brown and London, 1998; Brown and Rose, 1992). Although detergent-resistant membranes (DRM) are postulated to represent putative submicron-sized lipid rafts on the cell surface (for reviews, see(Jacobson and Dietrich, 1999; Kusumi et al., 2004; Simons and Ikonen, 1997; Simons and Ikonen, 2000; Simons and Toomre, 2000)), the in vivo correlate of DRM has not been established. In detergent extraction experiments, the lipid and protein compositions of DRM depend strongly on the nature and concentration of the nonionic detergent used, as well as the time and the temperature of the extraction (Schuck et al., 2003; Shogomori and Brown, 2003). Moreover, it has been observed that the nonionic
detergent Triton-X can promote formation of microdomains in model membranes(Heerklotz, 2002).
Therefore, assuming DRM are lipid rafts could provide a grossly
misleading view of membrane microstructure. Different approaches other than detergent extraction are required to test the lipid raft hypothesis.
Usually, light microscopy resolution is limited to ~250 nm, meaning that microdomains smaller than this cannot be measured, although they can be detected if they are bright enough. By fluorescence microscopy, many raft components, as defined by detergent extraction, appear uniformly distributed although there are notable exceptions (Malinska et al., 2003); but clustering can be seen by fluorescence resonance energy transfer in some cases (Sharma et al., 2004; Zacharias et al., 2002).
particles to molecules on the cell membrane, the dynamics of a small number of molecules or even a single molecule can be recorded and studied by tracing trajectories of the particles. SPT has two advantages: (i) The particles used give a signal that does not photobleach, thereby extending the
observation time; and (ii), 40-nm gold particles are small enough to reduce the chance for perturbation. Available detection methods are based on the
intense Rayleigh scattering, which can be applied to submicron particles down to 30 nm in diameter. Although SPT presents insights about membrane
structures, it does have limitations. The path of single particles is not controllable, and SPT only covers a small area of the cell membrane. Also, when coating specific antibodies on the gold particles, it is very difficult to achieve precise valence control, meaning that more than one surface molecule may anchor the particle to the cell membrane. Rather than being exclusively 2-D random walks, the trajectories of single particles that are attached to surface molecules on the cell membrane often exhibit a variety of trajectories in addition to random walks. These include directed movement, confined movement, and anchored behavior (Fig. 6) (Simson et al., 1995; Simson et al., 1998), a result not explicitly anticipated by the Singer-Nicolson fluid mosaic model. Temporary confinements (Fig. 6B) are detected in the trajectories of membrane proteins that cannot be accounted for by the large family of random walks (Simson et al., 1995). These temporary confinements are termed transient confinement zones (TCZ). The existence of TCZ supplies another piece of evidence supporting membrane lateral heterogeneity,
although the mechanism of transient confinement remains to be elucidated.
When the lateral mobility of surface molecules on the cell membrane is examined by SPT, careful analysis is required to characterize the molecular trajectories. To be able to distinguish confined diffusion or directed transport, both of which reveal interesting biological features, from simple Brownian motion, it is necessary to establish algorithms that can justifyably reject those random walks that might look confined or directed.
Saxton (Saxton, 1993) has studied the 2-D diffusion in a series of Monte Carlo simulations. For 2-D random walkers, the probability j that a molecule, having diffusion coefficient D, will stay in a region of radius R, for a period of time t is given as
(1)
This allowed Simson et al. (17) to develop an algorithm that detects confinements due to nonrandom means. Simson et al. introduced the probability level index L to characterize the probabilities of nonrandom confinements. The relationship between
L and f is:
(2)
The higher the value of L is, the more likely a particle is confined due to a nonrandom mechanism. Because a random walk can temporarily mimic confinement, the goal of this algorithm is to reject those random walks that look like transient confinement.
with both actual and simulated data, an optimized threshold (Lc) value is obtained so that the algorithm is able to detect real confinement with a minimal error rate less than 0.07% and to reject mimicked ones with an accuracy of about 98.5%. Simson’s algorithm also implements a low pass filter to smooth the probability profile (Simson et al., 1995), thereby
suppressing short-lived mimicked confinement from Brownian motion. After applying the algorithm to SPT trajectories, TCZ are detected, and the sizes and dwell time of particles in the TCZ are computed. The computed sizes of confinements and dwell time of particles in TCZ are dependent on the time resolution of SPT. That is because with greater time resolution, two different confinements that are very close are more likely to be distinguished. At lower time resolution, such a structure will appear as a single bigger confinement with a longer dwell time. For this reason, before comparing transient
confinement analysis results in terms of size and dwell time, it is important ensure the data were acquired at similar time resolution.
Example of TCZ
Previous papers from our group have reported TCZ being detected by SPT for GPI-anchored proteins, glycosphingolipids (GSL), and phospholipids (Dietrich et al., 2002; Sheets et al., 1997; Simson et al., 1995; Simson et al., 1998). These TCZ are of a size ranging from 100 to 300 nm in diameter, and the diffusing particles are trapped for several seconds. Moreover, upon the suppression of GSL synthesis (Sheets et al., 1997) or depletion of cholesterol (Dietrich et al., 2002), the abundance and the size of the zones were
could be revisited after particles escaped, suggesting that zones could be stable for tens of seconds and that diffusion within the zones was reduced by a factor of ~2, which was consistent with the particle diffusing within in a cholesterol-rich, liquid-ordered state. These experiments indicate that TCZ exhibit some of the physical and chemical characteristics postulated for hypothetical lipid rafts.
A few other examples of confinement have appeared in the literature. Daumas et al. (Daumas et al., 2003a; Daumas et al., 2003b) have studied the diffusion of a G-protein-coupled receptor, the µ-opioid receptor, by gold particle SPT. In their experiments, they observed transient confinement as well. However, they fitted the data to a different mathematical model, in which the diffusing surface proteins are confined to a domain which itself diffuses, the
confinement being due to “long-range attraction between membrane proteins.” In other words, the surface proteins belong to a “walking confined diffusion mode” composed of long-term random diffusion of a domain characterized by D = 1.3 × 10⁻³ µm2/s and short-term confined diffusion within the domain characterized by D ~ 10−1 µm2/s.
resulted in long periods of confinement characterized by very limited slow movement interspersed with periods of rapid particle movement. The transient confinements were spatially associated with gephyrin- GFP clusters visualized by fluorescence microscopy. And diffusion coefficients of particles during confined periods were 1–1.5 orders of magnitude lower than those measured during rapidly moving periods. Based on these observations, Meier and colleagues (Meier et al., 2001) speculated that limited diffusion of receptors during the confined state may be due to slow diffusion of the entire gephyrin cluster with bound receptors.
Transient confinement is induced by cross-linking
Fine details of membrane lateral diffusion. A continuing puzzle is why diffusion coefficients of membrane lipids are reduced
by a factor of 5–20 from those on artificial bilayers (Jacobson et al., 1987; Lee et al., 1993; Ritchie et al., 2003; Sonnleitner et al., 1999; Subczynski and Kusumi, 2003). To address the problem, Fujiwara et al. (Fujiwara et al., 2002; Murase et al., 2004b) measured the movement of 1,2-dioleoyl-sn-glycero-3-phosphoethanolamine (DOPE), which by virtue of its two unsaturated acyl chains, is considered to be a typical nonraft lipid. By using SPT with an ultra-high temporal resolution of 25 µs per frame, as opposed to the conventional video sampling rate of 33 ms per frame, they found that the cell membrane is compartmentalized with regard to translational diffusion of DOPE. That is,a single DOPE molecule is temporarily confined within a 30 to 230-nm
This compartmentalization is dependent on the actin-based cytoskeleton underneath the cell membrane but is not sensitive to the removal of extracellular matrix or cholesterol.
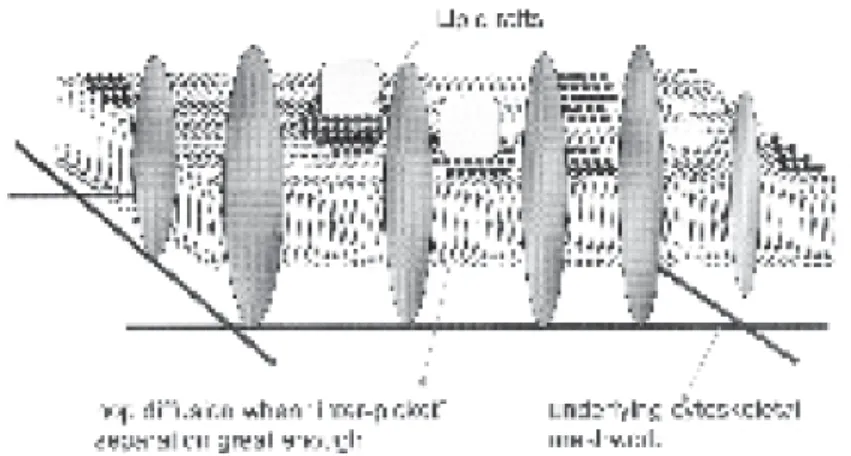
To explain their results, they proposed a membrane picket fence model (Fig. 7) (Fujiwara et al., 2002; Ritchie et al., 2003). In the model, both lipids and proteins, regardless of their raft association, exhibit free diffusion at rates comparable to those on artificial membranes within plasma membrane
compartments that are delimited by immobilized transmembrane proteins as anchored-pickets linked to the subjacent membrane cytoskeleton. The
occasional hop to an adjacent compartment, which occurs roughly once every 11 ms, rate-limits the long-range diffusion. However, even if the effect from hop diffusion is taken into account, it does not completely explain the smaller long-range diffusion coefficients of GPI-anchored proteins such as Thy1 measured by SPT at 33 ms time resolution (Dietrich et al., 2002). The
implication is that aggregation of proteins and/or lipids is the major reason for the reduced motion of surface molecules, primarily because the gold particles are pauci-valent. Indeed, it is plausible to regard the TCZ as a membrane domain that attracts certain crosslinked entities and thereby transiently confines these surface complexes.
Moreover, under these apparently monovalent conditions, no TCZ were observed at 33-ms resolution (Kusumi et al., 2004; Subczynski and Kusumi, 2003). By contrast, when the gold particles were deliberately made multivalent by coating the particles with intact antibodies at high concentration, short-range CD59 diffusion was considerably slower and TCZ were detected at 33-ms time resolution (Kusumi et al., 2004; Subczynski and Kusumi, 2003). This suggests that some form of cross-linking is required to observe TCZ.
Interestingly, cross-linking-induced TCZ required cholesterol, intact actin filaments, and Src family kinase (SFK) activity. Intracellular calcium signals were closely associated in time with the formation of the TCZ. Taking all their data together, the Kusumi group (Ritchie et al., 2003) now suggests that lipid rafts are so small and short-lived in resting cells (Fig. 7) that a non-cross-linked single raft protein has almost the same short-range diffusion coefficient as a nonraft lipid molecule.
However, upon cross-linking, the molecular cluster caused by multivalent gold particles not only diffuses more slowly but also triggers processes that stabilize lipid rafts. These cross-linked complexes are termed “cluster rafts.” Cluster rafts are formed by various cross-linking agents
To examine and verify the model proposed by Kusumi group (Ritchie et al., 2003), our laboratory now is investigating the behavior of other
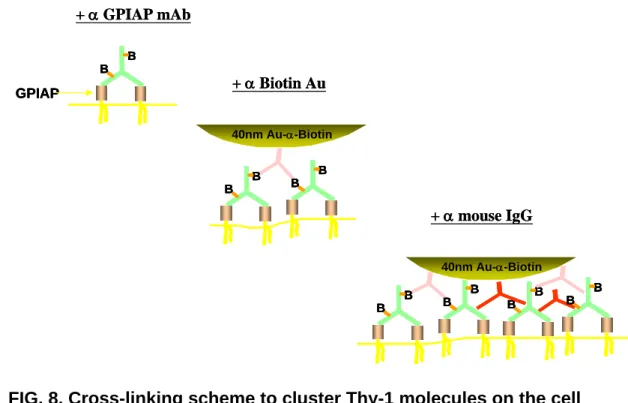
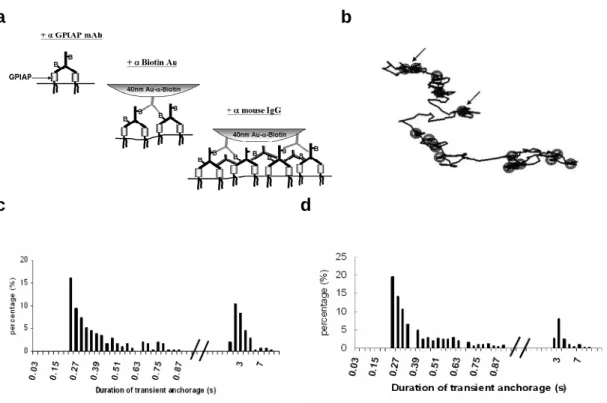
GPI-anchored proteins by SPT. To achieve maximal cross-linking, we incubated C3H fibroblast cells first with biotinylated anti-Thy1 antibodies, then anti-biotin antibodycoated
colloidal gold particles, after which anti-mouse IgG antibodies were added (Fig. 8). We observed that maximal cross-linking increased the percentage of time (the relative confinement time, RCT) that a single particle spends in TCZ by more than twofold compared with control treatments without anti-mouse IgG applied. Under these conditions, we observed repeated transient
anchorage, which means, in our experiments, that the displacement range of the particles is within ~20 nm for several seconds before the gold particles resume their trajectories on the cell membrane. The transient anchorage observed in maximal cross-linking experiments is distinct from conventional transient confinement. Whereas in normal transient confinement gold particles are localized in an area ranging from 100 to 300 nm in diameter, in which the particles move with a reduced diffusion coefficient, transient anchorage apparently stops the gold particles (to <20 nm). Addition of SFK inhibitor 4-amino-5-(4-chlorophenyl)-7-(tbutyl) pyrazolo(3,4-d) pyrimidine (PP2) reversed the RCT increase owing to transient anchorage, indicating SFK play a role in cross-linking-dependent TCZ formation/stabilization.
these crosslinking-induced effects are quite general. In summary, confined behavior can be broken into two classes: true in-plane transient confinement and transient anchorage (SFK-mediated) of cluster rafts, as depicted in Figure 9. It appears that SPT can be used to reveal details of the early steps in
crosslinking- induced signal transduction.
Chapter 6: Mechanisms of transiently anchoring cross-linked glycosyl-phosphatidylinositol-anchored proteins to the membrane associated cytoskeleton -- Signal transduction via membrane nanodomains
cholesterol dependent, SFK-regulatable linkage between a transmembrane cluster sensor and the cytoskeleton.
Introduction
The general signaling mechanisms by which cross-linking of membrane determinants induces linkage to the cytoskeleton is a long standing issue dating back to the original patching and capping observations (Raff et al., 1970) and the ideas of Singer (Holifield et al., 1990; Singer, 1977). More recently such attachments have assumed clearer physiological and pathological importance. For example, receptor-induced dimerization (Lidke et al., 2005) causes retrograde transport off the filopodia to distal sites for further processing. Bead induced clustering of integrins and CAMs causes retrograde transport of these molecules away from the leading edge and considerable effort has been devoted to the manner by which different sized ligand-coated beads induce clusters of cell adhesion molecules to link to the retrograde actin flow (Felsenfeld et al., 1996; Suter et al., 1998; Suter and Forscher, 2001). Viral particles, after binding to membrane receptors, are eventually associated with the cytoskeleton in different ways (Ewers et al., 2005; Pelkmans et al., 2002). T cell activation, initiated by ligation, is mediated by TCR-containing microclusters that reorganize in an actin-dependent manner (Yokosuka et al., 2005).
early on to induce an association with Src family kinases (SFKs) (Stefanova et al, 1991). Cross-linking the GPIAP, Thy-1, on T lymphocytes results in mitogenesis. (Kroczek et al., 1986; Zhang et al., 1992). Group B coxsackieviruses start the process of infection of epithelial cells by binding to and then clustering the GPIAP co-receptor, decay-accelerating factor (DAF), on the apical surface (Coyne and Bergelson, 2006). Transmembrane signaling has been speculated to occur in nanodomains such as lipid rafts when clusters are induced via receptor ligation and cross-linking (Simons and Toomre, 2000) and such signaling may serve to link the cluster to the cytoskeleton (Kusumi et al., 2004). But the precise mechanisms of how GPIAPs signal and link to the cytoskeleton remain to be elucidated. This issue remains central in the study of the functionality of membrane microdomains (Kusumi et al, 2004).
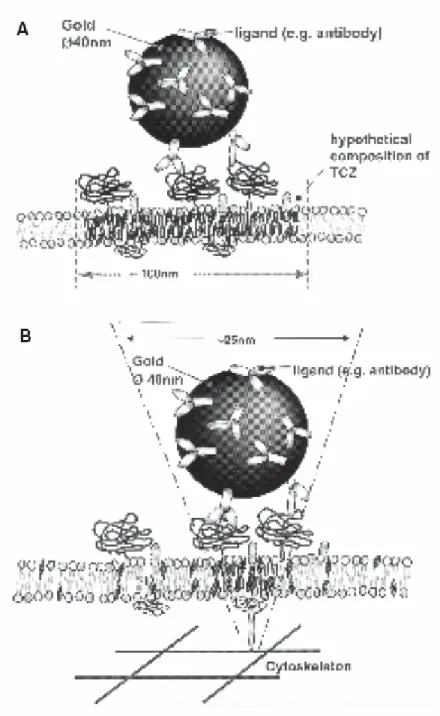
membrane molecules bound to gold so as to minimize artifacts due to cross-linking membrane molecules (Murase et al., 2004a). By contrast, in this study, we deliberately used the gold particle to form clusters of GPI-anchored proteins, mimicking the clusters formed under physiological conditions. The size of clusters associated with gold particles is much smaller than the size of clusters which were seen by immunostaining in previous studies (i. e. patches), which may represent on the order of 1000 molecules (Holifield et al., 1990). This protocol produced a unique nanoscale signature in the SPT trajectories, termed transient anchorage, that depends on Src family kinases (SFKs), PI3 kinase, cholesterol and caveolin-I. In some respects, our study confirms and extends the unpublished studies of Suzuki et al. (Suzuki et al., 2002) using the GPI-anchored protein, CD59. A transmembrane protein, the cystic fibrosis transmembrane conductance regulator (CFTR), also exhibits transient anchorage that strictly depends on its C-terminus PDZ binding domain but it is regulated differently than the GPIAP anchorage.
Results
Transient Anchorage
cross-linking antibodies (figure 11a), in order to collect the GPI-anchored proteins of interest together under and proximate to a single gold particle. The trajectories of these clusters on the cell membrane reveal how signal transduction influences the lateral motion of GPI-anchored proteins that are sufficiently cross-linked.
in the trajectory in which transient anchorage was detected were removed and the trajectory concatenated. This operation resulted in decreased relative confinement time in trajectories in which transient anchorage was detected. Transient anchorage only occurred after the addition of the tertiary antibodies (figure1 a, bottom right) and showed titration behavior (table 1) so that there was an optimum at a dilution of ~ 1:100 with the final concentration of 20 ug/ml. The dependence of transient anchorage on the concentration of tertiary antibody suggests that a critical size and/or number of cross-linked GPI-anchored proteins is required for transient anchorage (Harder and Simons, 1999). Having too many tertiary antibodies will result in a competition for the available binding sites offered by the primary antibodies; this will lead to monovalent binding of the tertiary antibody with diminished cross-linking and transient anchorage.
Transient anchorage also occurs with preassembled complexes: estimate of cluster size
Therefore, we pre-assembled gold particle-antibody complexes to test whether transient anchorage would still occur. These complexes contain anti-biotin gold with anti-biotinylated anti-mouse-IgG antibodies and anti-Thy-1 antibodies. An approximation to the number of primary antibodies bound to each gold particle in the pre-assembled complexes was made by estimating the contact area between the gold particle and cell membrane (see Supplemental Methods). The estimate suggests that the maximal number of gold-bound Thy-1 molecules is likely to be less than 135 and probably much less. These pre-assembled complexes exhibited transient anchorage, although the relative anchorage time was somewhat reduced (20%) compared to the original protocol (28%) (Figure S2b). The bi-modal distribution of anchorage times was similar to that seen in the maximal cross-linking SPT experiments (Figure 11d). Thus, a cluster of less than 135 GPIAPs is sufficient to induce transient anchorage.
Regulation of transient anchorage
Role of cholesterol: To examine the role of cholesterol, which is found
transient confinement upon cholesterol depletion consistent with previous studies (Dietrich et al., 2001; Sheets et al., 1997).
Role of Src family kinases: GPI-anchored proteins, such as CD59 and
Thy-1, are found to couple with SFKs which are distributed in the inner leaflet of the cell membrane, in order to effect signal transduction (Stefanova et al., 1991). It has also been shown that filamentous actin accumulates under patches of GPI-anchored proteins (Harder and Simons, 1999). The actin enrichment requires activities of Fyn and Lck kinases (Harder and Simons, 1999), both of which belong to the Src family. A plausible hypothesis is that SFKs mediate the process of tethering the cross-linked GPI-anchored protein clusters to the membrane associated cytoskeleton. Indeed, a form of transient confinement with the GPI-anchored protein, CD59, has been shown to be mediated by Lck (Kusumi, 2004). Hence, we treated cells with the specific SFK inhibitor, PP2, prior to the cross-linking. Transient anchorage was completely suppressed for both GPI-anchored proteins tested (figure 12a), indicating SFKs are critical for the stabilization of the clusters. Transient confinement, however, was not significantly affected. Since transient anchorage occurs with pre-assembled particles, the possibility that global activation of SFKs by the maximal cross-linking protocol is responsible for transient anchorage is excluded.
similar to PP2 treated cells. But transient anchorage was restored in Src-rescued SYF cells (figure 12c). Thus SFK activity is crucial for the transient anchorage phenotype.
Role of PI3 Kinase: Phosphoinositides PIP2 and PIP3 co-patch with
cross-linked raft components (Janes et al., 1999). It has also been shown that signaling via cross-linked GPIAP and choleratoxin-labeled cholesterol-containing clusters on the cell surface is blocked by both tyrosine kinase and PI3 kinase inhibition (Krauss and Altevogt, 1999), suggesting involvement of PIP2 and PIP3 in signaling events induced by cross-linking. In addition, PIP2 and PIP3 found in inner leaflet microdomains are also involved in cytoskeletal regulation (Janmey and Lindberg, 2004). These findings suggest that changing the balance of PIP2 and PIP3 by inhibiting PI3K might affect transient anchorage. To test this possibility, prior to SPT experiments, IMR 90 cells were incubated with the PI3 kinase inhibitor, LY294004, for 15 minutes. Compared to control cells, PI3 kinase-inhibited cells exhibited over 3- fold greater transient anchorage (figure 13a). But the proportion of the longer anchorage times was drastically reduced (compare figure 13b to figure 11c). Moreover, inspection revealed that half of the trajectories (23/47) exhibited bi-directional movements in the PI3 kinase inhibited cells with excursions up to several µm (figure 13c).
Role of Caveolin: Since cholesterol depletion also disrupts the structure
et al., 1994). By co-immunostaining of caveolin-1 and maximally cross-linked Thy-1 on C3H cells, we confirmed that cross-linked GPI-anchored Thy-1 partially co-localizes with caveolin-1(figure 14c,d). Similar results were obtained for CD73 and Caveolin-1 in IMR-90 cells (figure 14a, b). By contrast, if cells were prefixed and subjected to maximal cross-linking, minimal colocalization was observed (data not shown).To test the involvement of caveolin I in the transient anchorage phenotype, we used Caveolin-1 knockout mouse embryonic fibroblasts. The expression of Caveolin-1 was checked in knockout and control wild type embryonic fibroblasts by immunostaining and confirmed the absence of Caveolin-1 on the cell surface of the knockout cells but not the wildtype (data not shown). Also, both caveolin-1 wt cells and knockout cells express CD73 (Figure 12b). As shown in figure 14c, the RAT was reduced from about 45% in wildtype cells to about 15% on Caveolin-1 knockout cells. After PP2 treatment to inhibit SFKs, the RAT was reduced to less than 5% in both knockout and wildtype cells. A similar effect was observed when cholesterol depleted from both cell types. The result suggests that Caveolin-1 contributes to the transient anchorage significantly, although apparently other mechanisms are also involved, as indicated by the persistence of transient anchorage that is PP2 inhibitable in caveolin-1 knockout cells.
Transient anchorage exhibited by a transmembrane protein is regulated in a different manner
behavior of a transmembrane protein, the cystic fibrosis transmembrane conductance regulator (CFTR). The C-terminal cytoplasmic domain of CFTR associates with the actin cytoskeleton via NHERF PDZ proteins (EBP50 and E3KARP) and ezrin (Raghuram et al., 2003; Short et al., 1998; Sun et al., 2000). If transient cytoskeletal association is the cause of transient anchorage, and cross-linking is necessary to recruit SFKs for clustered GPI-anchored proteins to be linked to the cytoskeleton, then CFTR might be expected to demonstrate transient anchorage in a cross-linking and SFK-independent manner. Furthermore, if the requirement for cholesterol in the transient anchorage of GPI-anchored proteins is because SFKs can only be recruited under the clusters through cholesterol-mediated nano-domains, then CFTR might also be expected to demonstrate transient anchorage independent of cholesterol.
GPIAPs exhibit a much more marked dependence of transient anchorage on SFK and cholesterol than does transmembrane CFTR. This suggests a mechanism by which cross-linked GPI-anchored proteins could exploit, via a cholesterol-mediated nanodomain followed by SFK regulation, the normal linkages of transmembrane proteins to the cytoskeleton (see Discussion).
Discussion
To focus future experiments, we propose a somewhat more specific working hypothesis (Figure 16) using these ideas as a starting point. In this model, cross-linking induces cholesterol dependent nanodomains (“cluster rafts”) to form on both inner and outer-leaflet. Such clusters would include key transmembrane proteins bridging the inner and outer leaflets, so that signals could be transmitted across the membrane in discrete locations. These proteins would be included from the outset and/or incorporated after collision of the cluster with the transmembrane protein. Whether initial anchoring is assisted by “oligomerization-induced trapping” (Kusumi et al, 2005) is an open issue. When an activated SFK randomly partitions into such a nanodomain on the inner leaflet, phosphorylation by SFK induces a resident transmembrane molecule to attach to the actin cytoskeleton through adaptor proteins. The attachment results in a transient anchorage event that continues until the SFK is deactivated and a recruited phosphatase dephosphorylates the resident linking molecule.
obtained results which are at least consistent with transient anchorage of GPIAPs proceeding via the EBP50-ERM-actin cytoskeleton linkage: An EBP50 binding transmembrane protein, CFTR, exhibits transient anchorage without employing the maximal cross-linking protocol and removal of the C-terminal PDZ binding domain of CFTR, which binds EBP50, in the delta 4 mutant abrogates transient anchorage (Figure 15). Our hypothesis therefore suggests that there is a common mode of cytoskeletal binding for both CFTR and GPIAPs (via EBP50:ezrin), but two different ways to couple to these adaptors, either directly (CFTR) or indirectly (GPIAP) via the formation of nanodomains and SFK regulation. Indeed, a regulatable ezrin linkage to Cbp was recently hypothesized to link rafts containing the B cell receptor to the lymphocyte cytoskeleton (Gupta et al., in press). That is, a common mode of cytoskeletal binding (via EBP50: ezrin), but two different ways to couple to these adaptors, either directly (CFTR) or indirectly via the formation of microdomains.
only the caveolin-1 independent internalization pathway of SV40 requires tyrosine kinase activity and cholesterol. In our work, transient anchorage does not exclusively depend on caveolin-1, suggesting at least two pathways to anchorage, but both pathways depended on cholesterol and SFK. The Helenius group also used SPT to study the diffusion behavior of murine polyoma virus–like particles (VLPs)--which are 45 nm in diameter and similar to the size of gold particles--bound to live cell membranes and found cholesterol-dependent but SFK-independent confinement (Ewers et al., 2005). VLPs exhibited confined diffusion in small zones 30-60nm in diameter that differs from transient anchorage in the fact that neither SFKs, nor Caveolin are required for confinement. Confinement requires cross-linking of viral receptor (ganglioside) which promotes linkage to the actin cytoskeleton in an as yet undefined way. In general, it could be anticipated, based on extensive study of viral interactions with the cell membrane, that multiple modes of transient anchorage would exist (Marsh and Helenius, 2006).
contributing to the directed transport of cross-linked clusters by walking along cytoskeletal filaments. Binding between clustered PIP2 and motor proteins also provides a possible explanation for the disappearance of longer stopping periods, since the motor proteins are active most of the time and might be expected to move the cluster directionally with short pauses (Kural et al., 2005).
Taken together, our data suggests the transient anchorage phenotype may be regulated in different ways depending on the biological context. Moreover, the transient anchorage assay presented here should be valuable in defining precise linkages to the cytoskeleton and how they are regulated.
Materials and Methods
Cells
(SYF+) (ATCC, MD) were used to examine the effect of Src family kinases on transient anchorage. The Caveolin-1 deficient mouse embryonic cell line (Cav-1 -/-) and its wildtype parental cell line, which were a generous gift from Dr. Martin Schwartz, were used for experiments investigating the role Caveolin-1 in transient anchorage. HA-tagged CFTR protein was expressed in C3H cells by lipofectamine transfection.
Gold conjugation to cells
Procedure I: Anti-biotin mouse IgG gold (BBInternational, UK) was
Covance, New Jersy, USA) was used as the primary antibody, followed by the addition of anti-biotin gold. SPT was then performed without addition of cross-linking tertiary antibodies. For all experiments, after the gold particle incubations, the sample chamber was sealed withwax and mounted on the microscope; particle trajectories wererecorded for the following 30 minutes at 37°C, maintained by an air curtain incubator.
Procedure II (Pre-assembled complexes): Gold particles conjugated
with antibodies specific to GPI-anchored proteins of interest were assembled before addition to the cells. Pre-assembled complexes (figure S2a) were made by mixing 20 µl of anti-biotin gold (4.5 x 10¹¹particles/ml), 2 µl of biotinylated goat mouse IgG antibodies (2mg/ml) and 20 µl of mouse anti-Thy-1 antibodies (15.5 mg/ml) in HHS solution with a final volume of 2 ml. The pre-assembled complexes then were spun down, resuspended, and added to the cell membrane for SPT experiments as described above for Procedure I. On the basis of the number of anti-biotin conjugated to gold (150 antibodies/particle) as specified by the manufacturer (BBInternational, UK), biotinylated goat-anti-mouse IgG antibodies (2.6 x 10⁻¹¹ mole) added were in 10 fold excess over the anti–biotin antibodies coated on gold, and mouse anti-Thy-1 antibodies (10-9 mole) added were in 40 fold excess over the goat anti-mouse IgG antibodies.
Immunofluorescence
Colocalization of cross-linked GPIAPs with caveolin I: Cross-linking of