ADVANCING EVIDENCE-BASED PRACTICE FOR CHILDREN WITH AUTISM: STUDY AND APPLICATION OF VIDEO MODELING THROUGH THE USE AND
SYNTHESIS OF SINGLE-CASE DESIGN RESEARCH
Kaitlyn P. Wilson
A dissertation submitted to the faculty of the University of North Carolina at Chapel Hill in partial fulfillment of the requirements for the degree of Doctor of Philosophy in the Department of Allied Health Sciences (Division of Speech and Hearing Sciences)
Chapel Hill 2012
iii ABSTRACT
KAITLYN P. WILSON: Advancing evidence-based practice for children with autism: Study and application of video modeling through the use and synthesis of single-case
design research
(Under the direction of Linda R. Watson)
This dissertation document is composed of three separate, but interconnected articles that represent efforts across the research cycle: the first is a review of existing literature on the synthesis of single-case design research in communication sciences and disorders; the second reports results of a novel single-case design study that adds to the existing research literature on behavior modeling interventions for children with autism; and the third is an attempt to translate existing research on video-based behavior
iv
ACKNOWLEDGMENTS
I would first like to acknowledge the children, families, and teaching staff who participated in the study that informed this dissertation, and offered their time and effort so generously. The teaching assistants and teachers who provided the study’s
interventions to the participating students were professionals and caring educators who offered their assistance selflessly. I would also like to thank my classmates, Jessica Dykstra, Jessica Kinard, and Jessie Klusek, who graciously volunteered their time to assist with assessments and other study procedures. And importantly, I would like to acknowledge the wonderful undergraduate students, Anna Ollinger, Traci Parnell, and Megan DeMaria, who served as research assistants and aided in all aspects of data
collection. Without the help of all of the above individuals, I would not have been able to complete this dissertation – thank you.
I would also like to extend my gratitude to my dissertation committee members, each of whom has offered personal and professional guidance during this process – with special thanks to my academic advisor, Dr. Linda Watson, for her many years of
v
TABLE OF CONTENTS
LIST OF TABLES……….vii
LIST OF FIGURES………...…...viii
CHAPTER 1: Introduction 1 References ...5
CHAPTER 2 (Manuscript 1): Synthesis of Single-Case Design Research in Communication Sciences and Disorders: Challenges, Strategies, and Future Directions………. 7
Introduction ...7
Meta-Analysis of SCD Research: Theoretical & Pragmatic Challenges ...10
Major Approaches to Quantifying SCD Research ...16
Conclusions and Recommendations...23
References ...26
CHAPTER 3 (Manuscript 2): Teaching Pivotal Social-Communication Skills to Preschoolers with Autism: Efficacy of Video vs. In-vivo Modeling in the Classroom ...29
Introduction ...29
Method ...35
Results ...50
Discussion ...61
References ...73
CHAPTER 4 (Manuscript 3): Incorporating Video Modeling into School-Based Intervention for Students with Autism Spectrum Disorders………79
Introduction ...79
Rationale for Use of Video Modeling ...83
Video Modeling Implementation: A Five-Phase Process ...85
Summary and Conclusions ...101
vi
vii
LIST OF TABLES
TABLE 3.1 Participants’ Target Behaviors and Inervention Contexts ...47
TABLE 4.1 Theoretical Roots of Video Modeling ...80
TABLE 4.2 Related Skills and Suggested Criteria ...86
viii
LIST OF FIGURES
FIGURE 3.1 Example of Daily Study Procedures...46
FIGURE 3.2 Social-Communication Target Behavior Graphs ...52
FIGURE 3.2 Visual Attention Graphs ...58
CHAPTER 1: Introduction
Evidence-based practice (EBP) is the careful integration of up-to-date, high quality research, professional knowledge, and preferences of the individual/family receiving services. In the field of communication sciences and disorders and related fields such as special education, EBP is the standard for service delivery (ASHA, 2005; U.S. DOE, 2007). However, in the growing body of literature that aims to bridge the gap between research and practice (i.e. translational research), investigators are finding that many empirically-supported practices are not being used in real-life settings due to a lack of practicality, resources, and buy-in (Dingfelder & Mandell, 2011; Yell, Drasgow, & Lowrey, 2005). This unfortunate fact reflects both the impetus for the EBP movement (Winton, 2006) and the ongoing need for practical clinical research that responds to the real-life needs of practitioners and those whom they serve.
The route from research to practice is a long and circuitous one, and there are many obstacles that can stand in the way of translational success. For example, many speech-language pathologists and other professionals working in educational settings have limited time to access the research literature due to increasing caseloads and
2
accessible and practical implementation guides for professionals to use in real-life settings (Odom, Collet-Klingenberg, Rogers, & Hatton, 2010).
Incorporating EBP into service delivery for children with autism spectrum disorder (ASD) is especially difficult. In addition to the above-outlined barriers, professionals serving this population must also navigate the quickly evolving and complex nature of ASD intervention research, and the heterogeneous need and skill profiles of this growing group of children. There are additional demands associated with the need for intensive, individualized instruction for children with ASD. Finally, the high level of family involvement (Scheuermann, Webber, Boutot, & Goodwin, 2003) and increasing media representation of unproven methods (Dingfelder & Mandell, 2011) present unique challenges to professionals serving this population. In an effort to support professionals in their provision of evidence-based services to individuals with complex disorders such as ASD, researchers must not only conduct high quality research suitable for inclusion in synthesis efforts aimed at determining empirical support for
interventions, but also must focus on meaningful, socially-valid outcomes that are endorsed by stakeholders (e.g., professionals, families; Dingfelder & Mandell, 2011). In addition, investigators must make efforts to translate this science into step-by-step guides for professionals interested in incorporating empirically-supported interventions into their everyday practice.
3
research in communication sciences and disorders: Challenges, strategies, and future directions, dissects contemporary issues surrounding research synthesis strategies and EBP in the field of communication sciences and disorders. This manuscript also
addresses the importance of high quality research in single-case design (SCD), a research design common to the study of interventions and meaningful outcomes for individuals with ASD. The final two manuscripts included in this dissertation focus on the
empirically-supported, cost-effective, and time-efficient intervention tool, video modeling (Nikopoulos, Canavan, & Nikopoulo-Smyrni, 2009; Simpson, Langone, & Ayres, 2004; Sherer et al., 2001). The video modeling literature base is primarily composed of SCD studies; therefore, the advancement of strategies to synthesize SCD literature, as discussed in the first manuscript, is highly relevant to the comprehensive examination of video modeling’s empirical evidence as an intervention strategy for children with ASD.
The second manuscript in this dissertation, Teaching pivotal
social-communication skills to preschoolers with autism: Efficacy of video vs. in-vivo modeling in the classroom, reports the rationale, methods, results, and implications of a rigorously conducted SCD study comparing the efficacy of video modeling to the more widely used tool of in-vivo modeling in teaching key social-communication skills to preschoolers with ASD in the classroom setting. The final manuscript in this dissertation expands upon this research report by addressing the need for practical, step-by-step guides for
4
of video modeling, and is written specifically for school-based speech-language pathologists serving individuals with ASD. Together, the three manuscripts that
5 References
America Speech-Language-Hearing Association (2005). Evidence-Based Practice in Communication Disorders [Position Statement]. Retrieved December 15, 2011, from www.asha.org/docs/html/PS2005-00221.html.
Closs, S. & Lewin, B. (1998). Perceived barriers to research utilization: A survey of four therapies. International Journal of Therapy and Rehabilitation, 5, 151-155. Curtin, M. & Jaramazovic (2001): Occupational therapists’ views and perceptions of
evidence-based practice. British Journal of Occupational Therapy, 64, 214-222. Dingfelder, H. E. & Mandell, D. S. (2011). Bridging the research-to-practice gap in
autism intervention: An application of diffusion of innovation theory. Journal of Autism and Developmental Disorders, 41, 597-609.
Nikopoulos, C. K., Canavan, C., & Nikopoulo-Smyrni, P. (2009). Generalized effects of video modeling on establishing instructional stimulus control in children with autism: Results of a preliminary study. Journal of Positive Behavior
Interventions, 11, 198-207.
Odom, S. L., Collet-Klingenberg, L. Rogers, S. J., and Hatton, D. D. (2010). Evidence-based practices in interventions for children and youth with autism spectrum disorders. Preventing School Failure, 54, 275-282.
Roberts, A. & Barber, G. (2001): Applying research evidence to practice. British Journal of Occupational Therapy, 64, 223-227.
Scheuermann, B., Webber, J., Boutot, E. A., & Goodwin, M. (2003). Problems with personnel preparation in autism spectrum disorders. Focus on Autism and Other Developmental Disabilities, 16, 197-206.
Sherer, M., Pierce, K. L., Paredes, S., Kisacky, K L., Ingersoll, B., & Schreibman, L. (2001). Enhancing conversation skills in children with autism via video
technology: Which is better, 'self' or 'other’ as a model? Behavior Modification, 25, 140-148.
Simpson, A., Langone, J., & Ayres, K. M. (2004). Embedded video and computer based instruction to improve social skills for students with autism. Education and Training in Developmental Disabilities, 39, 240-252.
6
Winton, P. J. (2006). The evidence-based practice movement and its effect on knowledge utilization. In V. Buysse & P. W. Wesley (Eds.), Evidence-based practice in the early childhood field (pp. 71-115). Washington, DC: Zero to Three.
CHAPTER 2 (Manuscript 1):
Synthesis of Single-Case Design Research in Communication Sciences and Disorders: Challenges, Strategies, and Future Directions
Introduction
Single-case design (SCD), also referred to as single-subject design, single-case experimental design, and individual-subject design, is an experimental research
methodology rooted in applied behavior analysis (Kennedy, 2005). It is a specific class of interrupted time-series research design that uses an individual case as the unit of
experimentation and analysis (and as its own control), and repeatedly measures the effects of a systematically-manipulated independent variable on one or more dependent variables (Gast, 2010). Although usually non-randomized, SCD is considered rigorous and has the strength to identify causal relationships between independent and dependent variables (Kratochwill et al., 2010; Schlosser & Sigafoos, 2008). The strength of this class of design stems largely from its high internal validity (i.e., validity of cause-effect relationship studied), established through replication of effects across phase changes (e.g., from a baseline to a treatment phase), participants, and contexts, as well as through planned reversals of behavior and lags in treatment initiation (Parker & Hagan-Burke, 2007b).
8
individual variability is of special interest, including psychology, special education, and allied health disciplines such as communication sciences and disorders (Beretvas & Chung, 2008; Kavale, Mathur, Forness, Quinn, & Rutherford Jr., 2000; Kratochwill et al., 2010). SCD is also highly suited to study of low-incidence populations and complex treatments, both of which can be costly and challenging to include in larger group comparison studies (Kratochwill et al., 2010; Van den Noortgate & Onghena, 2008). In addition, unlike large-n group studies, which often mask individual variability in their examination of group means (Kavale et al., 2000), SCD allows for examination of variations between individuals (Kratochwill et al., 2010) in highly heterogeneous populations such as persons with autism spectrum disorders (Beretvas & Chung, 2008). As such, SCD is most prominent in fields in which individuals from complex, low-incidence populations are often served (Beretvas & Chung, 2008; Kavale et al., 2000; Kratochwill et al., 2010). It follows, then, that SCD is a widely used research method in the field of communication sciences and disorders, wherein individuals from
heterogeneous populations (e.g., individuals with autism spectrum disorders, aphasia, or multiple disabilities) require individualized and scientifically-based treatment options. As evidence-based decision making has become the professional standard in
communication sciences and disorders (ASHA, 2005), researchers and clinicians are in need of practical and accurate methods to synthesize the available research, much of which is rooted in SCD methodology.
Need for Assessment and Synthesis of SCD Findings
9
research and use of more scientifically-sound practice (Parker, Hagan-Burke, & Vannest, 2007). Originating in the medical field of Great Britain in the early 1990s (Parker & Hagan-Burke, 2007b), this evidence-based practice (EBP) movement was later
accompanied by such American legislations as No Child Left Behind (NCLB, 2001) and the Education Sciences Reform Act (ESRA, 2002) (Parker et al., 2007). Still, years after the onset of the EBP movement, practicing professionals in fields such as communication sciences and disorders are encountering numerous barriers in their efforts to determine and implement EBP in clinical settings (O’Connor & Pettigrew, 2009). In order to identify empirically-supported practices for use in applied settings, the EBP movement calls for evaluation and synthesis of findings across primary research efforts (Wolery, Busick, Reichow, & Barton, 2010). In their endeavor to support the EBP movement by evaluating practices in terms of their accumulated evidence, researchers have sought methods to integrate research findings across studies in transparent, precise, and
functional ways (Kavale et al., 2000; Schlosser & Sigafoos, 2008; Wolery et al., 2010). The integration of research findings has been undertaken for many decades as a central means of knowledge acquisition and development (Kavale, Mathur, Forness, Quinn, & Rutherford Jr., 2000). Contingency tables, narrative reviews, and other forms of qualitative synthesis were some of the most utilized research integration methods prior to the 1970s (Kavale et al., 2000; Wolery et al., 2010). In response to scientific advances and potential for inefficiency and bias in these early methods, the 1970s brought
10
assessing, analyzing, comparing (e.g., examining moderating variables), and quantifying findings from primary research studies (Allison & Gorman, 1993; Wolery et al., 2010). With its intricate process of stipulating inclusion criteria, locating appropriate studies, coding study elements, calculating outcomes, and statistically analyzing data, meta-analysis became viewed by many as a precise decision-making tool, ideal for supporting the EBP movement that has taken hold over the past two decades (Kavale et al., 2000). In the current EBP climate, the role of meta-analysis in decision-making is growing, with many respected journals now requiring reports of effect size to accommodate more straightforward interpretation and aggregation of findings across studies (Olive & Smith, 2005; Parker & Hagan-Burke, 2007a, 2007b).
In 2008, a special issue of Evidence-Based Communication Assessment and Intervention (EBCAI) focused on issues and scientific progress in the field of SCD meta-analysis. Considering the growing attention to this area of inquiry, and the recent
publication of an expert panel-authored technical document of design and evidence standards for SCD (Kratochwill et al., 2010), the current article continues this important conversation. Specifically, this article provides an unbiased and updated ‘state of the science’ in the field of SCD meta-analysis, while also continuing and refining the call for further research in quantification methods for SCD.
Meta-Analysis of SCD Research: Theoretical & Pragmatic Challenges
11
Hagan-Burke, 2007a; Scruggs & Mastropieri, 1994; Van den Noortgate & Onghena, 2008), SCD proponents have identified some of the underlying reasons for this omission. Primarily, SCD studies have been excluded due to a lack of accepted statistical methods for synthesizing SCD research (Shadish, Rindskopf, & Hedges, 2008). In addition, the sub-par methodology (e.g., non-rigorous design, incomplete analysis) employed by many SCD researchers has been cited as a reason for SCD’s absence from most meta-analytic efforts (Parker & Hagan-Burke, 2007a). Many researchers, SCD and non-SCD alike, are unsettled by the exclusion of SCD from meta-analyses in areas (e.g., behavioral
intervention for preschoolers with severe disabilities) where the SCD literature is as extensive as the group comparison literature (Allison & Gorman, 1993; Kavale et al., 2000; Parker, Hagan-Burke, & Vannest, 2007; Scruggs & Mastropieri, 1994), and in cases where less rigorous large-n group studies (e.g., non-equivalent comparison group designs) are included while more rigorous SCD studies are not (Shadish et al., 2008).
Some contend that meta-analysis is not compatible with SCD’s philosophy and procedures, and that with its inclusion of poor quality studies and bias toward published, significant results, it is a flawed process (Kavale et al., 2000). Yet, many others support the inclusion of SCD research into the EBP meta-analysis movement (Shadish et al., 2008) despite considerable controversy over how this should occur (Parker et al., 2007). The debate over whether, and how, to synthesize SCD literature is not new, and
12
Theoretical Challenges: The Value of Visual Analysis
Those with a theoretical, or ideological, aversion to quantifying SCD findings point to the underlying purpose of SCD to identify ‘useful’ outcomes, as opposed to statistically significant effects (Baer, 1977). This group is generally populated by proponents of visual analysis, the traditional means of determining the presence and magnitude of functional relationships between independent and dependent variables in SCD (Kratochwill et al., 2010; Parker et al., 2007). When using visual analysis, the magnitude of an effect must be large to be detected (Beretvas & Chung, 2008), which is a limitation in the eyes of some (Parker & Hagan-Burke, 2007a), but the theoretical heart of SCD (i.e., clinical importance) in others’ estimation (Baer, 1977). Using visual analysis to determine clinically important effects reduces the probability of drawing a false conclusion about the functionality of a variable (i.e., Type 1 error), and thus
produces conclusions that are dependable and clinically robust (Baer, 1977). Abandoning visual analysis for the allure (e.g., increased chance of publication, increased acceptance by scientific community) of statistical aggregation and meta-analysis may reduce the occurrence of Type 2 error (i.e., claiming a variable is not functional when it is) in SCD; however, this shift would also threaten to reduce the impact of SCD results and
undermine the ideological foundations of this unique research approach (Baer, 1977). For researchers wishing to avoid such pitfalls, other options include more structured,
13
commonly utilized in the study of individuals with severe, low-incidence disabilities (i.e., the outliers) in fields such as psychology, education, and communication sciences and disorders, where individual variability is of special interest (Beretvas & Chung, 2008; Kavale et al., 2000; Kratochwill et al., 2010; Van den Noortgate & Onghena, 2008). Because of SCD’s intended focus on individual variability and the process of behavior change, traditional visual analysts and others are theoretically opposed to using a single number (as is common in meta-analysis) to characterize the complex SCD findings that emerge across heterogeneous participants and studies (Kavale et al., 2000).
Pragmatic Challenges: SCD Meets Effect Size
In addition to the theoretical challenges inherent in meta-analysis of SCD findings, there are a number of practical complications cited by traditional visual analysts, as well as by proponents of SCD quantification. For instance, individuals on both sides of the debate cite the fact that combining findings across SCD studies with different characteristics (e.g., dependent and independent variables, participant profiles, measures) results in unreliable and illogical conclusions (Kavale et al., 2000). Other practical challenges to the use of meta-analysis in SCD lie in the employment of quantification methods (i.e., effect sizes, overlap methods) within a methodology that often produces imperfect (e.g., floor/ceiling effects) or insufficient data, and that inherently violates the underlying assumptions of most statistical methods (Olive & Smith, 2005). Furthermore, data patterns seen commonly in SCD research (i.e., extinction bursts, learning curves) are not accounted for when using existing quantification
14
approaches; however, special attention is drawn below to the difficulties in using statistical effect size to quantify SCD results.
Effect size is the basic statistical metric used in combining large-n group studies for meta-analysis (Allison & Gorman, 1993; Kavale et al., 2000; Parker & Hagan-Burke, 2007a, 2007b). It is an index of the magnitude of the effect of one variable on another, and is commonly calculated as the ratio of the difference between two group means to a measure of standard deviation (Kavale et al., 2000). Effect size does not indicate
causality, but allows researchers and others to look at standardized treatment-related changes across studies with different (but related) samples, measures, designs, and analyses (Allison & Gorman, 1993; Parker & Hagan-Burke, 2007a, 2007b). The
limitations of visual analysis (e.g., poor inter-rater reliability), combined with the impetus of the EBP movement, spurred a subset of SCD researchers to adapt this existing
statistical aggregation tool into a more rigorous and parsimonious means of analyzing findings across SCD studies. Increased emphasis on the use of effect size in SCD and large-n group design is highly intertwined with the EBP movement and its focus on rigor, accountability, and research synthesis in education-related fields (Parker & Hagan-Burke, 2007a, 2007b).
15
(Campbell, 2004; Olive & Smith, 2005). In a recent editorial on effect size developments in SCD, Schlosser & Sigafoos (2008) assert that there is no question that effect size is needed in SCD research, but that the real search is for a suitable metric. A mere 13% of published SCD studies through 2006 employed effect size metrics (Parker & Hagan-Burke, 2007b), a clear indication of the practical challenges that stand between SCD and this meta-analytic tool (Kavale et al., 2000; Kratochwill et al., 2010).
Certain issues can compromise the use of effect size with any type of research, even large-n group design studies (e.g., incomplete data, inadequate statistical
16 Major Approaches to Quantifying SCD Research
Many options have been proposed for quantifying results of SCD studies, with a recent influx of ideas (Schlosser & Sigafoos, 2008); however, little consensus has emerged as to which option is most appropriate (Allison & Gorman, 1993; Beretvas & Chung, 2008), or whether a combination of approaches is optimal (Beretvas & Chung, 2008; Parker & Hagan-Burke, 2007a). The existing options include both non-parametric and parametric methods, with the non-parametric options largely consisting of ‘overlap methods’ that do not rely on statistical assumptions and are not actually effect size estimates, and the parametric effect size options primarily based on linear regression (Campbell, 2004). Much of the effect size debate in SCD has centered on the different strengths and weaknesses of these two categories of quantification methods, each of which is reviewed below.
Non-Parametric Approaches
17
are that they are: (1) confounded when there are floor/ceiling effects, or trends in baseline data (Allison & Gorman, 1993, 1994; Beretvas & Chung, 2008; Kavale et al., 2000; Kratochwill et al., 2010; Olive & Smith, 2005; Parker et al., 2007; Wolery et al., 2010); (2) dependent on the number of data points, with PND systematically approaching zero as the number of data points increases (Allison & Gorman, 1994; Kavale et al., 2000;
Shadish et al., 2008); (3) limited in their validity due to unknown sampling distributions and inability to calculate confidence intervals or p-values (Beretvas & Chung, 2008; Parker & Hagan-Burke, 2007a; Parker et al., 2007); (4) lacking published standards for interpretation in all but PND (Olive & Smith, 2005; Wolery et al., 2010); (5) susceptible to human error when hand calculation is used (Parker & Vannest, 2009); and,
importantly, (6) not actually effect sizes, or related to any effect size, so not accepted by the wider research community (Parker & Hagan-Burke, 2007a; Parker et al., 2007).
18
SCD studies when the goal is to make ‘local’ (vs. broad or universal) clinical decisions (Kratochwill et al., 2010; Parker et al., 2007). In response to PND’s drawbacks, other overlap methods were developed, including, but not limited to, percentage of zero data (PZD), percentage of all non-overlapping data (PAND), non-overlap of all pairs (NAP), pairwise data overlap squared (PDO2), percentage of data exceeding the median (PEM), percentage of data exceeding the median trend (PEM-T), and mean baseline reduction (MBLR).
PZD is an adaptation of PND that looks at the percentage of zero data points in the treatment phase (Allison & Gorman, 1993; Campbell, 2004), and is often combined with PND (Beretvas & Chung, 2008), as the methods measure related yet distinct aspects of SCD outcomes (Campbell, 2004). For example, PZD is a stronger tool than PND for analyzing studies where behavior suppression is the goal and examination of moderating variables is desired (Campbell, 2004). Still, PZD suffers from many of the same
weaknesses as PND (Allison & Gorman, 1993; Van den Noortgate & Onghena, 2008). PAND is a more recent alternative to these earlier overlap methods that draws upon all data points, not just extreme values (Parker et al., 2007). In this method, all between-phase overlapping points are removed and the percentage of remaining data points is calculated (Parker et al., 2007). This estimator is appropriate for studies with a larger number of data points (i.e., at least 20 in baseline), provides a synthesis metric with confidence intervals, and is easily translated to the parametric Phi statistic (Parker & Hagan-Burke, 2007a; Parker et al., 2007). Yet, PAND requires more complex
19
Shadish et al., 2008). In 2009, Parker and Vannest proposed NAP as a superior option to PND and PAND. NAP pairs all baseline and treatment data points to determine the percentage of non-overlapping pairs (Parker & Vannest, 2009). Initial study of NAP shows better discrimination of results, more objective procedures, more precise
confidence intervals, and greater correlation with the accepted R2 effect size (Parker & Vannest, 2009); however, more work investigating this new metric is needed.
Randomization tests have been proposed as another, more rigorous non-parametric option for use with SCD data; however, use of these procedures requires random assignment of treatments to participants and time points, which is contrary to general SCD procedures and ideals (Haardorfer & Gagne, 2010).
Wolery et al. (2010) compared PND and three additional overlap methods (i.e., PEM, PEM-T, and PDO2) to visual analysis judgments made by a panel of experts, concluding that none had acceptable error percentages (i.e., PEM-T lowest at 13.2%). PDO2, a method which uses all baseline data points to determine non-overlap, was previously cited by Parker and colleagues as a better-quality method than both PND and PEM; however, it showed the highest (23%) disagreement with visual analysis in the comparison (Wolery et al., 2010). PEM, which uses the median (vs. extreme) baseline point to gauge non-overlap, had the advantage of avoiding floor/ceiling effects, while PEM-T was the only overlap method that took baseline trend into account (Wolery et al., 2010).
20
and treatment phases (Campbell, 2004; Olive & Smith, 2005). MBLR was found to be the third most utilized method for quantifying SCD in meta-analyses (Beretvas & Chung, 2008), and is the only overlap method that assesses the magnitude of effect of an
independent variable. However, there are no standards for its interpretation (Olive & Smith, 2005). The general lack of published interpretation guidelines for non-parametric approaches is a serious limitation to this class of methods. An additional obstacle to the use of non-parametric methods is the lack of a statistical procedure to quantitatively synthesize these indices. Clearly, despite their widespread use in SCD, continued work is needed to bring non-parametric quantification methods to the level of stringency required by the increasingly-rigorous scientific EBP community.
Parametric Approaches
In their commentary on the ‘state of the science’ in SCD meta-analysis, Shadish et al. (2008) predict that parametric methods “will be one of the dominant and most
statistically sound approaches in [the field]” (pg. 191). However, they also state that decades of refinement are needed to these still-primitive meta-analytic methods (Shadish et al., 2008). The majority of parametric methods are regression-based, using linear estimation with outcome as the dependent variable and time as the independent variable (Olive & Smith, 2005). Their ability to model data trends (i.e., detrend data) allows for examination of both level and slope, and overall, these methods produce easily
21
commonly used to evaluate and synthesize large-n group studies, and so are accepted by the scientific community as powerful and rigorous metrics.
Despite their power, though, parametric options are criticized for their
impracticality when used with SCD data. Compared to non-parametric options, they are more difficult to calculate and generally require more data points (i.e., 25+) to produce accurate effect sizes (Allison & Gorman, 1993; Kavale et al., 2000; Parker et al., 2007). Still, their major flaws are related to their violation of underlying statistical assumptions of linearity and independence of residuals when used with SCD studies, which inherently involve autocorrelated (i.e., serially dependent) data (Allison & Gorman, 1994; Beretvas & Chung, 2008; Olive & Smith, 2005; Parker et al., 2007; Wolery et al., 2010). Although some have proposed models and programs (e.g., ITSACORR) for dealing with
autocorrelation in SCD quantification, these often require exceedingly large numbers of data points (e.g., 50+ per phase) (Beretvas & Chung, 2008), have insufficient power to detect small effects (Crosbie, 1993), and/or become inaccurate with a baseline trend (Beretvas & Chung, 2008). A more flexible, multi-level modeling approach has recently been proposed as a promising extension of the ordinary regression model that can
estimate and adapt to autocorrelation and trends in SCD data (Shadish et al., 2008; Van den Noortgate & Onghena, 2008). In addition, a generalized least squares (GLS)
approach that similarly models autocorrelation has recently been proposed (Swaminathan et al., 2010) and examined in a preliminary study (Maggin et al., 2011). Further
examination of these methods will determine their utility.
22
parametric approach that is the second most utilized method across SCD meta-analyses (Beretvas & Chung, 2008). SMD uses phase means (or the mean of the last three data points per phase) to produce a d statistic effect size (Beretvas & Chung, 2008). Although easier to calculate than other parametric options, SMD violates the statistical assumption of independence and loses the ability to account for data trend (Beretvas & Chung, 2008), making it a questionably-effective option. As noted by Shadish and colleagues (2008), much work remains to be done in honing parametric effect size measures to suit the nature of SCD data, while maintaining their power and standardizing their meaning across large-n and single-n design categories.
Combining SCD & Large-n Effect Size
Although integration of SCD and large-n effect sizes is the ultimate goal of many SCD researchers who wish to participate in determination of EBP, such combination is ill-advised at this point (Beretvas & Chung, 2008; Kavale et al., 2000; Kratochwill et al., 2010; Van den Noortgate & Onghena, 2008). Aside from the different participant
23
(Kavale et al., 2000; Kratochwill et al., 2010; Van den Noortgate & Onghena, 2008). However, for researchers who are more concerned with the combination of findings across SCD studies (e.g., in fields examining interventions for individuals with severe, low-incidence populations), conclusions and recommendations are offered below. Conclusions and Recommendations
What can SCD researchers and practitioners in fields such as communication sciences and disorders take from this quagmire of information in their effort to make informed choices about what, if any, technique is suitable for identifying effective interventions for individuals with severe, low-incidence, or heterogeneous disabilities? The recommendations of published experts in the field further complicate the issue, as most articles begin and conclude with statements regarding the large amount of work needed before any acceptable metric is defined for quantifying SCD results. Interestingly, the most consistent advice offered is the combination of more than one effect size or overlap method, and in many cases, triangulation of those methods with traditional visual analysis (Beretvas & Chung, 2008; Kratochwill et al., 2010; Olive & Smith, 2005; Parker & Hagan-Burke, 2007a). In a similar vein, the 2010 What Works Clearinghouse
24
At this point, neither the SCD nor the quantification literature base is adequately advanced to support an endorsement of any one meta-analytic strategy for synthesis of SCD results. It follows, then, that some experts advise utilization of all options (i.e., visual analysis, parametric effect size, and non-parametric methods) for quantification of SCD findings (Kratochwill et al., 2010). Until a widely-accepted metric is developed that addresses the theoretical and practical challenges of SCD meta-analysis, quantification decisions will have to be made by each researcher or practitioner on the basis of
ideological stance and study/data characteristics (e.g., research question, number of data points, trends). Triangulation of multiple quantification methods that best accommodate the theoretical and practical challenges of each synthesis effort is one possible course. Alternatively, researchers and practitioners may choose to rely on more qualitative syntheses until the quantitative methods are improved. For example, one option for synthesizing SCD findings in a way that is accessible and clinically meaningful involves the following steps: (1) separating high quality studies (i.e., adequate data points,
25
(O’Connor & Pettigrew, 2009). The idiosyncratic approaches proposed above are inadequate in the long run, however, and it is important that we continue to develop our thinking and methods surrounding incorporation of SCD findings into EBP decision-making.
26 References
Allison, D. B., & Gorman, B. S. (1993). Calculating effect sizes for meta-analysis: The case of the single case** 1. Behaviour Research and Therapy, 31(6), 621–631. Allison, D. B., & Gorman, B. S. (1994). "Make things as simple as possible, but no
simpler." A rejoinder to Scruggs and Mastropieri. Behaviour Research and Therapy, 32(8), 885–890.
American Speech-Language-Hearing Association (2005). Evidence-Based Practice in Communication Disorders [Position Statement]. Available from
www.asha.org/policy.
Baer, D. M. (1977). Perhaps it would be better not to know everything. Journal of Applied Behavior Analysis, 10(1), 167-172.
Beretvas, S. N., & Chung, H. (2008). A review of meta-analyses of single-subject experimental designs: Methodological issues and practice. Evidence-Based Communication Assessment and Intervention, 2(3), 129–141.
Campbell, J. M. (2003). Efficacy of behavioral interventions for reducing problem behavior in persons with autism: A quantitative synthesis of single-subject research. Research in Developmental Disabilities, 24(2), 120–138.
Campbell, J. M. (2004). Statistical comparison of four effect sizes for single-subject designs. Behavior Modification, 28(2), 234-246.
Crosbie, J. (1993). Interrupted time-series analysis with brief single-subject data. Journal of Consulting and Clinical Psychology, 61(6), 966–974.
Education Sciences Reform Act of 2002 (Pub. L. No. 107-279).
Fisher, W. W., Kelly, M. E., & Lomas, J. E. (2003). Visual aids and structured criteria for improving visual inspection and interpretation of single-case designs. Journal of Applied Behavior Analysis, 36, 387-406.
Flippin, M., Reszka, S., & Watson, L. R. (2010). Effectiveness of the picture exchange communication system (PECS) on communication and speech for children with autism spectrum disorders: A meta-analysis. American Journal of Speech-Language Pathology, 19(2), 178-195.
Gast, D. L. (2010). Single subject research methodology in behavioral sciences. New York: Routledge.
27
Kavale, K. A., Mathur, S. R., Forness, S. R., Quinn, M. M., & Rutherford Jr., R. B. (2000). Right reason in the integration of group and single-subject research in behavioral disorders. Behavioral Disorders, 25(2), 142–57.
Kennedy, C. H. (2005). Single-case designs for educational research. Boston: Allyn & Bacon.
Kratochwill, T. R., Hitchcock, J., Horner, R. H., Levin, J. R., Odom, S. L., Rindskopf, D. M., & Shadish, W. R. (2010). Single-Case Designs Technical Documentation. What Works Clearinghouse, 1-34.
Maggin, D. M., Swaminathan, H., Rogers, H. J., O'Keeffe, B. V., Sugai, G. & Horner, R. H. (2011). A generalized least squares regression approach for computing effect sizes in single-case research: Application examples. Journal of School
Psychology, 49, 301-321.
No Child Left Behind Act of 2001, Pub. L. No. 107-110, 115 Stat. 1425 (2002).
O'Connor, S. & Pettigrew, C. M. (2009). The barriers perceived to prevent the successful implementation of evidence-based practice by speech and language therapists. International Journal of Language and Communication Disorders, 44, 1018-1035.
Odom, S. L., Brown, W. H., Frey, T., Karasu, N., Smith-Canter, L. L., & Strain, P. S. (2003). Evidence-based practices for young children with autism: Contributions for single-subject design research. Focus on Autism and Other Developmental Disabilities, 18(3), 166-175.
Olive, M. L., & Smith, B. W. (2005). Effect size calculations and single subject designs. Educational Psychology, 25(2), 313–324.
Parker, R. I., & Hagan-Burke, S. (2007a). Useful effect size interpretations for single case research. Behavior Therapy, 38(1), 95–105.
Parker, R. I., & Hagan-Burke, S. (2007b). Single case research results as clinical outcomes. Journal of School Psychology, 45(6), 637–653.
Parker, R. I., Hagan-Burke, S., & Vannest, K. (2007). Percentage of all non-overlapping data (PAND): An alternative to PND. The Journal of Special Education, 40(4), 194-204.
Parker, R. I., & Vannest, K. (2009). An improved effect size for single-case research: Nonoverlap of all pairs. Behavior Therapy, 40(4), 357–367.
28
now. Evidence-Based Communication Assessment and Intervention, 2(3), 117– 119.
Scruggs, T. E., & Mastropieri, M. A. (1994). The utility of the PND statistic: A reply to Allison and Gorman. Behaviour Research and Therapy, 32(8), 879–883.
Scruggs, T. E., Mastropieri, M. A., & Casto, G. (1987). The quantitative synthesis of single-subject research: Methodology and validation. Remedial and Special Education, 8(2), 24-33.
Shadish, W. R., Rindskopf, D. M., & Hedges, L. V. (2008). The state of the science in the meta-analysis of single-case experimental designs. Evidence-Based
Communication Assessment and Intervention, 2(3), 188–196.
Swaminathan, H., Horner, R. H., Sugai, G., Smolkowski, K., Hedges, L., & Spaulding, S. A. (2010). Application of generalized least squares regression to measure effect size in single-case research: A technical report. Unpublished technical report, Institute for Education Sciences.
Van den Noortgate, W., & Onghena, P. (2008). A multilevel meta-analysis of single-subject experimental design studies. Evidence-Based Communication Assessment and Intervention, 2(3), 142–151.
CHAPTER 3 (Manuscript 2):
Teaching Pivotal Social-Communication Skills to Preschoolers with Autism: Efficacy of Video vs. In-vivo Modeling in the Classroom
Introduction
Children with autism have significant social-communication deficits (Rogers, 2000; Kanner, 1943) that commonly persist into school-age and impede academic and social success. Indeed, persistent deficits in social interaction and communication are argued to be the defining traits of autism (Scattone, 2007; Constantino et al., 2003) and include such varied skills as play, use of social language, and initiation of social
interactions. For individuals with autism, development of early social-communication skills is an integral step toward reaching the academic and social potential that their families, and potentially they, envision (McDuffie, Yoder, & Stone, 2006; Sigman & McGovern, 2005). Since many young children with autism spend the majority of their days in educational settings, practical, efficient, and empirically-supported classroom intervention tools are vital to addressing the pivotal social-communication needs of these young students (Bellini & Akullian, 2007).
31
an ideal setting for targeting early social-communication skills that may impact critical lifelong abilities such as establishing friendships, participating in educational activities, and enjoying employment or recreational undertakings. However, with the limited time, funding, and support provided to most classrooms, the task of identifying practical evidence-based intervention strategies is immense and daunting to educators (Browder & Cooper-Duffy, 2003). Furthermore, the additional resources required for intervention training and implementation are often unavailable (Scheuermann, Webber, Boutot, & Goodwin, 2003; Jacobson & Mulick, 2000). As such, educators are in need of practical, time-efficient, and empirically-supported intervention options that require minimal training.
Rooted in Bandura’s (1977) work on social learning theory, behavior modeling has been established as an effective tool for creating lasting change in a variety of behaviors. Video behavior modeling emerged in the 1990s as a variation of in-vivo (or live) modeling, a commonly used strategy for teaching children with autism (see Charlop, Schreibman, & Tryon, 1983). In earlier research, the impact of in-vivo modeling was termed “observational learning.” With the increasing accessibility and affordability of digital technology, video-based behavior modeling has become an effective and practical option for use in classrooms serving young students with autism (Charlop-Christy, Le, & Freeman, 2000).
32
Ziegler, Gill, & Salkin, 2009). More than two decades of video modeling research has shown its efficacy in teaching and changing a variety of behaviors in children with autism, including functional living skills, noncompliant behaviors, and social-communication skills (Nikopoulos, Canavan, & Nikopoulo-Smyrni, 2009; Simpson, Langone, & Ayres, 2004; Sherer et al., 2001). With increasing attention to the far-reaching impact of social-communication deficits on individuals and families faced with autism (Sigman & McGovern, 2005), recent studies have utilized video modeling to improve such early social-communication skills as play-related statements, toy play, and social initiations (Nikopoulos & Keenan, 2003; Taylor, Levin, & Jasper, 1999). With as few as three video modeling sessions, social-communication gains have been shown to generalize across settings, people, and stimuli, and to maintain over a period of as many as three months (Nikopoulos & Keenan, 2004). In 2003, in an article reviewing evidence-based practices for individuals with autism, Odom et al. deemed video modeling a ‘probably efficacious’ practice for targeting core deficits in children with autism. The subsequent influx of video modeling studies has only added credence to the empirical support of this intervention tool.
Adding to the appeal of video modeling is its practicality and efficiency of use. Very few resources are required for implementation (Gena, Couloura, & Kymissis, 2005), and a single video-based model can be easier to create than a static picture cue (Alberto, Cihak, & Gama, 2005). In addition, video modeling interventions facilitate independence (Hume, Loftin, & Lantz, 2009) and can be readily individualized to
time-33
intensive tool of in-vivo modeling (Gena, Krantz, McClannahan, & Poulson, 1996), implementation of video modeling promotes consistency and requires very little time, money, and training. In fact, when compared to in-vivo modeling, video modeling takes a fraction of the time for preparation and implementation, and costs about a third less in materials and research time per participant (Charlop-Christy et al., 2000). With the time, fiscal, and personnel constraints limiting educational practitioners, video modeling has great potential to modernize and streamline social-communication intervention in classrooms serving students with autism.
34
Two published studies have compared video modeling to in-vivo modeling, examining the relative efficacy of these tools in improving a variety of developmental skills in home and clinic settings (Gena et al., 2005; Charlop-Christy et al., 2000), with differing findings. A home-based study (Gena et al., 2005) found that video and in-vivo modeling facilitated similar learning of appropriate affective behaviors in preschoolers with autism, whereas a clinic-based study (Charlop-Christy et al., 2000) revealed faster acquisition of a variety of skills (including social-communication) when using video modeling with school-aged children with autism. This literature represents initial
examinations of the comparative effectiveness of video versus in-vivo modeling in clinic and home settings, but neglects the study of the relative efficacy of these interventions in classroom settings. That gap, as well as the contrasting findings of the two comparative studies, point to the need for more research in this area.
35
Miller, & Callahan, 2010), and due to consistency- and feasibility-related issues inherent in using preschool-aged peer models, this study employed adult models.
Method
Participants & Setting
With approval from the University of North Carolina at Chapel Hill’s Institutional Review Board, five preschool-aged children with autism spectrum disorder (ASD)
diagnoses consistent with the Diagnostic and Statistical Manual of Mental Disorders (DSMIV-TR; American Psychiatric Association, 2000) criteria were recruited from local preschool classrooms, and parental consent was obtained. However, one child was withdrawn from the study during the pre-participation assessment process due to
behavioral outbursts and extreme difficulty complying with assessment procedures. The child’s teacher initiated his withdrawal from the study due to concerns that the
interventions would be similarly difficult for him to tolerate, and would disrupt his progress in the classroom. Therefore, four children participated in the entirety of this study. Study data were collected over the course of two academic years, with each individual participant’s data collected during one academic year.
36
preschool program. Efforts were made to recruit diverse participants in terms of race, ethnicity, and gender.
Autism diagnoses and imitation skills were confirmed prior to study participation using the Autism Diagnostic Observation Schedule (ADOS; Lord, Rutter, DiLavore, & Risi, 1999). Participants’ initial profiles (i.e., language, communication, motor,
perceptual, and adaptive behavior skills) were then assessed using standardized
assessment tools including the Vineland Adaptive Behavior Scales, 2nd Edition (Vineland-II; Sparrow, Cicchetti, & Balla, 2005), the Mullen Scales of Early Learning (MSEL; Mullen, 1995), and the Preschool Language Scale, 4th Edition (PLS-4; Zimmerman, Steiner, & Pond, 2002). These tools were chosen based on their recommended and successful use in assessing and describing children with autism (Paul & Wilson, 2009; Corbett, Carmean, & Fein, 2009).
The final four participants were recruited from two local preschool classrooms, each housed in a different public elementary school. Each classroom was staffed by a lead teacher and two teaching assistants, and served students with a range of
37
Isaac, an Asian-American male, was aged 5 years, 4 months at the start of the study. Isaac was diagnosed with autism at 2 years of age. At the time of this study, he was enrolled in a public preschool program for children with developmental disabilities and received speech-language and occupational therapy services at school.
Administration of the ADOS confirmed Isaac’s diagnosis of autism and showed he had deficits in directed vocalizations, gestures, initiation of joint attention, quality of social overtures, and use of stereotyped phrases. Across additional measures, Isaac scored below the level expected for his age, falling in the 13-24 months age range for visual reception, fine motor, and receptive and expressive language skills. Visual reception and fine motor skills were relative strengths for Isaac, placing him at the 24 months age level according to the MSEL. However, expressive and receptive language were areas of relative weakness, as Isaac scored in the 13-18 months age range across the MSEL and PLS-4. Through the Vineland-II parent interview, Isaac’s parent reported that some of his best language skills included listening to and following simple instructions and using first names to refer to familiar people. In interpersonal relationships, Isaac’s parent reported that he was able to imitate complex actions of others, show affection for familiar people, and play simple interaction games. Observations of Isaac in the classroom by research staff showed him to be a child who smiled often and used delayed echolalia, jargon, eye contact, and non-word vocalizations to communicate (i.e., mainly to request highly desired objects/activities). Additional observations were that Isaac enjoyed
38
Selena, an African female adopted by Caucasian-American parents, was aged 4 years, 8 months at the start of the study. She was enrolled in the same public preschool classroom for children with developmental disabilities as Isaac. She was diagnosed with autism at 4 years of age, and was also diagnosed with microcephaly and metopic
39
Nicholas, an African-American male, was aged 3 years, 9 months at the start of the study. He was enrolled in a public preschool program for children with developmental disabilities (at a different school than Isaac and Selena), and received speech-language and occupational therapy services at school. He attended outside therapy sessions one to two times per week. Administration of the ADOS confirmed his diagnosis of autism and showed Nicholas’ deficits to include limited use of gestures (i.e., showing), eye contact, vocalizations, and facial expressions to communicate with others. Across additional measures, Nicholas scored below the level expected for his age, falling in the 8-26 months age range for visual reception, fine motor, and receptive and expressive language skills. Visual reception and fine motor skills were relative strengths for Nicholas, placing him in the 26 months age range on the MSEL. However, expressive language was an area of relative weakness, as he scored in the 8-13 months age range across the MSEL and PLS-4. Through the Vineland-II parent interview, Nicholas’ parent reported that
expressively, Nicholas was able to say his name when asked, identify body parts, attempt to repeat words, and use pointing and pulling to direct others’ behavior. Regarding social skills, Nicholas’ parent reported that he was able to imitate simple and complex actions and show affection for familiar people. In the classroom, research staff observed Nicholas to be a happy child who learned routines quickly, enjoyed dancing and watching videos, but rarely interacted with his peers. He also was observed to have difficulty attending to adults during group activities, but to check in with adults after performing an undesired behavior.
40
year and with a different teaching assistant. Sarah received speech-language and occupational therapy services at school and attended outside therapy sessions three to four times per week. Administration of the ADOS confirmed her diagnosis of autism and showed Sarah’s deficits to include limited use of eye contact, gestures, vocalizations, and facial expressions to communicate with others. Across additional measures, Sarah scored in the 13-20 months age range for visual reception, fine motor, and receptive and
expressive language skills. Visual reception and fine motor skills were relative strengths for Sarah, placing her in the 20 months age range on the MSEL. However, receptive and expressive language were areas of relative weakness, as she scored in the 11-13 months (receptive) and 15-16 months (expressive) age ranges across the MSEL and PLS-4. Through the Vineland-II parent interview, Sarah’s parent reported that expressively, Sarah was able to label objects, and occasionally use single words or gestures to make requests or answer questions. Sarah’s parent also reported that she showed happiness, concern, and affection for others, and imitated simple actions like waving goodbye. Research staff observed Sarah to be a driven, anxious child who communicated in the classroom through sounds, gestures, and negative behaviors such as hitting and pulling hair. She also was observed to enjoy adult attention and affection, play social games initiated by an adult, and engage in solitary, repetitive, but at times functional, play. By teacher and parent report, Sarah started taking anxiety medication at the start of baseline data collection.
Adult Participants
41
study. Isaac, Selena, and Sarah had the same lead teacher, but Sarah had a different teaching assistant participate as her facilitator due to a staffing change between school years. Nicholas attended a different school, so a separate teaching team participated in his interventions. All adult participants were Caucasian, four were female, and one was male (a teaching assistant). All participating teachers held bachelor’s degrees, and teaching assistants were either working towards completion of an associate’s degree or held a bachelor’s degree. Adult participants had a range of 2-16 years’ experience working with students with autism. Participating teaching teams reported incorporating technology into their classrooms multiple times per week (using tablet PCs and laptop projection, in addition to the present study’s procedures) and focusing primarily on communication in their instruction.
Design
42
represents a behavior analysis methodology specifically intended for comparing effects of two treatments.
Procedure
43
parent to confirm whether they endorsed the target behavior as an appropriate and meaningful goal for the student (i.e., to determine social validity of goals).
Determination of Intervention Contexts: To determine intervention contexts and materials for each child, the research team used a multiple-stimulus preference
assessment procedure found to identify confirmable and stable preferences in young children with autism (Carr, Nicolson, & Higbee, 2000). This procedure involved three identical sessions in which the child was shown eight stimuli and instructed to choose preferred items until all were selected. In this way, stimuli were ranked from highest preference to lowest preference and used to identify motivating and preferred materials (e.g., book, crayons) and related contexts (e.g., reading center, art center). For each child, the interventions were then randomly assigned to two different contexts of comparable preference (i.e., within five percentage points), so that each intervention was provided in an independent but functionally similar context.
Adult Participant Training: Modeling conditions consisted of the teacher and teaching assistant interacting with one another while the child observed. Each
participating teacher/model was trained by the author to accurately and consistently perform the student’s target behavior in the in-vivo and video modeling conditions. Each participating teaching assistant/facilitator was trained to perform in his or her role, which involved providing materials and giving semi-structured opportunities for the targeted social-communication behavior, but not modeling the target behavior. Adult participants were given semi-structured scripts and immediate feedback to guide sessions.
44
the model and teaching assistant as the facilitator of the activity through which the modeling took place. Video and in-vivo interventions were matched for length (i.e., three minutes), number of models given (i.e. 11 models), and general setting characteristics (e.g., in the classroom, free of excessive distractions). Interventions were generally provided while other children were in the classroom, and all adult actions included in the modeling interventions were performed at a natural (vs. slower than normal) pace.
Data Collection: All observational data were collected by trained research assistants blind to the study’s hypotheses, using pen and paper protocols for both social-communication and visual attention data collection, and an automated interval indicator (that provided a beep through headphones every five seconds) for the visual attention data collection, as described below.
Baseline measures of each child’s target social-communication behavior were taken in each context (i.e., pre-determined activity/materials, with facilitation by teaching assistant) approximately three times per week during five-minute observational probes for a minimum of five data points or until responses stabilized (Kratochwill et al., 2010). In Selena’s case, however, a stable baseline was especially difficult to achieve in one context, and the school calendar (i.e., approaching end of school year) made it imperative that we move forward with treatment before a predictable trend was revealed. Following baseline, the teacher/teaching assistant team provided each treatment to the child for three minutes, an average of three times per week, for a minimum of five sessions (Kratochwill et al., 2010) and a maximum of fifteen sessions, with the length of actual data collection dictated partially by the school calendar, participant availability, and participant
45
Both treatments were provided on each day of data collection, with at least one hour between treatments, and with the order of treatments randomized by the author daily to reduce order effects. A binomial test examining treatment order and outcome data confirmed that the order of treatments was not significantly related to social-communication outcomes.
During treatment delivery, the research assistant used momentary time sampling to record presence or absence of visual attention to the model based on the child’s attention state every five seconds (36 times) during the three-minute treatment session. Gestural and verbal prompts were given to the child to attend to each model as needed (i.e., when not visually attending) during treatment sessions. To examine the effects of the
intervention, the same research assistant conducted a five-minute observational probe to assess the child’s retention of learning, with these probes conducted each day of
46 Figure 3.1 Example of Daily Study Procedures
Approximately two to three weeks following the final treatment session (which occurred on the second to last day of treatment data collection), a research assistant followed the same observational procedure (i.e., five-minute observational probes in each context) for two days to assess maintenance of any treatment effects; however, no visual attention data were captured during this follow-up phase, as no modeling treatments were being provided during these sessions.
47
participants also completed a brief questionnaire with demographic questions related to training and experience. This questionnaire also asked questions related to classroom practices, perceived outcomes of each intervention (i.e., social validity of outcomes), and the likeliness of using each intervention following the end of the study. After completion of the study, each participating classroom received a miniature digital camcorder with USB connector as compensation for participation, and as a means of promoting sustainability of the video modeling intervention method, if desired.
Target Behaviors & Contexts
As described above, each participating child’s target behavior was determined based on assessment results, observation, and consultation with the child’s teacher and parent. The intervention contexts were based on the preference assessment results, with the child exhibiting equivalent preference for the two contexts randomly assigned to the two interventions. Attempts were made to choose contexts through which the child exhibited similar baseline frequencies of the target social-communication behavior, and this was achieved for three of the four participants. For each child, the two contexts were characterized by different settings and sets of materials. Information regarding each child’s target behavior and intervention contexts is presented in Table 3.1.
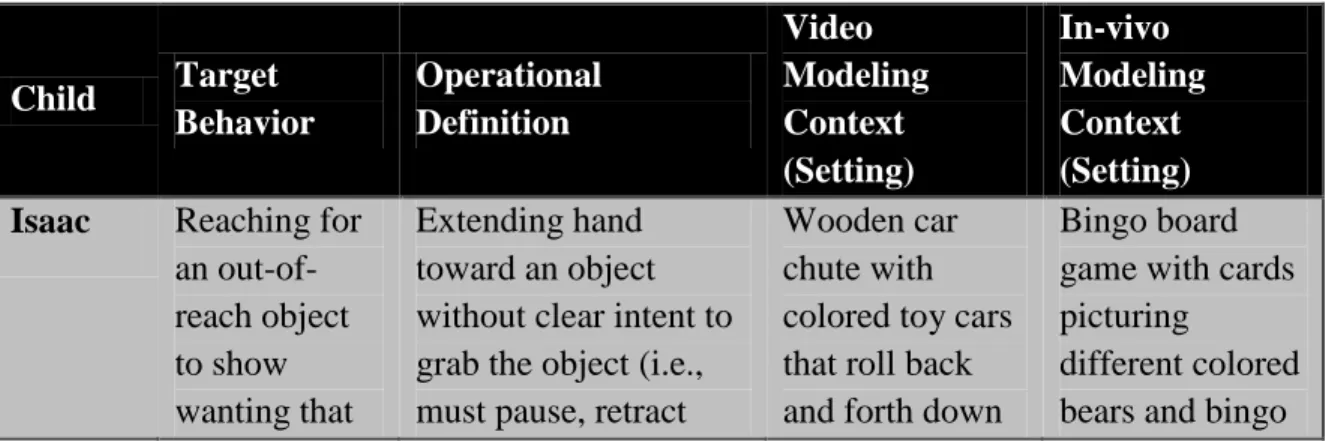
Table 3.1 Participants’ Target Behaviors and Intervention Contexts
Child Target Behavior Operational Definition Video Modeling Context (Setting) In-vivo Modeling Context (Setting) Isaac Reaching for
an out-of-reach object to show wanting that
Extending hand toward an object without clear intent to grab the object (i.e., must pause, retract
Wooden car chute with colored toy cars that roll back and forth down
Bingo board game with cards picturing
48 object (i.e., as
a request)
hand, and not touch the object)
the chute (table in puzzle center)
boards (floor in reading center) Selena Pointing to a
nearby object/ picture while vocalizing to share interest with another person
Forming a clear point (i.e., index finger extended) and
directing the point to a nearby object/picture with coinciding vocalization, and clear intent to share interest with another person (i.e., not a request for an action or object)
Illustrated story book with a predictable structure (bean bag chair in reading center)
Clear plastic jar with screw-on lid, containing many different colored wooden blocks in the shape of balloons (floor in free play center)
Nicholas Using a gesture to indicate wanting more after a brief adult-initiated pause in the activity
Indicating desire for more materials or for an activity to continue through use of one of the following gestures: signing ‘more,’
reaching for materials without grabbing (i.e., hand stays open; retracted), or pointing to materials
Wooden car chute game with three different colored cars and a button to send them down the track (table in independent work area)
Large rubber (exercise) ball for kicking and bouncing back and forth with a partner (floor in teacher work area)
Sarah Using a gesture to indicate wanting more after a brief adult-initiated pause in the activity
Indicating desire for more materials or for an activity to continue through the use of one of the following gestures: reaching for materials without grabbing (i.e., hand stays open and is retracted), or pointing to materials
Different colored pop beads in the shape of vehicles (table in puzzle center)
49 Intervention Fidelity
This study measured treatment fidelity of both video and in-vivo modeling interventions. Measuring the fidelity of both treatment conditions adds procedural validity to the study’s findings and allows for more accurate replication. Fidelity of in-vivo modeling (e.g., length, setting, number of models) was assessed by research staff through direct real-time observation during 26% of treatment sessions using a pre-established checklist. In-vivo modeling fidelity averaged 96% across the four
participants. As suggested by Delano (2007), for video modeling, two independent raters assessed the accuracy and quality of each videotaped depiction of a target behavior prior to implementation using a pre-established checklist (checklists available from the author upon request). Videos were re-recorded or edited if the average fidelity score fell below 90%. Two videos were edited to enhance the audio quality and increase its fidelity, and the average fidelity of the final videos used in the study was 96%.
Interobserver Agreement
Interobserver agreement was calculated for social-communication data for each participant during baseline (28% of sessions), treatment (30% of sessions), and
50 Results
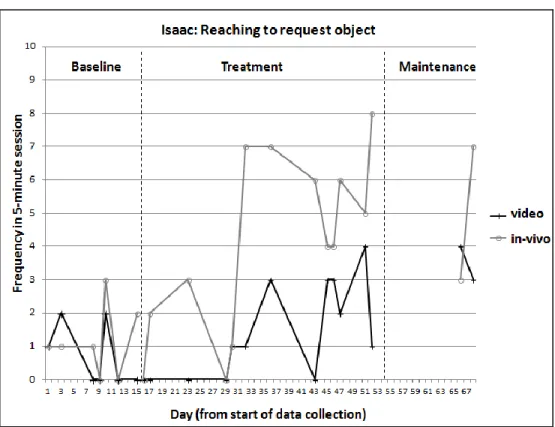
Social-Communication
Social-communication data are organized into time-series graphs for each participant (see Figure 3.2), with time (i.e., session number across baseline, treatment, and maintenance phases) represented on the x-axis and frequency measurement of outcome variables represented on the y-axis. Time-series graphs were analyzed using visual analysis of level, trend, variability, and immediacy of effect. In cases where visual analysis provided evidence of a causal relation between one or both of the treatments and the outcome variable, calculations were conducted to compare each participant’s baseline and treatment data for each intervention, providing a numerical index for comparison (Kratochwill et al., 2010). Because this study, along with most SCD studies, has too few data points to satisfy the underlying statistical assumptions of parametric effect size metrics (i.e., linearity and independence of residuals; Allison & Gorman, 1994; Beretvas & Chung, 2008; Olive & Smith, 2005; Parker et al., 2007; Wolery et al., 2008), a non-parametric data overlap method was utilized: non-overlap of all pairs (NAP; Parker & Vannest, 2009).
51
reflects improvement from one phase to the next (Parker, Vannest, & Davis, 2012). Different from other overlap methods, NAP pairs each (vs. highest or median) baseline data point with each treatment data point, assigning one point for an overlap (i.e., treatment data point is lower than baseline data point), zero points for non-overlap (i.e., treatment data point is higher than baseline data point), and half a point for a tie (i.e., treatment data point is equal to baseline data point). The final percentage of
non-overlapping data pairs is then calculated by determining the number of comparison pairs showing no overlap (or partial overlap, i.e., a tie) and dividing by the total number of comparisons. The total number of comparisons is determined by multiplying the number of data points in baseline times the number of data points in treatment (e.g., 7 x 13=91).
Results offer a percentage of overlapping pairs, with a higher percentage of
non-overlap indicating a greater effect. In cases where data points in baseline and treatment phases are equal, the NAP is equal to 50% (Parker & Vannest, 2009). NAP can be calculated through computerized statistical analysis tools using a receiver operator characteristic curve (ROC) module or a Mann-Whitney U test, or through simple hand calculations (Parker, Vannest, & Davis, 2012), as it was in this study. Based on
comparisons to expert visual analyses, Parker and Vannest (2009) offer tentative
guidelines for interpretation of NAP, with 0%-65% non-overlap reflecting weak effects, 66%-92% medium effects, and 93%-100% strong effects.