Email: [email protected] Email: [email protected]
Abstract—We propose a technique to accurately and quickly determine and resolve the geo-spatial and logical location of grid-resident devices. The technique compare downstream current profiles (DCP) with the superposition of current profiles at the substation (UCP) in the grid. Since small amounts of noise current and perturbations will show up at the substation due to active devices on the grid, the electrical location of each meter can be determined by comparing passive line data from the meter location (DCP) against all the substation feeder lines (UCP). The significance of this approach is that it is passive and efficient as it does not require additional hardware or communication signals to be introduced to grid infrastructure. The technique can be integrated into current grid systems and implemented using existing smart meter data acquisition facilities and computer/software processing at the utility’s datacenter.
Index Terms—Grid, Smart Grid, Grid Devices, Device tion, Geo-Spatial/Physical Location, Electrical/Schematic Loca-tion, Device Location DetecLoca-tion, Disturbances
I. INTRODUCTION
Electric power distribution networks (”the grid”) are a crit-ical and integrated part of modern society. Recent advances in telecommunications and Internet technologies are transform-ing traditional power distribution grid to smart grid, where electric meters can be read and reading sent to a datacenter and operations of the grid can be monitored and controlled in real time through grid control centers [1].
Location information of devices in the grid is critically important [2]. Defining and detecting the locationof a device in the grid is a fundamentally important capability of the grid. This capability would seem to be obvious or simple given modern technologies of global positioning (GPS), network-based tracking of computer systems, and so on. However,
location in the grid has at least two independent
compo-nents: (a) geo-spatial or physical location, and (b) electrical or schematic location. Interestingly, the data which is used to define these components in the grid may be difficult to accurately determine, and effective correlation between the components may be difficult to achieve. For example, even in today’s Smart Grid [1], utility companies are unable to definitively map a device such as a smart meter, to an exact electrical location in the distribution grid. Further, the geo-spatial location of grid-resident devices (which can be resolved via GPS, etc.) may not accurately reflect their electrical
location. Conventional devicesdownstreamfrom a substation are deployed in a fixed location, on a specific feeder, lateral, and phase. However, deviations between the initial design of the system (as-designed), the initial deployment of the system built), and the present configuration of the system (as-modified) often create ambiguities between the geo-spatial and electrical location of particular grid-resident devices.
These ambiguities are problematic, and can be difficult to resolve without significant manual intervention and expense. Up to date, immediately validated knowledge of the feeder, lateral, and phase for grid-resident devices can provide es-sential feedback to the utility company regarding important grid attributes, such as the aggregate loading of specific circuits or phases, the location and health of sub-circuits and devices, and the presence or absence of load activity. This type of information may become increasingly important as large, mobile source/load devices such as electric vehicles are introduced to the Smart Grid.
Therefore, a technology which could provide automatic reconciliation between physical location and electrical location of grid-resident devices, and in doing so create an accurate, constantly updated map of the grid, would be extremely valuable to electric utilities. This paper describes an approach to accurately and quickly determining and resolving the geo-spatial and logical location of grid-resident devices. The significance of this approach is that it is passive because it does not require additional hardware or communication signals to be introduced to grid infrastructure. The technique can be implemented using existing smart meter data acquisition facilities and computer/software processing at the utility’s datacenter [3], [4], [5].
The rest of the this paper is organized as follows. In Section II we discuss smart meters and issues in grid mapping. We argue that the current grid mapping schemes are inad-equate. We review and discuss some fundamentals of smart meters and grid mappings in Section III. We present some critical observations and discuss some important properties and requirements of grid mapping. The core of the paper, an architecture for mapping device locations passively and intelligently, is presented in Section IV. We show how to obtain device location accurately in the presence of noise and disturbances. Summary and concluding remarks are given in
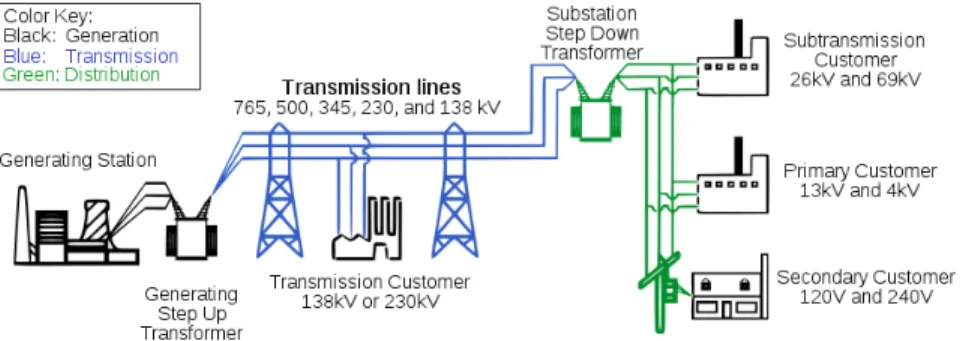
Fig. 1. Grid: Generation, Transmission, and Distribution of Electric Power
Section V.
II. SMARTMETERS ANDGRIDMAPPING
Smart meters are fundamental components of smart grids.
From the utility’s perspective, smart meters allow for remote billing and automatic, network-based retrieval of electrical me-ter data. This type of Automated Meme-ter Infrastructure (AMI) is more economical than periodic manual reading of electric meters. However, smart meters typically rely on a wireless network to transport meter data to a central location. The use of such extrinsic networks results in significant ambiguity between the physical location of the meter and its electrical location (i.e.feeder, lateral, phase).
The reconciliation between a device’s geo-spatial location and its electrical location can be referred to as itsgrid location. The geo and electrical location of each meter may have been logged during installation, resulting in a static or as-built
map of the grid. However, the upstream electrical connections are often changed during outages or seasonal load balanc-ing, destroying important information regarding actual grid connectivity, and resulting in an as-modified configuration. Furthermore, older or manual logs of equipment location and circuit architecture may have been inaccurate, resulting in differences between the as-designed and as-built perspectives. Clearly, this situation may have been exacerbated by the realities of several subsequent as-modified conditions.
Additionally, in the present model of system management for the distribution grid, service failures are determined pri-marily via customer feedback (i.e. phone calls from customers reporting outages.) Utility technicians must then search for the area where the problem occurred by correlating customer feedback with sometimes outdated or otherwise inaccurate schematics of the local grid. If electric service providers had a way to automatically resolve the geo and electrical location of every device on their grid, it would allow them to maintain a constantly up-to-dategrid mapwithout manual intervention, and even in the face of multiple changes in downstream devices or grid architecture. For example, the installation of new meters would automatically refresh the grid map via communication with the central office, or the re-connection of upstream links after an outage would be automatically rec-onciled in the centrally-located grid map. In a more complete
instantiation of this automated mapping capability, additional communication systems, such as smart transformers, voltage regulators, and the like, could also augment the grid map via targeted or scheduled updates.
An electrical map of the grid requires knowledge of the specific feeder, lateral, and electrical phase where the de-vice resides. For example, as shown in Figure 1, feeders are typically 3-phase, medium-voltage links (13-30kV) which begin at the substation bus and traverse several miles of local distribution territory. In rural settings, feeders can be 50 miles in length and may service hundreds of loads. In urban settings, feeders may be 5-10 miles in length, and may service several thousand loads. Lateral lines branch off from a feeder at downstream locations, and may be 3-phase or 1-phase links which terminate in a distribution transformer. Distribution transformers typically service 3-10 loads, where a load may be a residence or business with an electrical meter. Electrical service to a residence is typically a single-phase link taken from the 3-phase feeder which began at the substation servicing the residence. Clearly, the feeder, lateral, and phase data for a particular load or device are dependent on the actual physical construction of the distribution network at any point in time. Thus, correlation between physical & electrical activity at the substation and physical & electrical activity at the load is a critical factor in thegrid mapping process.
III. PROBLEMS ANDOBSERVATIONS
A substation is a distribution point for medium voltage (MV) electrical service which has been converted from a high voltage (HV) transmission/generating plant. The MV is distributed over the local distribution grid, and converted to low voltage (LV) at the endpoints. The LV power is used in households, commercial buildings, etc. This network architec-ture is illustrated for reference in Figure 1. In the figure, the distribution grid is shown by the green line segments. Note that a single substation, shown by the junction between blue and green segments, may actually service a distribution grid composed of several thousand loads of various sizes.
A. Distribution Grid
The distribution grid is a complex, time-varying system. The spectra of voltage, current, and impedance all change in real time based on load and activity profiles [6]. As a
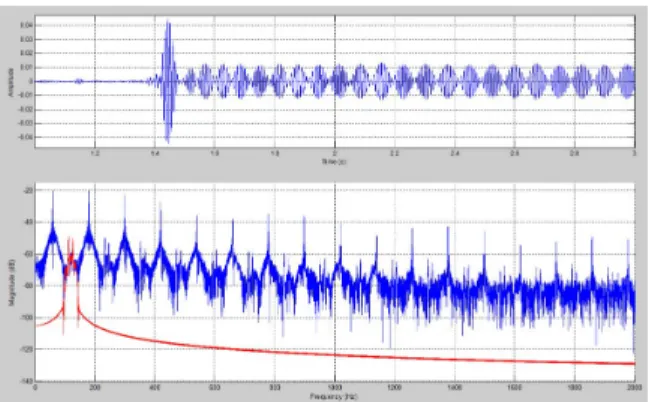
Fig. 2. Example of signal anomalies in the electric distribution grid. This figure shows the time and frequency (magnitude) representation of the turn-on current transient of a televisiturn-on set. The highlighted signal in the spectral plot(bottom) is the anomaly, which due to system characteristics is recursively replicated at 120Hz spacings.
result, the signal environment of the LV power line is very dirty. It contains a large voltage at the fundamental frequency (50Hz in Europe, etc. or 60Hz in the U.S.) as well as odd and even harmonics of this frequency. The LV system also contains non-stationary noise from other connected loads and sources. For example, large electric motors create anomalies at collections of frequencies related to their angular velocity, or large appliances create correlated noise bursts during specific operational events. An example of such a noise burst is shown Figure 2, which shows the turn-on current transient of a television set, as seen from the electric meter. In the figure, time-based and frequency-based artifacts are clearly evident for several seconds as the power supply of the appliance boots up and the system begins operation.
B. Disturbances
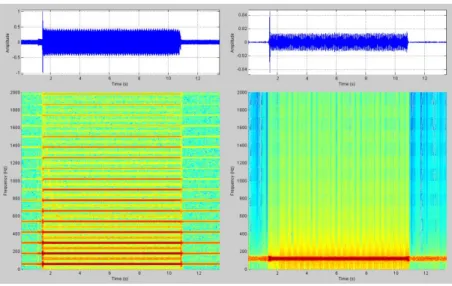
Figure 3 contains an alternative perspective of the turn-on transient of the television set. In this figure, a spectrogram is used to jointly analyze time and frequency anomalies. In the bottom section of the figure (a spectrogram), the spectrum of the unfiltered current signal is shown on the vertical axis between 0 Hz and 2000 Hz, and the signal evolves over time along the horizontal axis for roughly 13 seconds. The time-domain perspective of the signal is shown in the top section. During this 13-second period, the TV set was turned on ( 0 sec), allowed to stabilize (2-10 sec), and then turned off ( 11 sec). The bottom section of the figure clearly shows stable even-harmonic features during the time that the TV is on and the lack of these same features during the time that the TV is off. Referring to Figure 2, the instantaneous spectral shape of the features is evident (and highlighted) as two closely-spaced peaks near 120 Hz and 25 dB down from the 60 Hz fundamental and 3rd harmonic. A collection of specific features of the time envelope and spectral envelope of these anomalies is tantamount to a digital fingerprint of the power supply for the TV system.
In the case of the TV power supply, the even harmonics contain a clearly recognizable and stable pattern which is noted
features can be easily acquired, extracted, compressed, and transmitted to the service provider’s datacenter for analysis and comparison with attenuated and obscured current distur-bances which are acquired at the substation or other upstream location.
C. Meter Reading and Data Collection
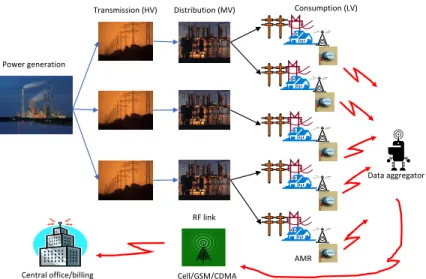
Contemporary deployments of Smart Grid systems collect electricity usage from the consumer’s meter and pass that information to a datacenter owned by the service provider or utility [3]. The network system which collects and transports this utilization data is commonly called an AMR/AMI system (automatic meter reading/advanced metering infrastructure) [7]. A generic architecture of an AMR/AMI system is shown in Figure 4. Data collected from the meters may be transmitted via one or more data networks, using unlicensed wireless spectrum (e.g. WiFi, RF aggregators, etc.), licensed wireless spectrum (e.g. cellular telephony), or some form of wired network (e.g. private fiber optic links, conventional power line communications, etc.). In this paradigm, the physical location of the meter is assumed to stay constant after installation, and the electrical location of the meter is derived from static logs and schematic drawings, which can be incomplete or inaccurate (as previously described).
Regardless of the data communications mechanisms for AMR/AMI data, it has been shown that current disturbances which occurdownstreamfrom the substation (e.g. at the meter) can be detectedupstream at the substation. For example, the TV data of Figure 3 and Figure 4 was collected upstream of the actual location of the system. This upstream flow of electrical current allows a unique signal, originating from a given meter, to be easily detected at the serving substation. Of course, only signals with frequency content which passes through all the transformers on the feeder are detectable, since higher frequencies are filtered out by the inherent low-pass nature of large series inductors, such as transformers.
For instance, the TV data in Figure 4 is dominated by low-frequency features or artifacts, such as the odd harmonics at multiples of 120Hz (Artifact 1) and the chirp (Artifact 2) which contains significant activity and amplitude below 1000 Hz. At the substation, HV is converted to MV through step-down transformers that lower the voltage but increase the current. As electrical power is distributed through the feeders and to the loads, downstream distribution transformers reduce the voltage from several thousand volts to several hundred volts. This process maintains constant power, and as
Fig. 3. Time-domain plot and spectrogram of TV turn-on current transient, with artifacts.
a result downstream current must increase. Looking at this system backwards from the endpoint (smart meter) toward the substation, disturbances in the LV-side current that flows upstream must be reduced by the aggregate turns-ratio of the intervening transformers on the feeder. This situation is described graphically in Figure 5. This physical reality causes the distribution grid to behave as a very stable and predictable current attenuator for current disturbances which flow upstream, or from the meter toward the substation. For example, a substation that operates at an MV of 38.4kV and delivers 120V to the consumer has an effective turns-ratio of 1:320. So, a current disturbance created at the meter would show up at the substation with amplitude of approximately 3% (1/320th) of its initial value, assuming no other losses. Thus, a current disturbance with amplitude of 10A at the meter will be detectable at the substation with amplitude of approximately 31mA. In this fashion, recognizable features of all current perturbations in the distribution grid propagate towards the substation. Of course, this propagation is subject to additional noise in the system and the native attenuation characteristic of the distribution transformers. This phenomenon is true for current signals which are purposefully injected (such as communication signals), and it is true for current disturbances which are caused natively or accidentally by all other grid-resident devices.
In the above example, 97% attenuation of a signal appears to be quite problematic. However, studies have shown that even low-level signals with recognizable features are readily detectable at the substation. In fact, current disturbances with attenuation over 99% of the initial amplitude can be detected at the substation. The frequency content of the disturbance is important, as there is a time-varying window of frequencies on every distribution grid which are amenable to good trans-mission. For example, low-frequency signals (below 400Hz) are swamped by the low-order power line harmonics and reso-nances from lumped reactive elements on the line, and higher
frequency signals (above 3000Hz) are often filtered out by the aggregate low-pass effect of power transformers and other system characteristics. However, current disturbances with frequency content between 200Hz and 3000Hz are transported directly and predictably towards to substation bus, through intervening distribution transformers, and in spite of additive or time-variant noise due to other grid-resident devices.
IV. PASSIVE ANDEFFICIENTLOCATIONMAPPING Current disturbances which are detected at the substation can be used in conjunction with features of current distur-bances observed at the meter (or other endpoint) to determine the ”electrical location” of grid-resident devices. The correla-tion/coherence of signals and/or signal characteristics at both points produces a unique feature set which can be used to determine which feeder, phase, and lateral to which the device is attached. When this information is used in conjunction with geo-spatial information from the set of meters which initially detected the disturbance, the grid location, which includes electrical and spatial location of the device that caused the disturbance, can be extracted. This feature set approach is valid because all the devices on the grid create asuper signal that is highly dependent on their locations. Thus, the direct path from the meter location to the substation must produce the best correlation of signals. Crosstalk signals from feeder to feeder, or phase to phase lines, will experience phase and time shifts due to the extra electrical length and additional transformer couplings (on the high side) this phenomenon reduces the effective correlation between the signals, and emphasizes the correct electrical location of the device. The fact that the line fundamental is 120-degrees out of phase on each per-phase link means that the feature correlation task can also be viewed as a best-fit classification problem over a time-varying channel. Consider a substation with 4 feeders distributing electricity to a neighborhood as shown in Figure 6:
At the substation, current transformers (CT) are installed to measure the current signals present on each feeder. These
Central office/billing
AMR Cell/GSM/CDMA
RF link
Fig. 4. Typical AMI backhaul architecture via cellular network.
LV
MV
Substation
Fig. 5. Current attenuation in the distribution grid.
current waveforms (or upstream current profiles, UCP) are sampled, time-stamped, and stored in a computer present at the substation or the service provider’s datacenter. At each smart meter, the local current signal (or downstream current profile, DCP) is sampled, time-stamped, processed, and transmitted along with the AMR/AMI meter data to the utility datacenter. The computer containing the UCPs also receives the DCPs from each meter. By aligning time stamps on the DCP and UCP data, the substation computer can compare all permutations of feeder and phase between the UCPs and DCPs. The resulting best match between DCP and UCP is flagged as the actual feeder/phase where the endpoint meter is located. Mathematically, this can be viewed as a maximization computation over a set of signal features, and is a common processing task for signal comparisons. For example, automatic target recognition systems use similar processing to extract specific target locations from audio/video data via a known feature vector for each target of interest.
A brute-force implementation of the approach described above includes high-sampling-rate acquisition of DCP signals and transmission of uncompressed DCP signals to an upstream location for comparison with multiple UCPs. This processing
clearly establishes an estimate for presence/absence of the downstream device (represented by its DCP) in the aggregated current profiles of several feeders (the UCPs). Unfortunately, high-rate acquisition and transmission of DCP data from multiple meters is not feasible using conventional AMR/AMI network infrastructure.
For example, assuming a 20kHz sampling rate at the meter with 16-bit resolution per-sample, the uncompressed band-width required for transmission of each DCP would exceed 320kbps. This data bandwidth can’t be supported within ex-isting remote metering infrastructure networks, particularly if thousands of meters were attempting to transmit usage data in addition to DCP profiles. As a result, to perform the described grid mapping operation using DCP data, some form of (lossy) compression of the DCP prior to transmission and processing at the upstream location is a critical notion. The compres-sion or feature extraction operation on DCP data (which is subject to the upstream fidelity criteria) is implicit in the pro-posed system architecture because of limited data transmission bandwidth between downstream and upstream locations. The techniques for data compression, the fidelity criteria, and the upstream operations for estimation of device presence/absence, along with processing for geo-spatial and network-architecture indicators are the subjects of this paper and future work. Clearly, an operation which involved cross-correlation and time-coherence between a specific, uncompressed DCP and multiple UCPs is a valid approach to the problem. However, the compression methods or feature extraction methods which must be implemented at the downstream meters to preserve transmission bandwidth while simultaneously preserving rec-ognizable features of the DCP are critical technologies.
The processing of the DCP prior to transmission is essen-tially a data compression or feature extraction operation. This operation must produce a set of features or compressed data which, when processed by upstream devices and compared with UCP data, produces clear indications of the presence or absence of a downstream device. The end-to-end system
Tra n sf o rm e r Substation Bus bar Feeder 1 Feeder 2 Feeder 3 Feeder 4 3φ Feeder 1, phase A Computer Feeder 3, phase C Feeder 4, phase B AMR
Fig. 6. Current attenuation in the distribution grid.
concept is very similar to feature extraction techniques which are used on fingerprint data. A reduced-fidelity representation of a fingerprint is captured, extracted, and stored. Then, the feature vector which uniquely identifies the fingerprint is compared to high-fidelity versions of a candidate fingerprint to create an indication of matching or similarity.
In the context of grid mapping and detection of current disturbances, techniques for DCP processing (or feature ex-traction) may include lossless data compression (e.g. LZW), transform coding (e.g. DCT/KLT), or other dimensionality reduction (e.g. ARMA, signal space techniques) followed by lossy compression, including scalar/vector quantization or signal space representations optimizing a weighted time-domain or frequency-time-domain fidelity criterion. This concept is important in allowing the upstream system to consume DCP data from all meters without exceeding system trans-mission capacity or interfering with bandwidth dedicated for AMR/AMI links. Thus, some feature extraction using raw sampled DCP data is necessary at the meter to reduce the size of the DCP data set to be transmitted.
However, these compression/extraction operations must re-tain important information in the signal for the mapping operation to succeed. Transport of the encoded, compressed, feature-extracted DCP data can be performed in-band using power line communications techniques which are intrinsic to grid infrastructure, or it can be performed out-of-band using communications infrastructure which is extrinsic to grid infrastructure. As a result, this technique does not require communication via the power line (from the meter to the substation). As such, no large amplifiers or coupling circuits are needed inside the smart meter itself. In fact most, if not all, of the required circuitry is already available inside a revenue-grade meter. In the simplest implementation, the DCP detected at the meter is sampled, processed for compression or feature extraction, and packaged for upstream transmission as part of the AMR/AMI meter data.
The DCP data from each meter can be aggregated at the utility central office or datacenter where the AMR/AMI data is received. In this fashion, computer hardware/software in the datacenter can analyze the UCP & DCP data and estimate each meter’s grid location. The estimated grid location data is then stored in the utility’s database updating their electrical grid map. A side benefit of this approach is that electrical mapping is done at a very slow rate. It only needs to happen once, and then periodic updates can happen much later. The DCP data can trickle out over the AMR/AMI wireless link for later analysis & registration using UCP information. Further, location errors due to DCP data snapshots can easily be corrected over time by keeping statistics on all computed locations and maximizing a likelihood function for meter or device location updates. In some cases, current disturbances detected at the meter and the substation feeder may be different, and the grid location computed/estimated for specific meters may be anomalous. However, errors in calculations will automatically be corrected as additional DCP & UCP data is collected and analyzed. Over time, an accurate grid location of each device will naturally emerge from the periodic mapping computations. This approach lends itself to a self-organizing network topology. Performing advanced system-level analysis such as power outage detection, power theft, power quality, or the like would require faster updates of the DCP data, and repeated comparisons with UCP data. In these cases, data compression or sub-sampled DCP data sets could mitigate any wireless capacity issue in a mesh network or other capacity-limited AMR/AMI system.
V. CONCLUDINGREMARKS
We presented a novel method to accurately and intelli-gently map device locations in a smart grid. The novelty of this approach is the comparison of downstream current profiles (DCP) with the superposition of current profiles at the substation (UCP). Since small amounts of noise current
compression of the sampled data at the meter or downstream location is important to reduce the size of the transmitted DCP. This allows the method to scale easily, given that it must service a large number of meters (and other devices) connected to each substation. GPS data from each smart meter is already available to assist in the reconciliation of geo-spatial location with electrical location.
We believe that the proposed technique will be a valuable addition to the grid. A patent based on the core idea of this paper was filed recently [8].
REFERENCES
[1] “Smart grid,” https://energy.gov/oe/services/technology-development/smart-grid, accessed: 2015,2016.
[2] E. Khan, B. Adebisi, and B. Honary, “Location based security for smart grid applications,”Energy Procedia, vol. 42, pp. 299–307, 2013. [3] X. Fang, S. Misra, G. Xue, and D. Yang, “Smart grid - the new and
improved power grid: A survey,” inIEEE Communications Surveys and Tutorials, vol. 14, 2012, pp. 944–980.
[4] A. R. Sallam and O. P. Malik, Electric Distribution Systems. IEEE Computer Society, 2011.
[5] S. Kaplan, “Smart grid. electrical power transmission: Background and policy issues,” inThe Capital.Net, Government Series, 2009, pp. 1–42. [6] “Suppression of interference in power and communications signals,” US
Patent 20160049988 A1, 2012.
[7] “AMR vs AMI,” http://www.elp.com/articles/powergrid international/print/volume-13/issue-10/features/amr-vs-ami.html, accessed: 2014,2015,2017.
[8] “Location mapping of grid devices using features of passively-observed current disturbances,” US Patent WO2015120141 A1, 2015.