Development and Validation of Stability Indicating
RP-HPLC Method for Simultaneous Estimation of
Paracetamol and Flupirtine maleate in Pure and
Pharmaceutical Dosage Forms
Mallikarjunarao Nagasarapu
1, Gowrisankar Dananna
21Department of Pharmaceutical Sciences, Jawaharlal Nehru Technological University, Kakinada, Andhra Pradesh, India.
2Department of Pharmaceutical Analysis & Quality Assurance, University College of Pharmaceutical Sciences, Andhra University, Visakhapatnam, Andhra Pradesh, India.
ABSTRACT
Objective: The objective of the proposed method was to develop a simple, fast, sensitive, and validated high-performance liquid chromatography (HPLC) method for the simultaneous estimation of Paracetamol and Flupirtine Maleate in combined-dosage form. Materials and Methods: A Hypersil BDS C18, 150 x 4.6, 5 µ column with mobile phase containing Phosphate buffer (Ph 6.2): Acetonitrile (600:400) was used. The flow rate was 1.0 mL/min, column temperature was 30°C and effluents were monitored at 245 nm. The retention times of Paracetamol and Flupirtine Maleate were 3.1 min and 5.2 min respectively. Results: The correlation co-efficient for Paracetamol and Flupirtine Maleate were found to be 0.99 and 1 respectively. The proposed method was validated with respect to linearity, accuracy, precision, specificity, and robustness. Recovery of Paracetamol and Flupirtine Maleate in formulations was found to be 100% and 100% respectively confirms the non-interferences of the excipients in the formulation. Degradation studies reveals that purity threshold is greater than the purity angle hence the peak is said to be pure. Conclusion: Due to its simplicity, rapidness and high precision, this method was successfully applied to the estimation of Paracetamol and Flupirtine Maleate in combined dosage form.
Key words: Flupritine maleate, method development, paracetamol, RP-HPLC, stability indicating and validation.
*Address for correspondence:
Dr. Mallikarjunarao, Research scholar, Department of Pharmaceutical Sciences, Jawaharlal Nehru Technological University, Kakinada, Andhra Pradesh, India. Email: [email protected]
INTRODUCTION
Paracetamol is chemically known as N-(4-hydroxyphenyl) acetamide. The empirical formula is C8H9NO2. Paracetamol is thought to act primarily in the CNS, increasing the pain threshold by inhibiting both isoforms of cyclo oxygenase, COX-1, COX-2, and COX-3 enzymes involved in prostaglandin (PG) synthesis. It functions as a weak inhibitor of the synthesis of prostaglandins (PGs).1The in vivo Access this article online
Journal Sponsor
Website:
www.jyoungpharm.org
effects of paracetamol are similar to those of the selective cyclooxygenase-2 (COX-2) inhibitors.2 Unlike NSAIDs,
acetaminophen does not inhibit cyclooxygenase in peripheral
tissues and, thus, has no peripheral anti-inflammatory
affects. The antipyretic properties of acetaminophen are likely due to direct effects on the heat-regulating centers of the hypothalamus resulting in peripheral validation, sweating and hence heat dissipation. The chemical structure of Paracetamol was shown in Figure 1.
Flupirtineis an aminopyridine that functions as a centrally acting non-opioid analgesic. It is chemically ethyl
N-(2-amino-6-{[(4-fluorophenyl) methyl] amino} pyridin-3-yl)
carbamateacts as selective neuronal potassium channel opener that also has NMDA receptor antagonist properties.3
The empirical formula is C15H17FN4O2.Flupirtine up
regulates Bcl-2, increases glutathione levels, activates an inwardly rectifying potassium channel, and delays loss of intermito chondrial membrane calcium retention capacity. Flupirtine acts like a NMDA receptor antagonists, but does not bind to the receptor. One study concluded that the
discriminative effects of flupirtine are neither of opioid
nor of alpha-1 adrenergic type, but are primarily mediated through alpha-2 adrenergic mechanisms. The chemical structure of Flupirtine Maleate was shown in Figure 2.
Literature survey revealed that few analytical methods such as and LC-MS,4 UV spectrophotometric,5-8 and
HPLC,9-14 methods have been reported for the estimation
of Flupirtine and hence we tried to develop and validate a new stability indicating RP-HPLC methodas per ICH guidelines,15,16 for the estimation of Flupirtine maleate and
paracetamol in bulk and pharmaceutical dosage forms.
MATERIALS AND METHOD
Instrumentation
The separation was carried out on HPLC system with
Waters 2695 alliance with binary HPLC pump, UV-Visible detector, Waters Empower 2 software and column Hypersil BDS C18, 150 x 4.6, 5 µ.
Chemicals and reagents
The working standards of Paracetamol, Flupirtine Maleate were provided as gift samples from Lara drugs Pvt. Ltd., Hyderabad. Marketed formulation of combination was purchased from local market. Methanol of HPLC grade was purchased from E. Merck (India) Ltd., Mumbai. Orthophosphoric Acid and Acetonitrile of AR grade were obtained from S.D. Fine Chemicals Ltd., Mumbai and milli Q water.
HPLC
conditionsThe mobile phase consisting of phosphate buffer (pH 6.5
± 0.1 adjusted with dilute orthophosphoric acid or dilute potassium hydroxide solution) Acetonitrile (HPLC grade)
were filtered through 0.45 µm membrane filter before use,
degassed and were pumped from the solvent reservoir in the ratio of 600:400 v/v was pumped into the column at
a flow rate of 1.0 mL/min. The column temperature was
30°C. The detection was monitored at 245 nm and the run time was 10 min. The volume of injection loop was 20 µL prior to injection of the drug solution the column was equilibrated for at least 30 min. with the mobile phase
flowing through the system.
Preparation of standard solution
Paracetamol
Accurately weighed quantity 32.5 mg of Paracetamol was
transferred into 100 mL of volumetric flask, add 30 ml diluent and sonicated to dissolve and diluted to volume with diluent. (Stock solution). From the above solution 10
ml was taken into 100 ml volumetric flask and diluted to volume with diluent.
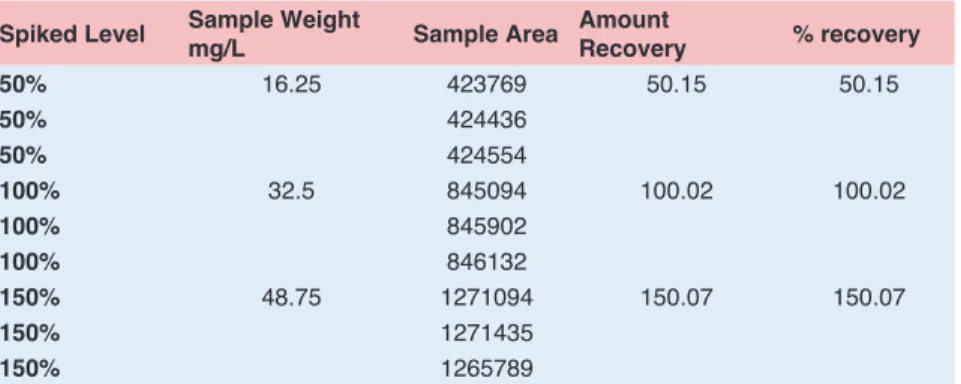
Table 2: Recovery studies for Paracetamol
Spiked Level Sample Weight mg/L Sample Area Amount Recovery % recovery
50% 16.25 423769 50.15 50.15
50% 424436
50% 424554
100% 32.5 845094 100.02 100.02
100% 845902
100% 846132
150% 48.75 1271094 150.07 150.07
150% 1271435
150% 1265789
Table 3: Recovery studies for Flupritine maleate
Spiked Level Sample Weight mg/L Sample Area Amount Recovery % recovery
50% 5 140998 50.05 100.11
50% 141323
50% 142096
100% 10 281325 100.28 100.28
100% 283029
100% 283435
150% 15 422675 149.39 99.59
150% 422132
150% 421854
Figure 4: Accuracy at 100% level
Figure 5: Accuracy at 150% level
Table 4: Intraday precision of paracetamol and flupritine maleate Sample
Weight(mg) Paracetamol Flupritine % Assay (Paracetamol) % Assay (Flupritine)
68 844123 281326 99.5 99.9
68 844905 282136 99.6 100.2
68.1 845213 282675 99.5 100.2
68.3 845540 283125 99.3 100.1
68.8 845658 283340 98.6 99.4
68.6 844890 283905 98.8 99.9
Average Assay 99.2 100.0
Flupirtine Maleate
Accurately weighed quantity 10 mg of Flupirtine Maleate
was transferred into 100mL of volumetric flask, add 30 ml diluent and sonicated to dissolve and dilute to volume with diluent. (Stock solution). From the above solution 10
ml was taken into 100 ml volumetric flask and diluted to volume with diluent.
Preparation of sample solution
Previously grinded powder equivalent to 68.094 mg weight
was transferred into 100 mL volumetric flask, added 30
mL of diluent, sonicated to dissolve for 10 minutes and
diluted to volume with diluent. The solution was filtered
through 0.45 µ filter. 10 ml of filtrate was diluted to 100 ml with diluent.
Method validation
System suitability studies
The concept behind the system suitability test is to ensure that the complete testing system is suitable for the intended application. The results of system suitability are presented in Table 1.
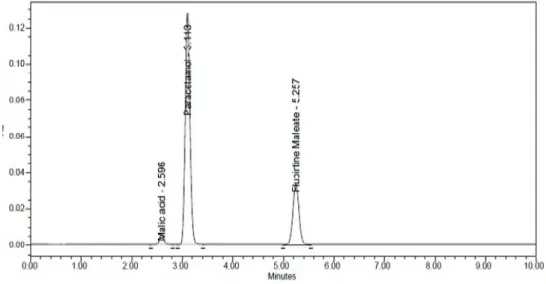
Specificity
Specificity is the ability of the developed method to detect
the analyte in the presence of components which may be expected to be present. Typically these might include impurities, degradants, matrix, etc.
Accuracy
The accuracy of an analytical procedure expresses the closeness of the agreement between the actual values to the mean analytical value. The accuracy of the method was determined by recovery experiments. The recovery studies were carried out at three concentration levels. Each level
was repeated for three times. The percentage recovery and standard deviation was calculated. The mean recoveries of Paracetamol, Flupirtine Maleate were found between 98% to 102%. The results indicated good accuracy of the method for the determination of analyzed drugs as revealed by mean recovery data. The results are presented in Table 2 & 3. The accuracy at three levels was shown in Figures 3, 4, & 5.
Precision
The precision of an analytical procedure expresses the closeness of agreement (degree of scatter) between a series of measurements obtained from multiple sampling of the same homogeneous sample under the prescribed conditions. The precision of the method was demonstrated by intra-day and inter-day variation studies. In the intra-day studies the assay on six test preparations were performed by injected into the chromatographic system as per the test method. The % assay of drug and percentage RSD were calculated. The inter-day variations of the method also determined by using six replicate injections of the same concentration and analyzed on two consecutive days and response factor of drugs peaks and percentage RSD was calculated. From the data obtained, the developed RP-HPLC method was found to be precise. The results are presented in Table 4 & 5.
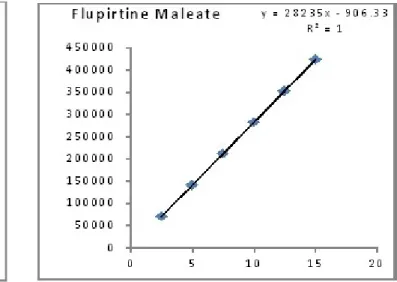
Linearity
The linearity of an analytical procedure is its ability (within a given range) to obtain test results which are directly proportional to the concentration (amount) of analyte in the sample. Chromatographic method was tested for linearity by plotting peak area against concentration of solutions. The plot of peak area versus the respective concentrations of Paracetamol and Flupirtine Maleate were found to be linear in the concentration range of 8-50 µg/ mL and 2.5-15 µg/mL respectively. The regression equation for Paracetamol is y=26287x – 4353 with a coefficient
of correlation (R2) of 0.99. The regression equation for
68.8 869434 293246 101.3 102.9
Average Assay 101.0 102.4
Flupirtine Maleate is y = 28235x-906.3 with a coefficient
of correlation (R2) of 1. The results shows that an excellent
correlation exists between areas and concentration of drugs within the concentration range indicated above. And the results for calibration curves are given in Figure 6 & 7. The results are presented in Table 6.
Limit of Detection and Limit of Quantification (LOD&LOQ)
The detection limit of an individual analytical procedure is the lowest amount of analyte in a sample which can be detected but not necessarily quantitated as an exact value. The quantitation limit of an individual analytical procedure is the lowest amount of analyte in a sample which can be quantitatively determined with suitable precision and accuracy. The quantitation limit is a parameter of quantitative assays for low levels of compounds in sample matrices, and is used particularly for the determination of impurities and/or degradation products.
(a) LOD= 3/s/n*100% conc
(b) LOQ=10/s/n*100% conc
LOD= 3/2415*2000 =2.484 (Paracetamol)
LOQ= 10/2415*2000=8.281(Paracetamol)
LOD= 3/128*10=0.2344 (Flupirtine Maleate)
LOQ= 10/128*10=0.7813 (Flupirtine Maleate)
Robustness
The robustness of an analytical procedure is a measure of its capacity to remain unaffected by small, but
deliberate variations in method parameters and provides an indication of its reliability during normal usage. The Robustness of the method was determined by making slight changes in the chromatographic conditions i.e.
flow variation ± 10% ( 0.9 ml and 1.10 ml/min), temp
variation ± 5% variation (25°c and 35°c). It was observed that there were no marked changes in the system suitability results, which demonstrated that the RP-HPLC method developed was robust.
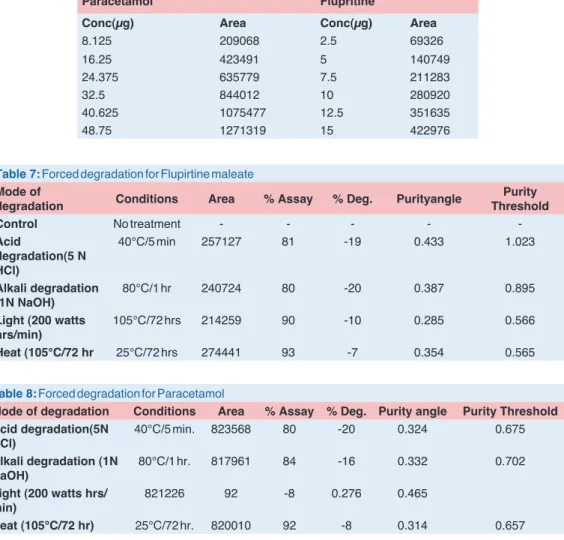
Forced Degradation Studies
The stability studies were determined by applying the physical stress (acid, base, thermal and light) to the product. It was observed that there were marked degradation in the chromatograms, and the data given in Tables 7& 8.
RESULTS AND DISCUSSION
is accurate. Calibration curve was plotted concentration versus areas. Linear correlation was found to be y = 26287x – 4353 for Paracetamol, y=28235x-906.3 for Flupirtine Maleate. The intra-day and inter-day variations were calculated in terms of % RSD. The low % RSD results revealed that method was precise. Method robustness was performed by making small deliberal changes in the chromatographic conditions. The robustness results proved that the method was robust. Degradation studied were performed under different conditions and in each condition it was observed that the purity threshold value was found to be greater than the purity angle value which indicates that the peak is pure i.e. no interference of degradants with the analyte peak.
CONCLUSION
The proposed HPLC method was found to be simple,
precise, accurate and sensitive for the simultaneous estimation of Paracetamol, Flupirtine Maleate in pharmaceutical dosage forms. Degradation studies reveals that the developed method was stability indicating Hence, this method can easily and conveniently adopt for routine quality control analysis of Paracetamol, Flupirtine Maleate in pure and its pharmaceutical dosage forms.
CONFLICT OF INTEREST
This study was unfunded. There were no conflicts of
interest.
ACKNOWLEDGEMENT
We acknowledge the pharmacy departments of Jawaharlal Nehru technological university, Kakinada and Andhra university for their assistance.
32.5 844012 10 280920
40.625 1075477 12.5 351635
48.75 1271319 15 422976
Table 7: Forced degradation for Flupirtine maleate
Mode of
degradation Conditions Area % Assay % Deg. Purityangle ThresholdPurity
Control No treatment - - - -
-Acid
degradation(5 N HCl)
40°C/5 min 257127 81 -19 0.433 1.023
Alkali degradation
(1N NaOH) 80°C/1 hr 240724 80 -20 0.387 0.895
Light (200 watts
hrs/min) 105°C/72 hrs 214259 90 -10 0.285 0.566
Heat (105°C/72 hr 25°C/72 hrs 274441 93 -7 0.354 0.565
Table 8: Forced degradation for Paracetamol
Mode of degradation Conditions Area % Assay % Deg. Purity angle Purity Threshold
Acid degradation(5N
HCl) 40°C/5 min. 823568 80 -20 0.324 0.675
Alkali degradation (1N
NaOH) 80°C/1 hr. 817961 84 -16 0.332 0.702
Light (200 watts hrs/
min) 821226 92 -8 0.276 0.465
REFERNCES
1. Karen methling et al. investigation of the in vitro metabolism of Analgesic flupiritine. The American society for Pharmacology and experimental Therapeutics; 2008. 1-49.
2. Available from URL http://www.drug2day.com/ index.php/drug/ display/27971 (accessed on Sep 12, 2011
3. Sweetman SC, Martindale. The complete drug reference, 34th ed.,
Royal Pharmaceutical Society of Great Britain, London; 2005. 4. Aneesh TP, Amal D. Method development and validation for
estimation of flupirtine maleate in bulk and pharmaceutical dosage forms using U.V-Visible Spectrophotometry. IRJP. 2011 2(12): 179-182.
5. Khanage SG, Mohite PB, Jadhav S. Development and validation of UV-Visible spectrophotometric method for simultaneous determination of eperisone and paracetamol in solid dosage form. Adv Pharm Bull. 2013; 3(2): 447–51.
6. Kumar AM, Swathi A, Supriya D, Prasad VVLN, Prakash V, Diwan. Development and validation of UV spectrophotometric method for simultaneous estimation of ibuprofen, paracetamol and caffeine in pharmaceutical dosage Form. Am J Pharm Tech Res. 2012; 2(6): 483.
7. Kapil K, Naik S, Garima J, Mishra N. Spectrophotometric method for simultaneous estimation of paracetamol and domperidone in Tablet formulation. Asian J Res Chem. 2009; 2(2): 112-4. 8. Shah U, Kavad M, Raval M. Development and validation of UV
spectrophotometric method for estimation of paracetamol and flupirtine maleate in bulk and pharmaceutical dosage form. Int J Pharm Tech Res. 2013; 5(3): 1007-13.
9. Attimarad M. Simultaneous determination of paracetamol and
lornoxicam by RP-HPLC in bulk and Tablet formulation. Pharm Ana J In pharm Asoc. 2011; 2(1): 61-6.
10. Gopinath R, Rajan S, Meyyanathan SN, Krishnaveni N , Suresh B. A RP-HPLC method for simultaneous estimation of paracetamol and aceclofenac in Tablets. Indian J Pharm Sci. 2007; 69(1): 137-40.
11. Gowramma B, Rajan S, Muralidharan S, Meyyanathan SN, Suresh B. A Validated RP-HPLC method for simultaneous estimation of paracetamol and diclofenac potassium in pharmaceutical formulation. Int J Chem. Tech. 2010; 2(1): 676-80.
12. Rao BM, Patel B, Jivani N, Digbijay K, Nitin S. Development and validation of HPLC method for simultaneous estimation of paracetamol and tapentadol hydrochloride in their combined dosage form. Inventi: ppaqa/1025/13, 2013.
13. Patel A, Patel N, Patel M, Lodha A, Chaudhuri J, Jadia P, et al. Development and validation of analytical methods for the simultaneous estimation of lornoxicam and paracetamol from their pharmaceutical dosage form. IOSR J Pharm. 2012; 2(3): 364-65. 14. Xing L, LIU, Ya XIA D, Tao GUO. Determination of the concentration
of flupirtine in human plasma by RP-HPLC. J Shenyang Pharm U. 2010; 27(7): 559 -62.
15. ICH, Q2 (R1) validation of analytical procedure, text and methodology. International conference on Harmonization, Nov; 1996.