Sharif University of Technology
Scientia IranicaTransactions B: Mechanical Engineering http://scientiairanica.sharif.edu
Eect of processing time on microstructure of surface
and corrosion resistance of coatings resulting from
plasma electrolytic oxidation on titanium alloy in
hydroxyapatite nano-particles electrolyte
B. Barooghi
a, M. Sheikhi
a;, and A. Amiri
ba. Department of Mechanical Engineering, Shahid Rajaee Teacher Training University, Tehran, P.O. Box 1678815811, Iran. b. Department of Mechanical Engineering, Islamic Azad University, North Tehran Branch, Tehran, Iran.
Received 17 February 2018; received in revised form 28 July 2018; accepted 24 September 2018
KEYWORDS Corrosion resistance; TiAl6V4;
Plasma electrolytic oxidation.
Abstract. This study investigated the eect of coating processing time on the microstructure of surface and corrosion resistance of coatings resulting from Plasma Electrolytic Oxidation (PEO) on the substrate of TiAl6V4 alloy. The coating processes in hydroxyapatite nano-powder electrolytic were carried out under the condition of constant voltage of 600 V and three dierent times of 125, 250, and 350 seconds. Studying the microstructure of coatings identied that the coating formed in 125 (s) had a more compact and steady structure with ne surface cavities and less porosity. The X-ray diraction pattern of coating demonstrates that this coating consists of oxide phases of titanium (rutile and anatase) and hydroxyapatite. Moreover, the study of corrosion resistance of coatings by potentiodynamic polarization and electrochemical impedance spectroscopy in corrosive solution of chloride sodium 3.5% showed that the coating formed in 125 s had the most signicant corrosion resistance potential and the least ICorr and, thus, the highest
resistance to corrosion.
© 2020 Sharif University of Technology. All rights reserved.
1. Introduction
Titanium and its alloys are highly applicable to the aerospace, chemical, biomedicine, energy, and marine industries [1,2] due to the perfect properties such as high rigidity relative to weight, almost low density, good corrosion resistance, high melting point, good bio-compatibility, and mechanical behavior [3,4]. In addition, the formation of an oxide and stable layer on titanium and its alloys while exposing air or moisture makes them able to be protected against oxidation and
*. Corresponding author. Tel.: +98 2122970060
E-mail address: [email protected] (M. Sheikhi) doi: 10.24200/sci.2018.50465.1710
corrosion resistance. Furthermore, the thin thickness of this layer (5 to 70 angstrom) may lead to the rapid destruction of some environments such as sulfuric, hydrochloric, and phosphoric acid [5,6]. On the other hand, tribological applications of titanium and its alloys are limited due to the low resistance to erosion, low rigidity, and high friction coecient [7]. There are several approaches to coating titanium and alloys including physical and chemical deposition of vapor, penetration processes, plasma spray, and laser and nitrating operation. The above-mentioned approaches may improve the properties through the formation of rigid coatings [8]. Most of the mentioned methods are expensive and time-consuming; there is a weak possibility for desirable adhesion [9]. Therefore, the plasma electrolyte oxidation process is derived from the
anodizing method and may cause ceramic oxide coat-ings that have been created in recent years. In PEO, mechanical properties, corrosion resistance, and erosion on light metals, such as titanium and aluminum, have improved with 10{100 micron coatings [10,11]. This coating approach is known as an electrical discharge process (unstable, ne, and short-life sparks) on the anode surface due to breakdown voltage with gaseous evolution [12,13]. PEO process is often carried out in weak and environment-compatible basic aqueous solu-tion consisting of silicate, phosphate, and aluminate elements [14]. The PEO process consists of substrate oxides and complex oxides [15]. There are dierent factors such as process factors (voltage, frequency, work cycle, and oxidation time) and characteristics of substrate and coatings (chemical composition, concen-tration, and temperature), aecting the properties of PEO coatings [16]. In this paper, the eect of coating process time on microstructure of surface and corrosion resistance of coatings formed on Ti6Al4V layer in hydroxyapatite nano-particles was investigated under constant voltage and in three dierent time periods. 2. Methodology
Ti6Al4V samples are selected with 20 millimeters in diameter and 5 millimeters in thickness as substrate in the coating process.
Before any coating process, the surface and edge of the sample are polished by number 60 to 1500 grinders, washed with distilled water, and dried with hot air ow. A coating bath of hydrate acetate calcium and di-hydrogen phosphate hydrate with concentra-tions of 0.04 and 0.01 M is used for the process, respectively. The processes are carried out using a 15 KW self-made coating device with a direct feeding resource and in constant conditions of 600 V and in three periods of 125, 250, and 350 seconds with a constant current density of 0.1 A/cm2. PH balance
and electrolyte conductivity were carried out by adding 10 g/l hydroxyapatite nano-powder to electrolyte. In this process, the titanium samples are used as anode, and a coat of stainless steel was used as cathode. The temperature was xed at 30{35C. After
coat-ing, the coated sample was taken out of electrolyte bath, washed with water, and dried by air. Table 1 demonstrates the properties of samples and process conditions.
In the primary stages of the PEO process, the current increased rapidly as gradually applied voltage (to 600 volts) increased, and severe oxidation and gaseous evolution occurred in coating baths. The surface microstructure of coatings was investigated by Scanning Electron Microscope (SEM). The size of cavities and the thickness of coatings were determined by software. Further, MIP software was used in
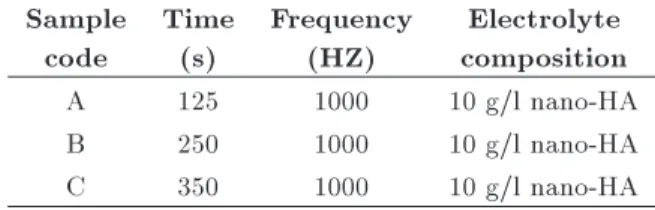
Table 1. The electrolyte properties and the coating process parameters.
Sample code
Time (s)
Frequency (HZ)
Electrolyte composition
A 125 1000 10 g/l nano-HA
B 250 1000 10 g/l nano-HA
C 350 1000 10 g/l nano-HA
order to determine the porosity percentage of coatings. The phase composition of coating was studied via the analysis of X-ray pattern by k Cu ray in a vector of 20 to 100 degrees. The corrosion resistance of titanium samples without coats and with dierent coats was investigated using electrochemical impedance spectroscopy and potentiodynamic polarization in 3.5% sodium chloride corrosive solution at room tempera-ture. These tests were carried out on a three-electrode at cell. In this cell, the tested sample with a oating level of 0.4-centimeter square is the electrode, plat-inum sticks as a supplementary electrode, and silver wire as a referenced electrode in the silver chloride-saturated solution (saturation in 3-molar potassium chloride solution). NOVA 11.1 software was used for extracting data resulting from curves and modeling the electrochemical impedance spectroscopy curves. Prior to conducting corrosion resistance tests, the samples oated in corrosive solution for 1800 seconds in order to achieve stability and measure the open-circuit poten-tial. The electrochemical impedance spectroscopy test was carried out at frequency rates of 0.01 to 100000 Hertz and 10 millivolts. By applying {250 millivolts potential toward open-circuit potential to 500 millivolts potential, the potentiodynamic polarization test was carried out at a rate of 1 millivolt per second on the samples. The tests tripled.
3. Discussion and results 3.1. Coating development
When applied voltage reached breakdown voltage, dielectric breakdown occurred in weak points such as cracks or impure ions on the surface [17]. After reaching the breakdown voltage of oxide layer, the electric discharge phenomena occurred on the surface of titanium sample and the current decreased smoothly. In the step coating, a non-nite number of white, ne, and short-life sparks are created on the anode surface. In fact, when oxygen is absorbed in the form of oxygen compositions, the electric discharge is known as a combustion phenomenon and an exothermic reaction including oxide factor [18]. The spark can alter temperature and local pressure of evacuation channels from 1000 to 10000 degrees (Kelvin) and from 100 to 1000 (mega Pascal), respectively, and may lead to the eruption of the lava from evacuation channels and
the formation of volcanic-crater-like cavities on the surface [19,20]. Over time, intensity and size of sparks increase as the number decreases. Their color gradually changes to yellow and, then, to orange. Since the coating bath and other conditions except time were the same in all of the three processes, the characteristics of sparks such as light and sound, number, size, intensity, and uniformity were similar until 125 s. By increasing the time of the process to 250 and 350 s, their size and intensity increase. The characteristics of sparks inuenced the microstructure of surface, size, and uniformity of micro cavities and corrosion resistance properties of the formed coatings in dierent periods. 3.2. Microstructure of surface
In order to characterize the coating created on sub-strate, the pictures of the scanning electron microscope were used. Figure 1 shows the picture of the scanning electron microscope taken from Ti6Al4V substrate before the coating process. This picture shows a uni-form surface with lines and cavities resulting from the surface polishing process. Figure 2 reveals the surface microstructures of the formed coatings in dierent time periods. As can be observed, the surface of all coated samples at dierent times is non-uniform and porous in comparison with uncoated ones due to the formation of micro sparks in the substrate during the process. The average size of surface micro cavities and computed porosity percent are given in Table 2 by dierent coating analysis software products. An increase in the time of processing may lead to greater intensive and larger evacuation, resulting in a larger structure of the coating surface due to the formation of relatively large cavities [21]. Therefore, the data presented in Table 2 showed that time increment from 125 to 350 s might lead to the growth of surface structure and the size of micro cavities. Nevertheless, according to the size development and the decreasing number of micro-cavities because of a pressure drop in evacuation
Figure 1. SEM image from titanium sublayer without coating.
Figure 2. Surface microstructures of formed coatings in (a) 125, (b) 250, and (c) 350 s.
Table 2. The thickness, porosity percentage, pore diameter, and roughness of coatings in dierent times.
Sample code
Porosity percentage
(%)
Pores average diameter
(m)
Thickness (m)
Time (s)
A 5.6 1.07 28 125
B 5.93 1.21 30 250
C 6.8 1.33 34 350
channels during processing [22], the surface porosity percentage increased and, then, decreased over time. It is obvious that the surface microstructure of coatings in 125 s has the least surface micro cavities, the least porosity percent, and the highest density. In fact, the size of cavities based on processing time increment in-creased due to the application of less electrical current and dielectric stability [22]. Moreover, by increasing the time of processing from 125 to 350 s, the thickness of coatings increased, too (Table 2).
3.3. Phase composition of coating
Two groups of coating baths were used in PEO pro-cesses. The rst group may cause metal oxides with oxygen in coating, and the second group includes anion elements that insert other elements (except oxygen) in coatings [9]. Figure 3 shows the Energy Dispersive X-ray Spectroscopy (EDS) analysis of the coated sample in dierent times. The results demonstrated that the coating consisted of Al as anion of coating and Ti as substrate of titanium. The X-ray pattern of the coated sample is given in Figure 4 for studying the phase composition and EDS analysis. Titanium oxide (TiO2) used in many industries, such as cell phones,
Figure 3. Energy Dispersive X-ray Spectroscopy (EDS) analysis of the coated samples in (a) 125, (b) 250, and (c) 300 s.
Figure 4. XRD pattern for the coated samples.
vehicles, and medical implements, can be formed on titanium and alloys through the PEO process. rutile, anatase, and brookite are the three forms of titanium oxide. Rutile has high sustainability and enjoys good mechanical properties due to high rigidity and better protection properties in comparison with anatase. In XRD pattern of Figure 4, rutile and anatase titanium oxide phases and a few hydroxyapatite are observed. In addition, X-ray can easily penetrate titanium sub-strate, and titanium-related peaks appear in XRD pattern because of porosity and thinness of coatings. Hydroxyapatite phase is visible in all three coatings, and the amount of this phase in coating A is the most. Rutile phase available in coating A having more amount than others and the simulation of this phase with hydroxyapatite phase can be a good combination for applying this kind of coating in medical care such as implements.
3.4. Corrosion resistance
Electrochemical impedance spectroscopy and potentio-dynamic polarization tests were carried out in order to evaluate the resistance to corrosion in coated samples in dierent periods and their comparison.
3.4.1. Electrochemical impedance spectroscopy test Nyquist curves obtained from electrochemical impedance spectroscopy tests of coated and uncoated titanium samples are given in Figure 5. In these curves, the imaginary part of impedance is drawn based on real part in each frequency after 1800 s oating in corrosive solution of 3.5% sodium chloride. As can be observed, the Nyquist curve of uncoated titanium substrate has a half-ring capacitor in every frequency. This behavior is because of forming an electrical layer on the sample surface and a time constant in the circuit, as presented in Figure 6(a). The corrosion resistance was calculated by measuring the diameter of the half ring in substrate Nyquist curve. In contrast, the Nyquist curves of coated
Figure 5. Electrochemical impedance spectroscopy tests of coated and uncoated titanium samples in corrosive solution of 3.5% sodium chloride.
Figure 6. Equivalent circuit for modeling of data from Electrochemical Impedance Spectroscopy (EIS): (a) Uncoated titanium and (b) coated titanium.
samples have 2 half-ring capacitors. The larger ring appearing at low frequencies is related to the internal dense layer, and the smaller ring at high frequencies is related to the external porous layer [23]. The internal dense layer forms due to the voltage applied to metal, and the porous layer forms due to the plasma reaction with metal and coating bath during processing [1]. The Nyquist curve of coating formed in 350 s had a smaller diameter in comparison with two other coatings and even uncoated titanium substrate. This shows weaker corrosion resistance of this coating, compared with other samples. As explained in Figure 4, the coating C has less rutile and hydroxyapatite than others, and it can be due to the relative destruction of the upper layer on titanium during the PEO process [24]. In contrast, the diameter of rings in Nyquist curves was related to the coatings formed in 125 and 250 s from the diameter of rings related to the bigger titanium substrate because of rutile and hydroxyapatite phases available. This shows better corrosion resistance of these two coatings in comparison with that of uncoated substrate. The extracted corrosion resistance of internal layers from equal circuit is reported in Table 3. Since the resistance of internal layer is more than that of the external layer, the corrosion resistance of coatings depending on internal and external layers plays no signicant role. Nyquist curves of the coatings formed
Table 3. Extracted corrosion resistance of internal layers from electrochemical impedance spectroscopy tests in dierent times.
Sample code n Y0
( 1Sncm 2)
R1
(cm2)
Uncoated (bare) 0.838 51.5 5:87 104
A 0.845 68 2:16 106
B 0.829 98 1:1 106
C 0.840 189 2:06 104
in 180 s have the largest ring diameter and, therefore, the biggest corrosion resistance among all samples. In this sample, the corrosion resistance is about 37 times more than the uncoated substrate resistance.
3.4.2. Potentiodynamic polarization test
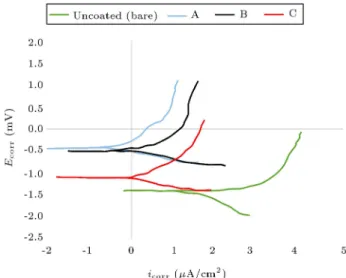
Potentiodynamic polarization test was carried out in order to verify the corrosion resistance behavior of the coated and uncoated samples. Potentiodynamic polarization curves for coated and uncoated titanium substrates in corrosive solution of 3.5% sodium chloride can be seen in Figure 7. As can be observed, by applying a coating to the sample in 125 and 250 s, the curves are delivered to upside to the left and in 350 s to the right and up toward the curve of the uncoated sample. The sample coated in 125 s had the most transportation and the best behavior. This curve has the most positive corrosive potential and the least density of corrosive current. By increasing the coating time, the corrosion resistance potential becomes more negative, the current density increases, and the curves move on to the right side. While corrosion resistance potential shows the thermodynamic trend to corrosion resistance, the density of corrosive current shows the corrosion resistance rate of samples [25]. Since the density of corrosion resistance current decreases [25], corrosion resistance increases and the coated sample in 350 s has the highest density of corrosion current and the least corrosion resistance in comparison with the two other coated and uncoated substrates. However, corrosive potential related to this sample was more signicant than the uncoated substrate. In fact, the more signicant corrosive potential demonstrates higher chemical sustainability of the titanium sub-strate [1]. Since the only altered factor in this paper is the processing time, the surface microstructure is
Figure 7. Potentiodynamic polarization curves for coated and uncoated titanium substrates in corrosive solution of 3.5% sodium chloride.
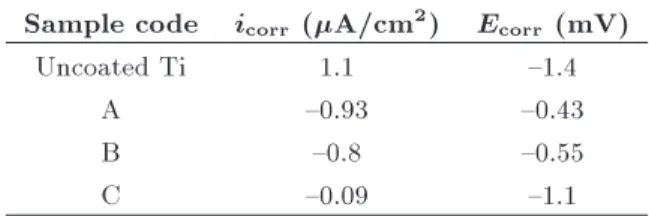
Table 4. Corrosion potential and density of corrosion current extracted from potentiodynamic polarization curves of coated and uncoated titanium substrate in corrosive solution of 3.5% sodium chloride.
Sample code icorr (A/cm2) Ecorr (mV)
Uncoated Ti 1.1 {1.4
A {0.93 {0.43
B {0.8 {0.55
C {0.09 {1.1
the most important parameter eective in corrosion resistance of coatings. In fact, the micro cavities on the surface of coatings acted as paths for corrosive ions for reaching substrate and aecting corrosive resistance [26]. Therefore, by increasing the time of the coating process from 125 to 350 s despite increasing the thickness of coating for increasing the size of cavities and porosities, the corrosive resistance of the coated sample decreased. Therefore, to eectively prevent coating corrosion, resistance should be free from struc-tural deformations such as porosity and thickness. Cor-rosion potential and density of corCor-rosion current were derived from potentiodynamic polarization curves, as given in Table 4. As can be observed, the coated sample in 125 s had the more signicant corrosion potential, the least density of corrosive current, and the best corrosion resistance, compared to other samples. In fact, the density of corrosion resistance current in this sample is about 2.5 times less than that in the uncoated substrate.
4. Conclusion
This study investigated the eect of processing time on surface microstructure and corrosion resistance of coatings from the plasma electrolytic oxidation process on pure titanium substrate. The results are as follows:
1. Increasing the processing time of coating from 125 to 350 s may lead to an increase in the size of surface micro cavities, a decrease in the number of cavities, and magnication of the structure of coatings due to the formation of larger and more intensive sparks and also thickness. Therefore, the microstructure of coatings formed in 125 s had the least size of surface micro cavities, the least porosity percentage, and the highest density and uniformity;
2. X-ray pattern of coatings formed in 125 s demon-strated that this coating consisted of titanium oxide phases and hydroxyapatite;
3. Studying corrosion resistance behavior showed that more amounts of rutile and hydroxyapatite avail-able in coating led to an increase in the corrosion resistance. However, the porosity percent, surface micro sparks, density, and coating uniformity have
to be simultaneous with these phases to improve corrosion resistance considerably;
4. Increasing the processing time led to decreasing the corrosion resistance of coatings. Then, the coating formed in 125 s showed the best corrosion resistance. Corrosion resistance in this sample was about 37 times greater than the uncoated substrate resistance;
5. The corrosion resistance potential of coatings de-creased and the density of corrosion resistance current increased as the processing time increased. Therefore, the coatings formed in 125 s had the most signicant corrosion resistance potential and the least density of corrosion current and, as a result, the best corrosion resistance. The density of corrosion resistance current in this sample de-creased about 2.5 times in comparison with the uncoated substrate.
References
1. Yazici, S.K., Muhael, M., and Baydogan, M. \Eect of incorporating carbon nanotubes into electrolyte on surface morphology of micro arc oxidized Cp-Ti", Applied Surface Science, 318, pp. 10{14 (2014).
2. Wang, J.H., Wang, J., Lu, Y., Du, M.H., and Han, F.Zh. \Eects of single pulse energy on the properties of ceramic coating prepared by micro-arc oxidation on Ti alloy", Applied Surface Science, 324, pp. 405{413 (2015).
3. Shokouhfar, M., Dehganian, C., and Baradaran, A. \Preparation of ceramic coating on Ti substrate by plasma electrolytic oxidation in dierent electrolytes and evaluation of its corrosion resistance", Applied Surface Science, 257, pp. 2617{2624 (2011).
4. Hussein, R.O., Nie, X., and Northwood, D.O. \A spec-troscopic and microstructural study of oxide coatings produced on a Ti-6Al-4V alloy by plasma electrolytic oxidation", Materials Chemistry and Physics, 134, pp. 484{492 (2012).
5. Yao, Zh., Jiang, Zh., Wu, X., and Wu, Zh. \Eects of ceramic coating by micro-plasma oxidation on the corrosion resistance of Ti-6Al-4V alloy", Surface and Coatings Technology, 200, pp. 2445{2450 (2005).
6. Garsivaz Jazi, M.R., Golzar, M.A., Raeissi, K., and Fazel, M. \Evaluation of corrosion and tribocorrosion of plasma electrolytic oxidation treated Ti-6Al-4V alloy", Surface and Coatings Technology, 244, pp. 29{ 36 (2014).
7. Mu, M., Liang, J., Zhou, X., and Xiao, Q. \One-step preparation of TiO2/MoS2 composite coating on Ti6Al4V alloy by plasma electrolytic oxidation and its tribological properties", Surface and Coatings Technology, 214, pp. 124{130 (2013).
8. Aliofkhazraei, M., Gharabagh, R.S., Teimouri, M., and Ahmadzadeh, M., Darband, B., and Hasannejad, H. \Ceria embedded nanocomposite coating fabricated by plasma electrolytic oxidation on titanium", Journal of Alloys and Compounds, 685, pp. 376{383 (2016).
9. Shokouhfar, M. and Allahkaram, S.R. \Formation mechanism and surface characterization of ceramic composite coatings on pure titanium prepared by micro-arc oxidation in electrolytes containing nanopar-ticles", Surface and Coatings Technology, 291, pp. 396{405 (2016).
10. Qin, Y., Xiong, D., and Li, J. \Tribological properties of laser surface textured and plasma electrolytic ox-idation duplex-treated Ti6Al4V alloy deposited with MoS2 lm", Surface and Coatings Technology, 269, pp. 266{272 (2015).
11. Sabaghi, M. and Fattah-alhosseini, A. \Eect of KOH concentration on the electrochemical behavior of coatings formed by pulsed DC micro-arc oxidation (MAO) on AZ31B Mg alloy", Journal of Alloys and Compounds, 661, pp. 237{244 (2016).
12. Campanelli, L.C., Durate, L.T., Silva, P.S., and Bol-farini, C. \Fatigue behavior of modied surface of Ti-6Al-7Nb and CP-Ti by micro-arc oxidation", Materials and Design, 64, pp. 393{399 (2014)
13. Stojadinovic, S., Radic, N., Vasilic, R., Petkovic, M., Stefanov, P., and Zekovic, L. \Photocatalytic properties of TiO2/WO3 coatings formed by plasma electrolytic oxidation of titanium in 12-tungstosilicic acid", Applied Catalysis, B: Environmental, pp. 334{ 341 (2012).
14. Aliasghari, S., Nemcova, A., Skeldon, P., and Thom-son, G.E. \Inuence of coating morphology on adhesive bonding of titanium pre-treated by plasma electrolytic oxidation", Surface and Coatings Technology, 289, pp. 101{109 (2016).
15. Khorasanian, M., Dehghan, A., Shariat, M.H., and Bahrololoom, M.E. \Microstructure and wear resis-tance of oxide coatings on Ti-6Al-4V produced by plasma electrolytic oxidation in an inexpensive elec-trolyt", Surface and Coatings Technology, 206, pp. 1495{1502 (2011).
16. Wang, Y.H., Liu, Zh.G., Ouyang, J.H., Wang, Y.M., and Zhou, Y. \Inuence of electrolyte compositions on structure and high temperature oxidation resistance of microarc oxidation coatings formed on Ti2AlNb alloy", Journal of Alloys and Compounds, 647, pp. 431{437 (2015).
17. Wang, H., Liu, F., Xiong, X., Zeng, X., and Lin, P. \Structure, corrosion resistance and in vitrobioactivity of Ca and P containing TiO2 coating fabricated on NiTi alloy by plasma electrolytic oxidation", Applied Surface Science, 356, pp. 1234{1243 (2015).
18. Park, T.E., Choe, H.C., and Brantley, W.A. \Bioac-tivity evaluation of porous TiO2 surface formed on titanium in mixed electrolyte by spark anodization", Surface and Coatings Technology, 235, pp. 706{713 (2013).
19. Sarbishei, S., Faghihi Sani, M.A., and Mohammadi, M.R. \Eects of alumina nanoparticles concentration on microstructure and corrosion behavior of coat-ings formed on titanium substrate via PEO process", Ceramics International Journal, 42, pp. 8789{8797 (2016).
20. Liu, F., Xu, J.L., Wang, F.P., and Zhao, L.C. \Eects of cathodic voltages on the structure and properties of ceramic coatings formed on NiTi alloy by micro-arc oxidation", Materials Chemistry and Physics, 121, pp. 172{177 (2010).
21. Dehnavi, V., Luan, B., Liu, X.Y., Shoesmith, D.W., and Rohani, S. \Production of ceramic coatings on AA6061 aliminium alloy using plasma electrolyte oxi-dation", Material Science and Technology, 12, pp. 27{ 31 (2013).
22. Durdu, S., Deniz, O.F., Kutbay, I., and Usta, M. \Characterization and formation of hydroxyapatite on Ti6Al4V coated by plasma electrolytic oxidation", Journal of Alloys and Compounds, 551, pp. 422{429 (2013).
23. Fattah-Alhosseini, A., Vakili-Azghandi, M., and Ke-shavarz, M.K. \Inuence of concentrations of KOH and Na2SiO3 electrolytes on the electrochemical Be-havior of ceramic coatings on 6061 Al alloy processed by plasma electrolytic oxidation", Acta Metallurgica Sinica (English Letters), 29, pp. 274{281 (2016).
24. Teng, F.Y., Tai, I., Wang, M.W., Wang, Y.J., Hung, CH., and Tseng, Ch. \The structures, electrochemical and cell performance of titania lms formed on tita-nium by micro-arc oxidation", Journal of the Taiwan Institute of Chemical Engineers, 45, pp. 1331{1337 (2014).
25. Yao, Zh., Jiang, Sh., Xin, X., Sun, X., and Wu, X. \Electrochemical impedance spectroscopy of ceramic coatings on Ti-6Al-4V by micro-plasma oxidation", Electrochimica Acta, 50, pp. 3273{3279 (2005).
26. Babaei, M., Dehghanian, Ch., and Vanaki, M. \Eect of additive on electrochemical corrosion properties of plasma electrolytic oxidation coatings formed on CP Ti under dierent processing frequency", Applied Surface Science, 357(1), pp. 712{720 (2015).
Biographies
Babak Barooghi is a PhD Candidate of Manufactur-ing EngineerManufactur-ing at Shahid Rajaeei University, Tehran, Iran. He obtained his BSc and MSc degrees from Tabriz and Tarbiat Modarres University in 2010 and 2012, respectively. His PhD thesis is on the coating of titanium alloy with Plasma Electrolyte Oxidation (PEO) method, and his current research interests include coating and biomaterial properties of light alloys.
Mohammadmorad Sheikhi received the PhD degree in Manufacturing Engineering in 2009 from Tarbiat
Modares University, Tehran, Iran. He is currently an Assistant Professor of Mechanical Engineering at Uni-versity of Shahid Rajaeei, Tehran, Iran. His research interests are optical measuring, structured light, three-dimensional scanner, hydroforming, and metal coating. Amir Amiri was born in 1983. He received the BSc degree in Mechanical Engineering in 2006 from Tabriz
University and the MSc and PhD degrees in Mechan-ical Engineering from Tarbiat Modares University in 2008 and 2013, respectively. In 2014, he joined the Department of Engineering, Islamic Azad University-North Tehran Branch as an Assistant Professor. His current research interests include metal forming, heat treatment, thermomechanical processing of metals, and metal coating.