Estimation of diagnostic reference levels for children
computed tomography: A study in Tehran, Iran
INTRODUCTION
Computed tomography (CT) serves as a gold
standard modality for detection and management of many different diseases. As a life
-saving approach, CT has a great role in pediatric medicine. Recent reports have indicated a rise in CT imaging for pediatric diseases. According to some studies, about 5 to 9 million CT imaging are performed annually on children in the
United States (1, 2). Also, the improvement of CT hardware and software technologies, have resulted in more interest among pediatricians to prescribe CT scans (3).
It has been reported that almost one half of the total medical radiation exposure is due to CT imaging (4). A considerable amount of literature
has been published on CT radiation dose assessment, reduction, and protection. Regarding pediatric cases, there are unique
R. Afzalipour
1,2, H. Abdollahi
3, M.S. Hajializadeh
2, S. Jafari
4,
S.R. Mahdavi
1,5*¹Department of Medical Physics, School of Medicine, Iran University of Medical Sciences, Tehran, Iran 2Student Research Committee, School of Medicine, Iran University of Medical Sciences, Tehran, Iran 3Department of Radiologic Sciences and Medical Physics, School of Allied Medicine, Kerman University of Medical
Sciences, Kerman, Iran
4Department of Radiology Technology, School of Paramedicine, Hamadan University of Medical Sciences, Hamadan, Iran
5Radiation Biology Research Center, Iran University of Medical Sciences, Tehran, Iran
ABSTRACT
Background:The Diagnostic reference levels (DRLs) play a critical role in the optimization of radiation dose especially, in some conditions like pediatrics. They are useful indicators by which the radiologists can be aware of delivered excess radiation doses to the patients, and take corrective actions if necessary. In order to meet some requirements for establishing the national computed tomography DRLs tables, much studies are needed all around the country. Materials and Methods: All active computed tomography (CT) scanners in public and private centers in Tehran were identified and checked for quality assurance and control certification. Eleven centers were chosen to be studied according to CT examination frequencies. Weighted CT dose index (CTDIw) and dose length product (DLP) for head, sinus, chest and abdomen/ pelvis scans of children were obtained from scanner’s operator consoles and classified into four groups based on their ages (A; <1 year, B; 1-5 years, C; 5 -10 years and D; -10-15 years). The 3rd quartiles of CTDIw were considered as DRLs and compared with the reported European Union (EU) and United Kingdom (UK) ones. Results: DRLs for head, sinus, chest and abdomen/pelvis scans were found to be 86.76, 31.33, 6.33, 7.65 mGy; 43.38, 31.33, 6.33, 7.65 mGy; 43, 31.33, 6.33, 7.65 mGy and 44.53, 31.33, 6.33, 7.65 mGy in the four groups (A-D) respectively. They are lower than the reported DRLs in EU and UK. Conclusion: There are variations in the radiation dose between the CT centers and identical scanners indicating the necessity for dose optimization. The data reported in this study can be remarkably useful in this concern.
Keywords: Computed tomography, diagnostic reference levels, children, Tehran, Iran.
*Corresponding authors: Seyed Rabi Mahdavi, Ph.D., E-mail:
Revised: May 2018
Accepted: July 2018
Int. J. Radiat. Res., July 2019; 17(3): 415-421
►
Original article
DOI: 10.18869/acadpub.ijrr.17.3.15
considerations for the radiation exposure concerns including: more radiosensitivity, longer life expectancy, and smaller body size (more radiation absorption). In the light of that,
there is more risk for developing the radiation-related cancer in children compared
with adults exposed to identical CT scan (5, 6). The CT radiation dose pertains to several
factors including the type of scanner, the filtration, the scan time, the body thickness;
moreover to the exposure parameters and imaging protocols. In order to lessen the variations in dose assessment and also to optimize the radiation protection, The International Commission on Radiological Protection (ICRP) in 1997 had introduced the
criteria called Diagnostic Reference Levels (DRLs) (7), in the goal of reducing the excessive radiation exposure by setting given thresholds.
Recently, several studies on CT DRLs have been conducted in different countries, and some of which have been updated subsequently (8-10). In addition, a considerable amount of data was reported on pediatric computed tomography DRLs worldwide. Vassileva et al. conducted an international study on pediatric CT DRLs in four age levels groups including, 1-year, 1–5 y, 5–10 y and 10 –15 y. They established the international DRLs at rounded 75th percentile values of the
distribution of median values from all CT facilities. Their Results showed that DRLs for
CTDIvol is similar to the reference values from other published reports, with some differences
for chest and abdomen CT scans. Higher variations were observed between DLP values,
based on a survey of whole multi-phase exams (11). Bibbo et al., estimated the CT DRLs of pediatric examinations at a dedicated Australian pediatric hospital. Based on their results, the
75th percentile DRLs were found to be acceptable when compared with those published
by the Australian National Radiation Dose Register and other two national children's hospitals, and also with the National Reference Doses for the UK. The 95th percentiles of CTDIvol for the various CT examinations were found to be acceptable values for the CT scanner Dose-Check notification (12). Fukushima et al established the DRLs of CT in Japan using
416
dose–length product (DLPs). In their study, DRLs were defined as the 25th and 75th percentiles of
DLPs and that of the head CT of pediatric patients tended to be higher than the data reported from the EU or other countries (13). Janbabanezhad-Toori et al. have reported a pediatric dose assessment in common CT examinations for the purpose of establishing the
regional DRLs in Mazandaran state, a northern province in Iran (14). In their study, different values of DLPs were reported as the regional DRLs for brain, sinus, chest, abdomen and pelvic CT examinations.
In Tehran province, the capital of the Islamic Republic of Iran, there is a large number
of medical centers; equipped with CT scanners; and to the best of our knowledge, there are no published reports concerning the CT DRLs for pediatric. Therefore, we aimed in this study to establish the DRLs for pediatrics CT scans based on a the four age level groups classification, in Tehran state.
MATERIALS AND METHODS
CT scanners and data collectionThis work was conducted as a prospective descriptive cross-sectional study with ethical considerations in Tehran, Iran. All ethics issues were passed through the ethics committee of Tehran University of Medical Sciences. In this study, all active computed tomography (CT) scanners in the public and private centers in Tehran province were identified and checked for the quality assurance and control certification. The Required data were obtained from Iran's Atomic Energy Organization. Eleven centers were chosen to be investigated according to CT examination frequencies. For each scanner, the factors including: the Manufacturer, model, year of installation, number of detector rows, the presence or absence of automatic exposure control (AEC) and also the presence or absence of the CTDI display were recorded. Moreover, the examination protocols such as the slice thickness, exposure parameters (mAs, KVp),
scan length and pitch factor for patients undergoing CT imaging were obtained and
recorded. The Patient’s demographic information was also collected.
CT dose quantities and validation
Two quantities including the dose length product (DLP) in mGy∙cm and the volumetric CT dose Index (CTDIv) in mGy were provided by current scanners and displayed on the control console. DRLs can be established based on
CTDIW or DLP. The most frequent CT examinations like; head, sinus, chest and abdomen/pelvis scans of children were considered for obtaining the quantities from
scanner’s operator consoles, and then they were classified according to the four age groups of patients as follow: A; <1 year, B; 1-5 years, C; 5-10 years and D; 10-15 years.
From each group, all data pertaining to these procedures performed over a period of 1 year were collected. To ensure the accuracy and precision of the quantities displayed on the console, we performed standard CT dosimetry based on the protocol recommended by the European Commission (15). For this reason, we used two head and body phantoms made of Poltmthylmethacrylate (PMMA) with 16 and 32 cm in diameter, respectively to calculate the CTDIW and DLP. These cylindrical phantoms had four holes at 90° intervals on the periphery and one in the center to insert radiation dosimeter. All dose measurements were performed using a 100 mm long pencil ionization chamber
(Barracuda; Rti Electronics Ab, Sweden) corrected for the changes in the environmental
temperature and pressure conditions. In each center, the phantoms were scanned with the same parameters as daily routine protocols. Peripheral (p) and central (c) CTDI were measured and then weighted CT dose index
(CTDIw), CTDIv, and DLP were calculated by the following equations (1, 2 and 3):
CTDIw = 1/3 (CTDIc) + 2/3 (CTDIp) (1) CTDIv= CTDIw/pitch (2) DLP = CTDIv × scan length (3) The calculated CTDIv and CTDIv displayed on the control console were compared to ensure that the difference between the two values was
not significant and not exceed the limitss recommended by relevant regulatory bodies
such as Iran's Atomic Energy Organization. Statistical analysis
The collected data were analyzed using SPSS
v. 19.0 (PASW, Chicago, IL). CTDIW was expressed in the order of mean, min and max
values. 3rd quartiles of CTDIw were considered as local DRLs and compared with the reported ones by European Union (EU) and United Kingdom (UK).
RESULTS
There are fifty-five active CT centers in Tehran. Eleven centers equipped with spiral CT
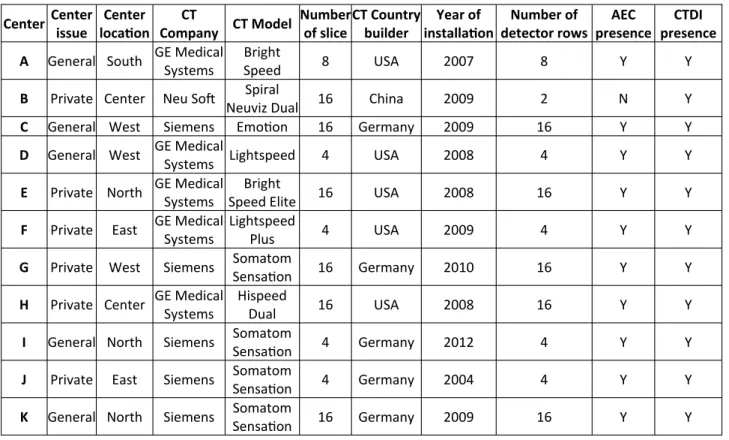
scanners which provide the criteria for this study. Table 1 shows the specifications of CT centers including: the manufacturer, model, year of installation, number of detector rows, the presence or absence of automatic exposure control (AEC) and CTDI display.
The Results of the experimental phantom dosimetry are shown in figure 1. The measured CTDIw had a range of 12-28 and 5-15 mGy for head and body phantoms, respectively. There were no significant differences between these
quantities and those reported by scanner consoles, and they were in the acceptable range
recommended by Iran's Atomic Energy Organization.
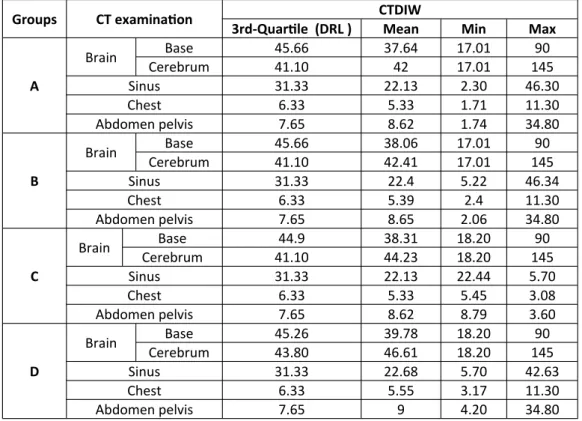
Table 2 shows in details the results of CTDIw quantity for the 4-age groups. The 3rd quartiles of CTDIw as DRLs along with the mean, min and max values were determined. In table 3, we can see the results of DLPs and DRLs compared with the UK and EU values.
DISCUSSION
The study results revealed the wide ranges of CT procedures that performed currently in Teh-ran province among which the head, sinus, chest and abdomen/pelvis were the most frequent scans. Also, there were many special pediatric
417
Int. J. Radiat. Res., Vol. 17 No. 3, July 2019hospitals equipped with new CT systems. On the other hand, new advancements in hardware and software technologies of CT have resulted in more interest among pediatricians to prescribe CT scan (3). The Scan parameters such as kVp,
mA, scan time, pitch factor, sections thickness have influence on the absorbed dose (16, 17). This can lead to expanding the range of radiation dose even for a specific CT scan procedure.
418
Table 1. The Characteristics of CT scan centers.
Figure 1. The CTDIw distribution among various CT scan centers.
Center Center issue
Center location
CT
Company CT Model
Number of slice
CT Country builder
Year of installation
Number of detector rows
AEC presence
CTDI presence A General South GE Medical
Systems
Bright
Speed 8 USA 2007 8 Y Y
B Private Center Neu Soft Spiral
Neuviz Dual 16 China 2009 2 N Y
C General West Siemens Emotion 16 Germany 2009 16 Y Y
D General West GE Medical
Systems Lightspeed 4 USA 2008 4 Y Y
E Private North GE Medical Systems
Bright
Speed Elite 16 USA 2008 16 Y Y
F Private East GE Medical Systems
Lightspeed
Plus 4 USA 2009 4 Y Y
G Private West Siemens Somatom
Sensation 16 Germany 2010 16 Y Y
H Private Center GE Medical Systems
Hispeed
Dual 16 USA 2008 16 Y Y
I General North Siemens Somatom
Sensation 4 Germany 2012 4 Y Y
J Private East Siemens Somatom
Sensation 4 Germany 2004 4 Y Y
K General North Siemens Somatom
Sensation 16 Germany 2009 16 Y Y
419
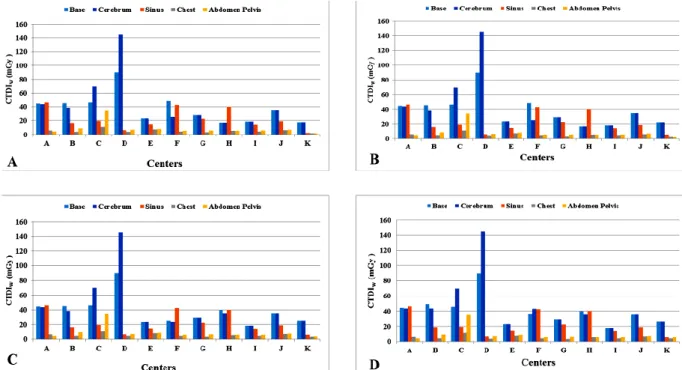
Int. J. Radiat. Res., Vol. 17 No. 3, July 2019In regard to CT centers surveyed in our study, there were variations in the CTDIw values among all groups figure 2, which is in a good accordance with previous studies (18, 19). This might be related to variations in the imaging
protocols, the operator’s knowledges and experiences, in addition to the various scanner models and also center’s conditions.
Based on the scanner’s model and design, some factors like the beam geometry, filtration,
Table 3. Comparing DRL of this study by other relevant studies.
Groups CT examination CTDIW
3rd-Quartile (DRL ) Mean Min Max
A
Brain Base 45.66 37.64 17.01 90
Cerebrum 41.10 42 17.01 145
Sinus 31.33 22.13 2.30 46.30
Chest 6.33 5.33 1.71 11.30
Abdomen pelvis 7.65 8.62 1.74 34.80
B
Brain Base 45.66 38.06 17.01 90
Cerebrum 41.10 42.41 17.01 145
Sinus 31.33 22.4 5.22 46.34
Chest 6.33 5.39 2.4 11.30
Abdomen pelvis 7.65 8.65 2.06 34.80
C
Brain Base 44.9 38.31 18.20 90
Cerebrum 41.10 44.23 18.20 145
Sinus 31.33 22.13 22.44 5.70
Chest 6.33 5.33 5.45 3.08
Abdomen pelvis 7.65 8.62 8.79 3.60
D
Brain Base 45.26 39.78 18.20 90
Cerebrum 43.80 46.61 18.20 145
Sinus 31.33 22.68 5.70 42.63
Chest 6.33 5.55 3.17 11.30
Abdomen pelvis 7.65 9 4.20 34.80
Groups CT examination This Study European UK DLP DRL DLP DRL DLP DRL
A
Head 334.80 43.38 300 40 270 30
Sinus 158.81 31.33 -- -- --
--Chest 82.05 6.33 200 20 300 12
Abdomen &pelvis 150.30 7.65 330 20 170 20
B
Head 334.80 43.38 600 60 470 45
Sinus 158.81 31.33 -- -- --
--Chest 82.05 6.33 400 30 230 13
Abdomen &pelvis 150.30 7.65 360 25 250 20
C
Head 350.13 43 750 70 620 50
Sinus 158.81 31.33 -- -- --
--Chest 82.05 6.33 600 30 370 20
Abdomen &pelvis 150.30 7.65 800 30 500 30
D
Head 380.19 44.53 750 70 930 65
Sinus 162.38 31.33 -- -- --
--Chest 82.05 6.33 600 30 580 14
Abdomen &pelvis 150.30 7.65 800 30 560 14
Table 2. The obtained DRL, mean, min and max of CTDIw in the present study.
420
the number and type of detector rows and the scattered radiation are important variables in determining the dose delivered to the patient. In our study, as shown in figure 1, the phantom study verified the dose variations among CT cen-ters. Using dose optimization approaches was mandatory in this situation. The diagnostic ref-erence levels play critical roles in radiation dose optimization. They are useful indicators by which radiology technicians can be aware of delivered radiation does to the patients and take corrective actions if necessary (19).
In regard to pediatric cases, the DRLs are more vital due to the more radiation sensitivity and the life expectancy. To the best of our
knowledge, this is the first study on DRL measurement in Tehran, which may be interesting for local regulatory bodies. It was a
good opportunity to collect the Iranian specific data regarding the CT DRLs for four–age levels.
Our results on DRLs, demonstrated that current CT dose levels were well below the European Union (20) and UK (21) proposed values. Although, their data return to many years ago and need to be updated. Albeit, they still the most suitable and available references for DRLs comparison. The main reason by which our
measured DLP/DRLs were below the international values can be attributed to the
improvements of CT technologies such as applying detectors with high efficiency, new reconstruction algorithms and automated tube current modulation (ATCM). Some Previous studies indicated that the ATCM can reduce the radiation dose up to 40%. (22, 23), which was available in all CT scanners included in our study. Concerning the more frequently used CT examinations included in our study, the low measured DRLs from these examinations are encouraging results.
Although DRLs are feasible measure for radiation dose optimization, there are newer criteria for more accurate dose estimation. Recently, the American Association of Physicists in Medicine (AAPM) has proposed “size-specific dose estimate” (SSDE) which takes into account patient the size, in order to optimize CTDIvol based on patient’s physical dimensions (25). Some studies have indicated that SSDE was more accurate and feasible criterion in CT scan dose estimation and optimization (26, 27). Therefore, further studies taking into consideration SSDE criteria and a comparison
with the results of this study is suggested.
Figure 2. The CTDIw distribution based on different organs among various CT scan centers.
421
Int. J. Radiat. Res., Vol. 17 No. 3, July 2019CONCLUSION
There are variations in dose between CT centers and identical scanners indicating the necessity for dose optimization. Our results can be applied to meet some requirements for the establishment of national computed tomography DRLs tables which in turn can help to prevent the children unnecessary radiation dose from CT scans.
Conflicts of interest: Declared none.
REFERENCES
1. Brenner DJ and Hall EJ (2007) Computed tomography—
an increasing source of radiation exposure. N Engl J
Med, 357(22): 2277-84.
2. Mettler Jr FA, Wiest PW, Locken JA, Kelsey CA (2000) CT
scanning: patterns of use and dose. J Radiol Prot, 20(4):
353.
3. Nelson TR. Practical strategies to reduce pediatric CT
radiation dose (2014) J Am Coll Radiol, 11(3): 292-9.
4. Kalra MK, Maher MM, Toth TL, Hamberg LM, Blake MA,
Shepard JA, et al. (2004) Strategies for CT radiation dose
optimization. Radiology, 230(3): 619-28.
5. Donnelly LF, Emery KH, Brody AS, Laor T, Gylys-Morin
VM, Anton CG, et al. (2001) Minimizing radiation dose
for pediatric body applications of single-detector helical
CT: strategies at a large children's hospital. Am J
Roent-genol, 176(2): 303-6.
6. Brenner DJ, Elliston CD, Hall EJ, Berdon WE (2001)
Esti-mated risks of radiation-induced fatal cancer from
pedi-atric CT. Am J Roentgenol, 176(2): 289-96.
7. ICRP, 1996. Radiological Protection and Safety in
Medi-cine. ICRP Publication 73. Ann. ICRP 26(2).
8. Roch P and Aubert B (2012) French diagnostic reference
levels in diagnostic radiology, computed tomography
and nuclear medicine: 2004–2008 review. Radiat Prot
Dosim, 154(1): 52-75.
9. Korir GK, Wambani JS, Korir IK, Tries MA, Boen PK
(2015) National diagnostic reference level initiative for
computed tomography examinations in Kenya. Radiat
Prot Dosim, 168(2): 242-52.
10. Sutton D, McVey S, Gentle D, Hince A, MacDonald N, McCallum S (2014) CT chest abdomen pelvis doses in
Scotland: has the DRL had its day? Br J Radiol, 87(1041):
20140157.
11. Vassileva J, Rehani MM, Applegate K, Ahmed NA, Al-Dhuhli H, Al-Naemi HM (2013) IAEA survey of paediatric computed tomography practice in 40 countries in Asia, Europe, Latin America and Africa: procedures and
proto-cols. Eur Radiol, 23(3): 623-31.
12. Bibbo G, Balman D, Linke R (2016) Diagnostic reference levels for common paediatric fluoroscopic examinations performed at a dedicated paediatric Australian hospital.
J Med Imaging Radiat Oncol, 60(4): 469-74.
13. Fukushima Y, Tsushima Y, Takei H, Taketomi-Takahashi A, Otake H, Endo K (2011) Diagnostic reference level of
computed tomography (CT) in Japan. Radiat Prot
Dosim-etry, 151(1): 51-7.
14. Janbabanezhad Toori A, Deevband M, Shabestani Mon-fared A, Abdi R, Nabahati M (2016) Pediatric dose as-sessment in common CT examination towards
establish-ment of related regional DRL in Mazandaran, Iran. Int J
Radiat Res, 14(3): 251-6.
15. European Commission (1999) European guidelines on quality criteria for computed tomography. Brussels: EC.
16. Tsapaki V and Rehani M (2007) Dose management in CT
facility. Biomed Imaging Interv, 3(2).
17. Tavakoli MB, Heydari K, Jafari S (2014) Evaluation of
diagnostic reference levels for CT scan in Isfahan. Glob J
Med Res Stud, 1(4): 130-4.
18. Treier R, Aroua A, Verdun F, Samara E, Stuessi A, Trueb PR (2010) Patient doses in CT examinations in Switzer-land: implementation of national diagnostic reference
levels. Radiat Prot Dosim, 142(2-4): 244-54.
19. Foley SJ, McEntee MF, Rainford LA (2012) Establishment
of CT diagnostic reference levels in Ireland. Br J Radiol,
85(1018): 1390-7.
20. Community E (1997) On health protection of individuals against the dangers of ionizing radiation in relation to medical exposure. Council directive 97/43 (Euratom).
Official Journal of the European Communities, 180(09): 07.
21. Shrimpton P, Hillier M, Lewis M, Dunn M (2006)
Nation-al survey of doses from CT in the UK: 2003. Br J Radiol,
79(948): 968-80.
22. Kalender WA, Wolf H, Suess C (1999) Dose reduction in CT by anatomically adapted tube current modulation. II.
Phantom measurements. Med Phys, 26(11): 2248-53.
23. Gies M, Kalender WA, Wolf H, Suess C, Madsen MT (1999) Dose reduction in CT by anatomically adapted
tube current modulation. I. Simulation studies. Med
Phys, 26(11): 2235-47.
24. ICRP (1996) Radiological protection and safety in medi-cine. A report of the International Commission on
Radi-ological Protection. . Ann ICRP, p. 1–47.
25. Boone J SK, Cody D, McCollough C, McNitt-Gray M, Toth T, Goske M, Frus D (2011) Size-specific dose estimates (SSDE) in pediatric and adult body CT examinations.
Report of AAPM Task Group 204.
26. Abdollahi H, Shiri I, Salimi Y, Sarebani M, Mehdinia R,
Deevband MR, et al. 2016Radiation dose in cardiac
SPECT/CT: An estimation of SSDE and effective dose. Eur
J Radiol, 85(12): 2257-61.
27. Imai R, Miyazaki O, Horiuchi T, Kurosawa H, Nosaka S (2015) Local diagnostic reference level based on size-specific dose estimates: assessment of pediatric ab-dominal/pelvic computed tomography at a Japanese
national children’s hospital. Pediatr Radiol, 45(3):
345-53.