I wish to express my appreciation to Dr. Parker C.
Reist for providing me the opportunity to carry out this
study. His guidance and support have been a valuable asset
throughout the course of this research and my graduatestudies.
Thanks to the faculty and staff of the University of
North Carolina Environmental Science and Engineering
Department and to ray committee members Dr. Parker Reist, Dr.
David Leith and Dr. James Watson for their guidance andsuggestions.
I would like to thank my family for their constant support.
A special thanks to my husband Greg, who was a constant
source of inspiration and whose support provided me with the
determination to see this project through to completion.My graduate education was sponsored in part by the
TABLE OF CONTENTS
Page
ABSTRACT ... 1
INTRODUCTION ... 3
BACKGROUND ... 5
PREVIOUS WORK ... 8
PROJECT OVERVIEW ... 11
METHODOLOGY - SEDIMENTATION METHOD ... 14
Sedimentation Apparatus ... 14
Rationale of the Sedimentation Approach ... 15
Assumptions of Stokes' Law ... 17
A. Viscous Medium ... 19
B. Continuous Medium ... 20
C. Infinite Medium ... 21
D. Streamline Motion ... 22
E. Spherical Particles ... 23
Adapting the Method to the Study ... 24
A. Selection of the Sedimentation Fluid .... 24
B. Dispersion Procedures ... 25
C. Increasing the Sensitivity of the Method . 28
Experimental Procedure for Sedimentation Method . 32
Development of Cumulative Size Distributions .... 34
Defining the Respirable Outpoint ... 35
Evaluation of the Role of Bias ... 36
METHODOLOGY - RESPIRABLE FRACTION MEASUREMENTS ... 40
Elutriation Using a Cyclone ... 40
Experimental Cyclone Design ... 42
Experimental Procedure for Cyclone Sampling ... 43
RESULTS ... 47
Sedimentation Data ... 47
Cyclone Data ... 72
Comparison of Sedimentation, Cyclone and
Manufacturers' Respirable Fraction Data ... 80
DISCUSSION ... 83
Sedimentation Results ... 83
Comparison of Sedimentation and Manufacturer's
Data ... 85
Comparison of Sedimentation and Cyclone Method .. 85
CONCLUSIONS ... 89
RECOMMENDATIONS FOR FURTHER RESEARCH ... 91
REFERENCES ... 92
APPENDIX A
Equipment List for Sedimentation Method ... 96
Sedimentation Procedure ... 97
Equipment List for Cyclone Method ... 99
Cyclone Procedure ... 100
APPENDIX B
OSHA PELS for Crystalline Silica (Quartz) ... 103
ACGIH TLVs for Silica ... 104
APPENDIX C
Photograph A. Andreasen Sedimentation Pipette .... 106
Photograph B. Andreasen Sedimentation Pipette with
Suspension ... 106
Photograph C. 10-mm Nylon Cyclone and Assembly ... 107
Photograph D. Aspirator Device ... 107
Photograph E. Experimental Chamber and Cyclone
Set-up ... 108
TABLE I. Errors Associated with the Application of
Stokes' Law for Spherical Particles Settling
through Water at 20°C ... 20
TABLE II. Comparison of Sampling Times at 5 and 20
cm Sampling Height... 30
TABLE III. Typical Sampling Run for Sedimentation
Analysis ... 33
TABLE IV. Sedimentation Data Collected Under Conditions
of Poor Dispersion ... 38
TABLE V. Cyclone Analyses Summary ... 73
TABLE VI. Cyclone/Sedimentation/Manufacturers' Data
Figure 1. Figure 2. Figure 3. Figure 4. Figure 5. Figure 6. Figure 7. Figure 8. Figure 9. Figure 10. Figure 11. Figure 12. Figure 13. Figure 14. Figure 15.
LIST OF FIGURES
Page
Andreasen Sedimentation Pipette ... 15
Schematic of Sedimentation Test ... 18
Comparison of Sampling Heights ... 31
Cyclone Experimental Design ... 44
Particle Size Distribution by Sedimentation
Method for Arizona Road Dust (Run #1) ... 50
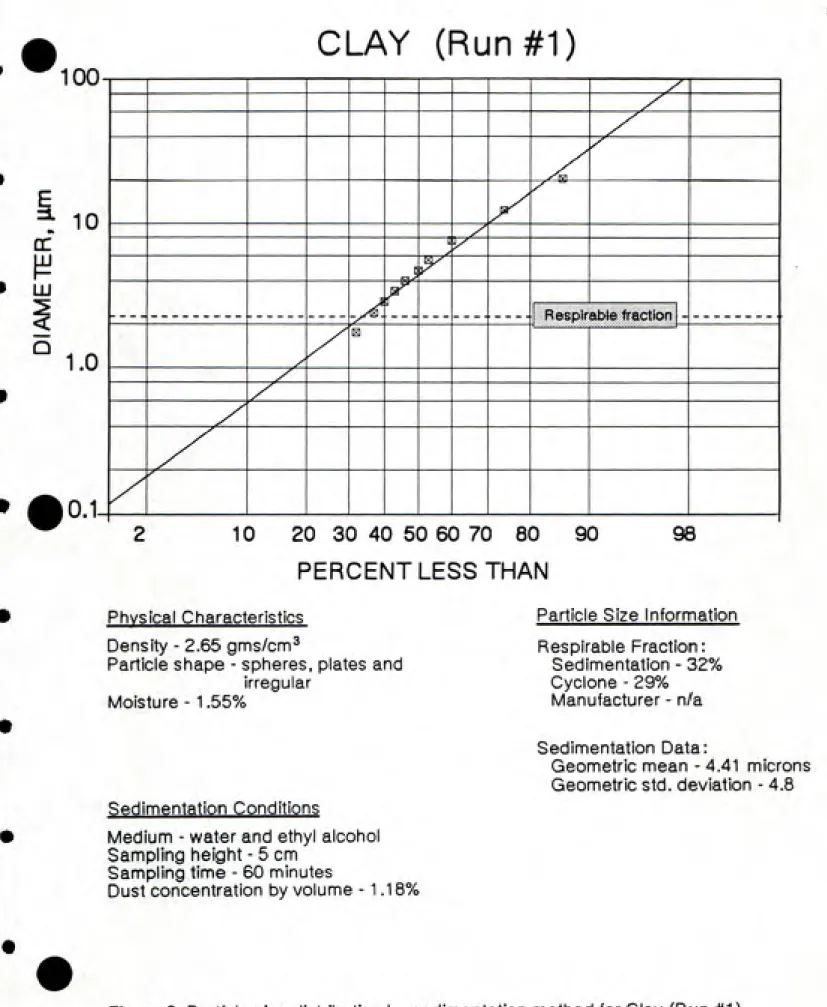
Particle Size Distribution by Sedimentation
Method for Clay (Run #1) ... 51
Particle Size Distribution by Sedimentation
Method for Diatomaceous Compound #1
(Run #1) ... 52
Particle Size Distribution by Sedimentation
Method for Diatomaceous Compound #1
(Run #2) ... 53
Particle Size Distribution by Sedimentation
Method for Diatomaceous Compound #2
(Run #1) ... 54
Particle Size Distribution by Sedimentation
Method for Diatomaceous Compound #2
(Run #2) ... 55
Particle Size Distribution by Sedimentation
Method for Diatomaceous Compound #3
(Run #1) ... 56
Particle Size Distribution by Sedimentation
Method for Diatomaceous Compound #3
(Run #2) ... 57
Particle Size Distribution by Sedimentation
Method for Diatomaceous Compound #3
(Run #3) ... 58
Particle Size Distribution by Sedimentation
Method for Diatomaceous Compound #4
(Run #1) ... 59
Figure 16. Figure 17. Figure 18. Figure 19. Figure 20. Figure 21. Figure 22. Figure 23. Figure 24. Figure 25. Figure 26. Figure 27. Figure 28.
Particle Size Distribution by Sedimentation
Method for Flint (Run #2) ... 61
Particle Size Distribution by Sedimentation
Method for Micronized Amorphous Silica
(Run #1) ... 62
Particle Size Distribution by Sedimentation
Method for Micronized Amorphous Silica
(Run #2) ... 63
Particle Size Distribution by Sedimentation
Method for Talc (Run #1) ... 64
Particle Size Distribution by Sedimentation
Method for Pesticide Compound #1
(Run #1) ... 65
Particle Size Distribution by Sedimentation
Method for Pesticide Compound #2
(Run #1) ... 66
Particle Size Distribution by Sedimentation
Method for Pesticide Compound #3
(Run #1) ... 67
Particle Size Distribution by Sedimentation
Method for Pesticide Compound #4
(Run #1) ... 68
Particle Size Distribution by Sedimentation
Method for Pesticide Compound #5
(Run #1) ... 69
Particle Size Distribution by Sedimentation
Method for Pesticide Compound #6
(Run #1) ... 70
Respirable Fraction as a Function of Chamber
Loading for Clay ... 75
Respirable Fraction as a Function of Chamber
Loading for Diatomaceous Compound #2 ... 76
Respirable Fraction as a Function of Chamber
Debbi Karen Creed. Development of a Method for Determining
the Respirable Mass Fraction of a Bulk Material. (Under the
direction of Dr. Parker C. Reist, Ph.D.)
The recent designation of crystalline respirable silica
as a carcinogen has created a need for simple laboratory
methods to determine the mass fraction of respirable
particles in bulk silica-containing materials. Results could
influence whether labeling would or would not be required. A
liquid sedimentation technique was used to obtain cumulative
size distributions for a variety of silica-containing dusts.
These results were plotted as cumulative size distributions
for the test dusts. The percentage of particles having an
equivalent aerodynamic diameter less than 3.5 micrometers
was taken to represent the respirable mass fraction of the
original bulk material. Validation studies of the
sedimentation method were carried out by comparing the
results to actual respirable mass fraction measurements. A
uniform dust cloud of the test material was generated within
an acrylic chamber. Respirable samples and total dust
samples (i.e. dust collected on a PVC filter without a
precollector) were collected. The ratio of the respirable
dust to total dust was used to represent the respirable mass
fraction of the airborne material. Side-by-side comparisons
of the sedimentation and cyclone respirable fraction
measurements were in close agreement with a maximum
method provides a rapid, inexpensive, and easy method for
obtaining accurate and reproducible estimates of the
Inhalation and pulmonary deposition of crystalline
silica has long been implicated as the cause of silicosis, a
fribrotic disease of the lungs. Recent experimental and
human data conclude that there is now sufficient evidence
for the carcinogenicity of crystalline silica in rats, and
limited evidence for the carcinogenicity of crystalline
silica to humans when the silica is inhaled as a respirable
dust. These findings were published by the International
Agency for Research On Cancer (lARC) in the Volume 42
Monograph on the Evaluation of the Carcinogenic Risk of
Chemicals to Humans by Silica and Some Silicates. The lARC
findings were incorporated by Occupational and Safety Health
Association (OSHA) and added to the National Toxicology
Program's (NTP) Sixth Annual Report on Carcinogens.
The designation of crystalline respirable silica as a
carcinogen results in federal labeling requirements for
products which may generate airborne silica during handling.
Materials containing silica are abundant and are frequently
used in industrial, occupational and nonoccupational
settings. The main source of crystalline, or free silica,
is quartz, although it is also found in cristobalite,
tridymite, diatomite, and a few other silicate and
nonsilicate materials. Silica flour, or silica in its
powdered form, is a major component of paints, wood fillers,
an abrasive. Industries relying on these processes include
glass manufacturing facilities, granite cutting operations,
foundries, and operations which involve mining and tunneling
in quartz rock (2). Products commonly found in the home
which may contain silica include talc, cosmetics, and
pesticides. Of late, much attention has been focused on
nonoccupational exposures by artists and craftsmen to
silica-containing paints, clays, ceramics, and stones.
The federal labeling legislation creates a need for
simple laboratory methods to determine the mass fraction of
respirable particles in the bulk silica-containing material.
These measurements could then be used to determine whether a
material does or does not represent an occupational hazard
to exposed employees, and consequently, whether labeling
would or would not be required. The goal of this research
was to develop such a procedure for routine laboratory
usage. The method selected for evaluation was liquid
sedimentation using the Andreasen sedimentation pipette.
Validation studies of the sedimentation technique were
carried out by comparing the sedimentation results to
respirable fraction measurements taken using 10-mm nylon
Historically, the microscope has been relied upon for
measuring particle size, with particle size being defined in
terms of the particle diameter for spherical particles and
as Martin's diameter, Feret's diameter, or the projected
area diameter for nonspherical ones. Over time, the
microscope has given way to more sophisticated automated
techniques that are not only quicker and more accurate, but
are also capable of particle analysis at or below the range
of resolution of the optical microscope.
During the past 20 years, increased usage of aerosols
in industry and medicine and heightened concern over
aerosols in air pollution, industrial hygiene, and in
manufacturing clean rooms has intensified the search for
methods that focus on how a particle behaves when airborne
in a field of force rather than how a particle appears under
the microscope. Thus, the new definition of particle size
known as the aerodynamic equivalent diameter (AED) was
established. The AED is formally defined as: The diameter of
a hypothetical sphere of unit density having the same
terminal settling velocity as the particle in question
regardless of its geometric size, shape, and true density
(1). The AED is of particular importance for evaluating
toxicologic effects because certain particle sizes deposit
diameters (Da) of less than 4 microns are those most likely
to be deposited in the tissues of the lungs. Therefore, to
accurately determine the fraction of particles that have the
greatest potential for lung deposition, i.e. the respirable
mass fraction, a method is required that measures the mass
of particles having an aerodynamic diameter of four microns
or less.
For the purposes of this study, a variety of sampling
methods for determining particle size distributions of fine
powders were considered. However, most of these techniques
were ruled out because they require expensive apparatus,
high levels of skill, considerable expenditures of time, or
because the principles upon which their operation are based
are not fully understood. The method ultimately selected
for adaptation to estimate the respirable fraction from the
bulk dust was that of liquid sedimentation using the
Andreasen sedimentation pipette.
A.H.M. Andreasen is recognized as the individual who
pioneered the sedimentation pipette technique in the 1930's
for the purpose of resolving particle size distributions of
fine materials. To carry out these analyses, Andreasen
designed the well known "Andreasen Sedimentation Pipette".
The Andreasen sedimentation pipette continues to experience
widespread use today due to its simplicity in operation and
The criteria for choosing this method are extensive and
therefore merit discussion. They are listed as follows:
1) The method is applicable to particles in the subsieve
size range-i.e. those with a diameter not greater than
50 microns.
2) The method yields particle size results cast in terms
which are easily converted to aerodynamic diameter.
3) The method requires a minimum degree of skill, time, and
expense without sacrificing acceptable degrees of
accuracy.
4) The method is adaptable to a wide range of powders.
5) The method gives reproducible results.
6) The method provides sufficient results to plot a
cumulative size distribution.
7) The method provides a distinguishable outpoint between
respirable and nonrespirable particles.
8) The sampling procedure does not chemically or physically
modify the dust particles so further analyses can be
PREVIOUS WORK
Many studies have been carried out for the purpose of
evaluating the performance of the Andreasen sedimentation
pipette. Irani and Callis' report provides an excellent
discussion of the more prominent of these investigations,
and also confirms the accuracy of the method by comparison
with other accepted methods of sampling (9). Irani carried
out an intercomparison between the Andreasen pipette method,
microscopy, and two sedimentation balances on two samples of
hard wheat flour, one fine-grained and the other coarse
(28). The microscopic analysis was achieved by electronic
counting and sizing. The sedimentation balances were the
automatized Gallenkamp balance and the commercial Recording
Sedibal. Irani's results showed that the pipette,
microscopic, and sedimentation balance data were in close
agreement for the coarse flour sample but that the pipette
data predicted a finer size distribution than the microscope
and sedimentation balances for the fine flour sample. Irani
presumed that this deviation was a result of the disturbance
generated within the suspension as the samples were
withdrawn.
Rabatin and Gale also compared the sedimentation
balance and Andreasen pipette with results showing only a
slight deviation between the two methods (29).
Wichser and Shellenberger intercompared the Andreasen
the 50 microns, and poor agreement above this size.
Significant errors occurred with the pipette analysis when
the specific gravity of the medium approached that of the
sample. The results of their study demonstrate that the
Andreasen pipette is applicable to particles below 50
microns, the sieving method to those above 37 microns, and
air flotation to those below 80 microns.
Batel conducted an analysis of the Andreasen
sedimentation method and concluded that the pipette is
capable of size analysis in the range of 1 to 60 microns but
only under conditions of complete particulate dispersion
within the medium (30).
Schweyer performed an extensive evaluation and
intercomparison of the Andreasen pipette, the hydrometer,
the Wagner turbidimeter, and the Roller Air Analyzer methods
for particle size analysis (5). Schweyer's results cited
the pipette method as the method of choice for determining
the particle size distribution of subsieve material by
sedimentation techniques. Schweyer also found that the
performance of the pipette was dependent on adequate
dispersion.
Rendall and Sittert performed a comparison of the
Electronics), a device which counts and sizes dust particles
suspended in an electrolyte solution (19). Their data showed
that the two methods predicted similar size distributions
for a sample of classified quartz dust, with the Coulter
Counter predicting slightly higher proportions of the finer
particles. They attributed this trend to the Coulter
Counters's definition of particle diameter as being smaller
than the Stokes' diameter as defined by the sedimentation
analysis.
Although Andreasen's method is well documented in the
literature for making quantitative particle size
determinations for fine powders, the literature does not
indicate that the method has been used for respirable
PROJECT OVERVIEW
The purpose of this research was to develop a method
for determining the mass fraction of respirable particles in
a bulk silica-containing material. The method chosen for
evaluation was sedimentation in a liquid medium. To
validate the sedimentation results, cyclone respirable
measurements were performed on the same dusts, and
side-by-side comparisons of the results were made. When available,
particle size distribution data provided by the manufacturer
was also used as a means of assessing the accuracy of the
sedimentation results. On occasion, the manufacturer
provided size distribution data but failed to disclose the
sampling method. In these cases, comparison between the
sedimentation results and the manufacturers' particle size
data was carried out although with some dilution of the
strength of the comparison.
Thirteen test dusts were analyzed using both the
sedimentation and cyclone method. Dusts characterized by
various densities, porosity, particle shapes and sizes were
selected for analysis so that the range of application for
the sedimentation method could be assessed. These dusts
included flint, clay, 4 diatomaceous samples, 6 pesticides,
and a micronized amorphous silica sample. An additional
Arizona road dust sample and talc sample were analyzed using
only the sedimentation method and not the cyclone. For the
referred to as diatomaceous compound #1, diatomaceous
compound #2, and so forth, as will the pesticides be
referred to in the same manner, for example, pesticide
compound #1, pesticide compound #2, etc.
The sedimentation method yielded results which
predicted the fraction or percentage of particles falling
within a specified size range. This percentage of particles
was plotted against particle size to predict a particle size
distribution for each dust. The sedimentation method
measured particle size in terms of Stokes' equivalent
diameter. Therefore, determination of the fraction of
particles that were in fact respirable required two
additional steps 1) conversion of the results from Stokes
equivalent diameter to aerodynamic diameter by application
of the equation:
D.-D-/p7 (1)
where D^ is the particle aerodynamic diameter (Um)
D is the particle diameter (|im )
Py is the particle density (ffm/em^
and 2) defining a outpoint based on aerodynamic diameter
which distinguished the respirable fraction of the dust
particles from the nonrespirable fraction.
The cyclone method yielded results which defined the
dust in terms of two distinct components, the respirable and
fraction of the bulk material when airborne. The cyclone
method directly measured the dust particle sizes in terms of
aerodynamic diameter.Following the analyses of the various dusts, the
ability of the sedimentation method to accurately predict
the respirable fraction of the bulk test dust was assessed
depending on the degree of correlation with the cyclone
results and the manufacturers' specifications when
available.
Information provided for each test dust includes
sedimentation particle size distributions, cyclone
respirable fraction measurement data, and physical
characterizations such as density, particle shape, and
moisture content. Sampling procedures and equipment for both
METHODOLOGY - SEDIMENTATION METHOD
Sedimentation Apparatus
Cumulative size distributions of the bulk test material
were determined by sedimentation techniques. An Andreason
Sedimentation Pipette, Fisher Catalog No. 14-232,
manufactured by Q Glass Company was the apparatus employed
for particle sizing. The Andreasen sedimentation pipette is
generally used for determining sub-sieve grain sizes in the
0.5 to 40 or 50 micron range using water as thesedimentation medium. It is frequently relied upon for
particle size distribution measurements due to thesimplicity in operating the pipette and the relatively low
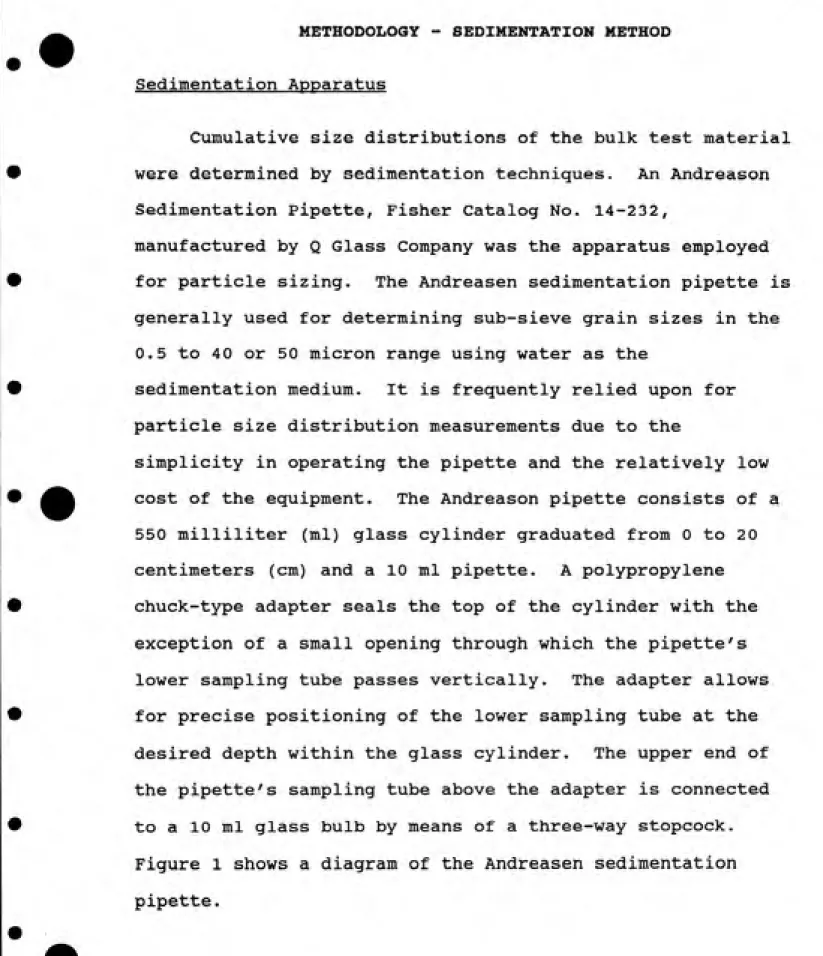
cost of the equipment. The Andreason pipette consists of a
550 milliliter (ml) glass cylinder graduated from 0 to 20
centimeters (cm) and a 10 ml pipette. A polypropylene
chuck-type adapter seals the top of the cylinder with the
exception of a small opening through which the pipette's
lower sampling tube passes vertically. The adapter allows
for precise positioning of the lower sampling tube at the
desired depth within the glass cylinder. The upper end of
the pipette's sampling tube above the adapter is connected
to a 10 ml glass bulb by means of a three-way stopcock.Figure 1 shows a diagram of the Andreasen sedimentation
cz:
10 ccm
20 cm
10
Figure 1. Andreasen Sedimentation Pipette
(From Andreasen, Reference 32)
Rationale of the Sedimentation Approach
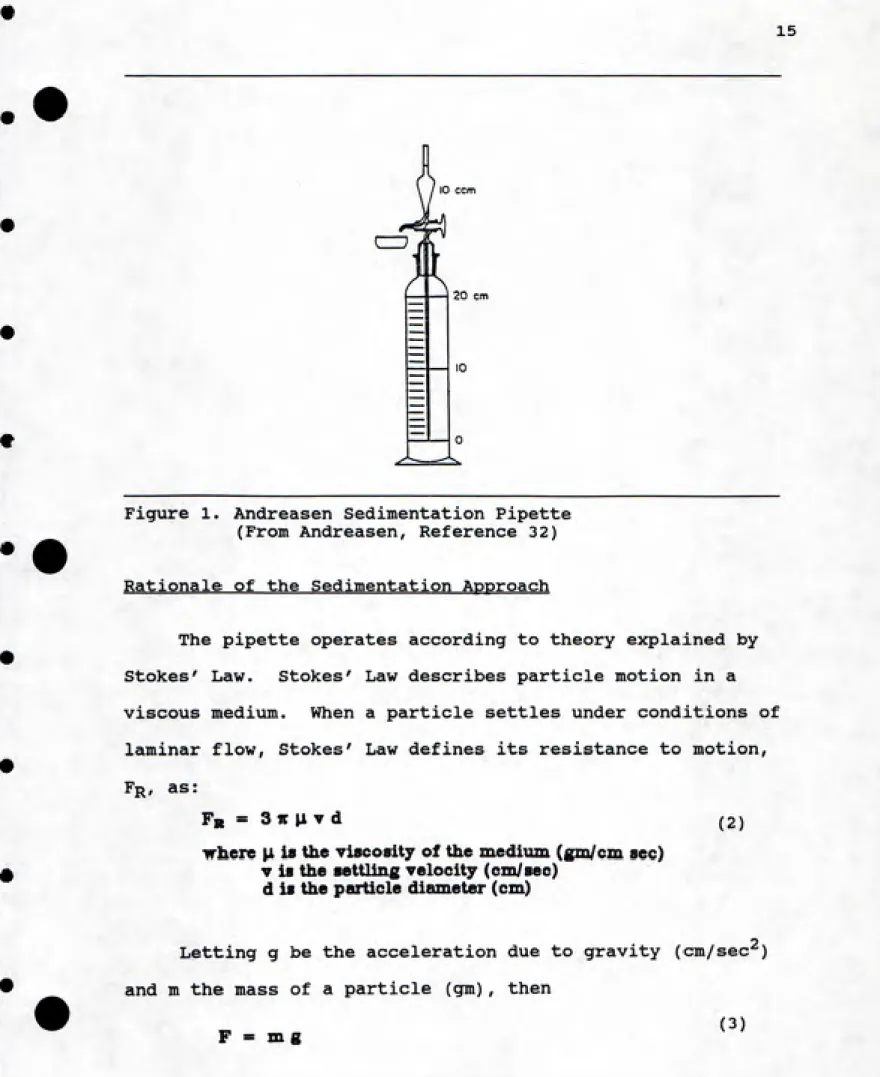
The pipette operates according to theory explained by Stokes' Law. Stokes' Law describes particle motion in a viscous medium. When a particle settles under conditions of
laminar flow. Stokes' Law defines its resistance to motion,
Fr, as:
Fr = 3ir Jl V d (2)
-vfhere \x is the viscosity of the medium (gm/cm sec) V is the settling velocity (em/see)
d is the particle diameter (cm)
Letting g be the acceleration due to gravity (cm/sec'^)
and m the mass of a particle (gm), thenFor spherical particles of mass m,
m = y (PB-Pm) (4)
where Pp is particle density (gm/cm^
Pb is Huid density (gmycm^
Equating the gravitational force with the resisting
force and solving for the settling velocity (v), the
equation becomes
ͫ
= <i*(P>-Pa)g (5)
ld\l
Equation (5) represents the settling velocity of a
particle of diameter (d) and density (Pp) which is settling
in a medium of density (p^).
The relationship between particle diameter and the
distance a particle falls by gravity is determined by the
equation:
d « r ria u H ^ 1 "*
(6)
(Pp-Pm)8t
where t is the time the particle falls (sec)
H is the distance the particle has fallen in time t (em)
i.e. the distance between the fluid surface and the pipette tip
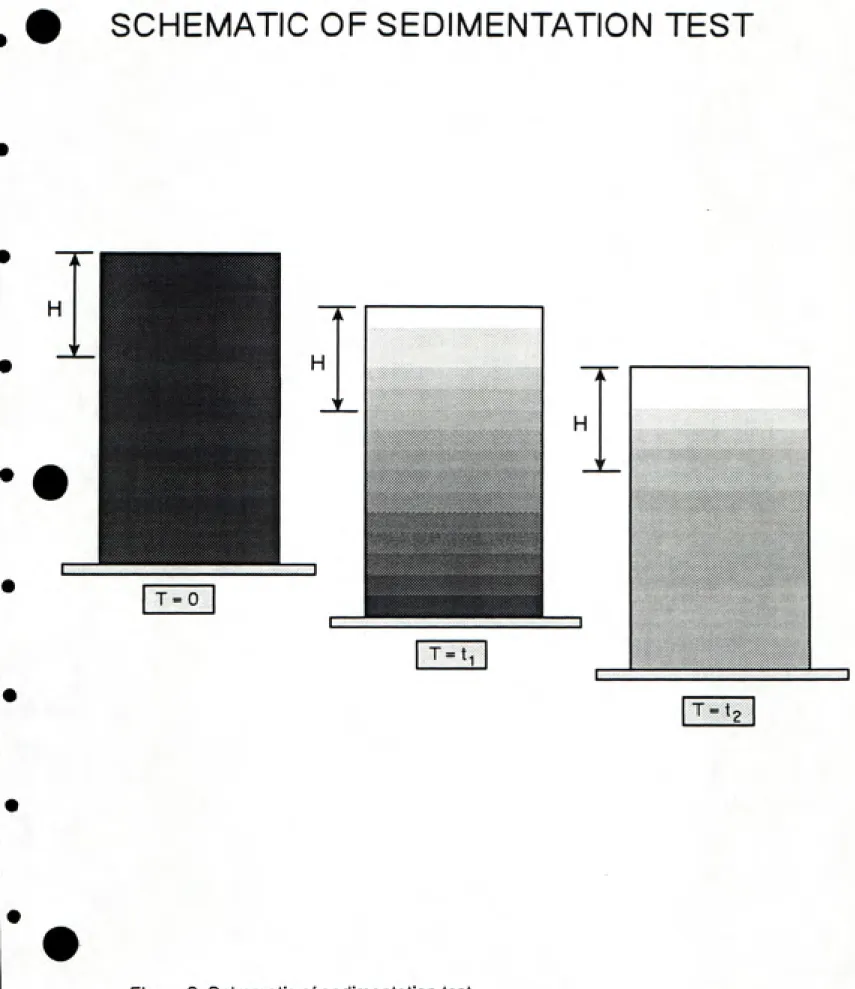
If the pipette flask initially contains a liquid
medium with a uniform distribution of particles, then all
particles having a diameter equal or greater than d will
settle out of the suspension at height H after time t. For
example, for d, H, and T values of 50 microns, 20
centimeters, and 80 seconds respectively, all particles
the suspension at a height of 20 centimeters after 80 seconds. Samples drawn out at height H in successive
intervals of time will show smaller and smaller numbers of
larger particles as the larger particles settle out at a
faster rate than the smaller particles. Figure 2illustrates the sedimentation procedure at subsequent time
intervals.
This relationship can be used to determine the
cumulative size distribution by mass of certain materials.
Samples can be collected at various times t at height H
using the sedimentation pipette. Each sample is evaporated
to dryness and the particle mass of each sample isdetermined. The weight of each sample is expressed as a
percentage of the first sample drawn to give the percentage
of the test dust having particle sizes smaller than thelargest particle contained within that sample. A cumulative
size distribution by mass is then obtained by plotting the
cumulative percentage of particles by mass having diameters
less than a given particle size against the Stokes'
equivalent diameter provided by equation (6).
Assumptions of Stokes' Law
To properly use Equation (6) in predicting particle
size distributions by the sedimentation method, it is
essential to consider the applications and limitations of
SCHEMATIC OF SEDIMENTATION TEST
«ͣs^^ «>> -^ S -W^. ^ N ' ^Ns s s s %s ^ ^ ^^j.
T-t<
continuous, and infinite medium with streamline motion of
spherical particles. A discussion of each assumption
follows. Davies' classic article on the subject is highly
recommended (21). More complete derivations of Stokes' Law can be found in the literature (14,16,17).
A. Viscous Medium
The application of Stokes' Law assumes that the
resistance to the particles' motion is due to the viscosity of the fluid and that the inertia of the fluid is negligible
(3). This assumption holds true when the particles are
sufficiently small. In cases of increasing particle size however, inertial forces take on greater significance as a
wake starts to develop behind the particle.
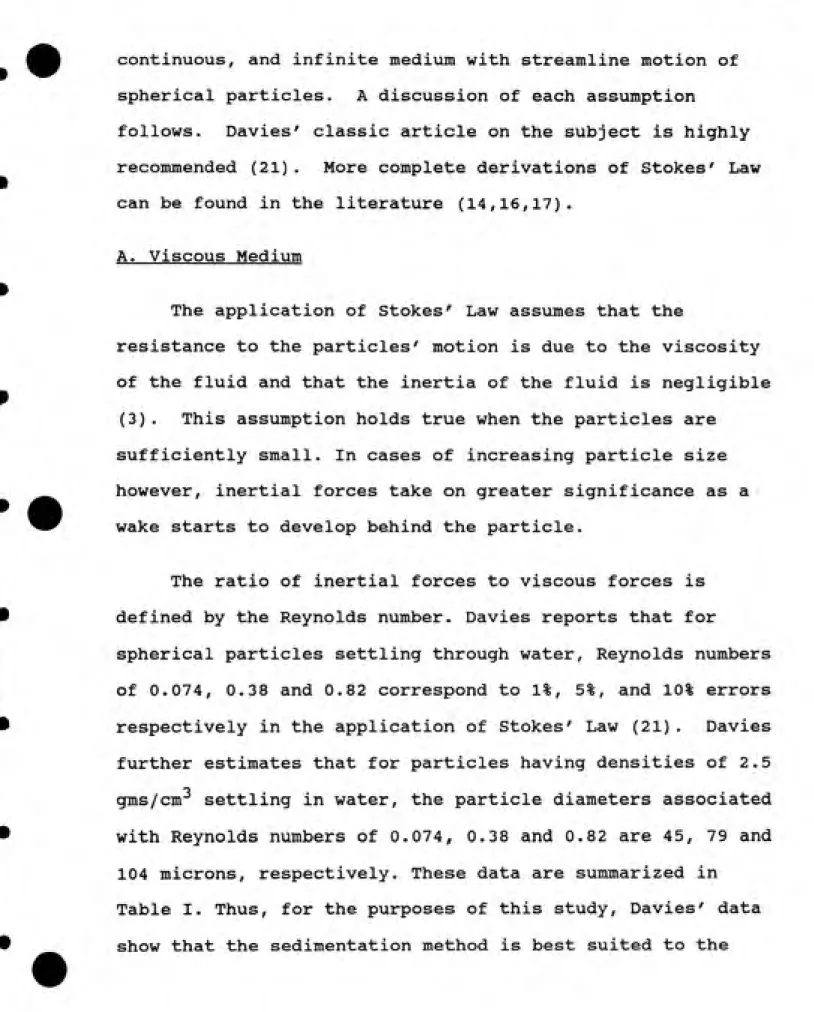
The ratio of inertial forces to viscous forces is defined by the Reynolds number. Davies reports that for
spherical particles settling through water, Reynolds numbers
of 0.074, 0.38 and 0.82 correspond to 1%, 5%, and 10% errors
respectively in the application of Stokes' Law (21). Davies
further estimates that for particles having densities of 2.5gms/cm-^ settling in water, the particle diameters associated
with Reynolds numbers of 0.074, 0.38 and 0.82 are 45, 79 and 104 microns, respectively. These data are summarized in
Table I. Thus, for the purposes of this study, Davies' data
sampling of particles having diameters less than 50 microns
when using water for the sampling medium.
TABLE I.
Error Associated with the Application of Stokes' Lav
for Spherical Particles Settling through Water at 20°C *
Particle Size
Reynolds Number (microns) Error
0.074 45 1% 0.380 79 5% 0.820 104 10%
* Assumes particle density of 2.5 gm/cm^*.
B. Continuous Medium
Stokes' Law assumes that the fluid is a continuous
medium. When the diameter of the falling particles
approaches that of the fluid molecules, a condition of slippage occurs, i.e. the particles begin to slip between
the molecules of the fluid. This phenomenon is observed
when particles have diameters less than one micron. The Cunningham correction factor (C^) has been adopted to
correct for this effect. In the sedimentation method
proposed by this study, slippage is insignificant and the
C. Infinite Medium
With viscous flow the interference caused by a particle
continues large distances into the medium. If other
particles are settling nearby, then the resistance of the
medium to these particles is lowered because of the movement
induced within the medium by the particle in motion. For this reason, a particle will settle at a higher velocity when it travels with a group of particles rather than when
it settles individually. Also, when two particles of equal
sizes settle along the same axis, the trailing particle will settle at a higher velocity than the leading particle and
the two will eventually collide. If the particles have
unequal diameters, both particles will settle with an increase in velocity due to the aerodynamic interaction
between the them. When the trailing particle is larger than the leading one, its increase in velocity is less than that for the leading particle (14).
Much effort had been dedicated to the study of the influence of the concentration of a suspension upon the
sedimentation velocity for spherical particles in the viscous flow region. The issue of determining a suitable
concentration is somewhat obscured by the fact that the net
effect is actually the result of two opposing forces. A
particle settling within the sedimentation flask will
contained in, a confined vessel, an upward flow also occurs
to compensate for the downward particle motion. The
resultant effect is of a smaller order of magnitude than either phenomenon, because the two opposing forces tend to
balance out. In general, the downward velocity of the
particles in an enclosed vessel is less than they would be
in an infinite medium (21).
When using the sedimentation method in a liquid medium, the validity of Stokes' Law is assured only when the
particulate concentration does not exceed 1-2% by volume. Particle interactions previously described will occur with concentrations in excess of this range with a resultant
biasing of the sampling data. The literature shows
conflicting opinions concerning the exact concentration
where Stokes' Law ceases to apply.
D. Streamline Motion
Stokes' equation applies only when the motion of the particle in the fluid is streamline. A correction should be
made at higher velocities. Rose demonstrated the validity of
Stokes' Law to within 1% when the Reynolds number is no
greater than 0.1 (8). His calculations show that for a
solution of water at 25°C and silica particles having
densities of 2.5 gm/cm^, the upper limiting diameter for
streamline motion is 50 microns. The 50 micron designation
where errors in the application of Stokes' Law begin to arise. The magnitude of the error increases with particle size, for example, a 15% error is predicted for
sedimentation analyses of 120 micron
particles-The lower limiting diameter for streamline motion is 1
to 2 microns. Below this limiting diameter particles begin
to feel the effect of the random molecular movement of the
suspending fluid and consequently experience Brownian motion, thus Stokes' Law becomes inoperative. Particles having diameters less than 1 micron are also particularly vulnerable to the effects of even slight convection
currents.
E. Spherical Particles
The final assumption in the application of Stokes' Law is that the particles are perfect spheres. However, the
sedimentation method can usefully be applied to particles of
most any shape as long as it is recognized that the
diameters predicted are equivalent diameters.
Studies have demonstrated that the relation holds quite
well for particles which vary appreciably from sphericity.
Andreasen showed that in the viscous flow region,
irregularly shaped particles with compact shapes tend to
settle at the same velocity as spheres of equal density and
Adapting the Method to the Study
Certain features of the Andreasen sedimentation pipette technique can be modified depending on the user's sampling objectives and the material under investigation. The most significant of these features are 1) the choice of the sampling fluid, 2) the procedures employed to ensure complete dispersion of the solids within the sampling suspension, and 3) the sampling height necessary for
collecting the particles of interest. Each of these issues is highlighted in the following discussion on adapting the
Andreasen pipette method to the call for respirable fraction
measurements.
A. Selection of the Sedimentation Fluid
The success of any particle size measurement technique
is dictated by its ability to achieve the proper dispersion of the particles into their working units. For the Andreasen sedimentation pipette, this meant choosing the proper
sedimentation fluid and faithfully incorporating sound
dispersion practices.
A solution of distilled and deionized water was
selected as the sedimentation fluid for the experimental
analyses. Distillation assured that the liquid was free from
the deionization process eliminated electrostatic charges
within the medium which could influence particle behavior.
The silica dusts were not soluble in the water, nor did they chemically react with it. The relationship of the viscosity
and density of the water (0.01 dyn.second/cm^ and 1.0
gm/cm^) with the density of the test dust (2.0-2.7 gm/cm-^)
was such that the particles attained an acceptable settling
velocity during sedimentation. This relationship also
allowed for a majority of the settling to occur within the Stokes' region, i.e. within the viscous flow regime and
outside the region dominated by Brownian motion (9). Other benefits of the water medium were low cost, nonflammability, nontoxicity, and ready availability.
B. Dispersion Procedures
Dispersion of the suspension was the single most
important parameter in ensuring the integrity of the
sedimentation results (9,12). Dispersion was contingent
upon the choice of proper sampling fluid as previously
discussed, the addition, when necessary, of the proper
dispersant in the correct quantities, the proper particle
concentration within the suspension, and the temperature of the suspension.
The degree of dispersion was determined by microscopic
examination of a slide prepared from a drop of the dilute
evenly spaced particles that moved freely within the solution without adhering to or clustering with other particles. Poorly dispersed suspensions showed particle agglomeration where individual particles failed to move
independently of particles.
The distilled and deionized water did not always
completely disperse the test dust. In these situations, a small amount of dispersing agent was added to the
suspension. This procedure had the effect of lowering the
surface tension of the liquid, and therefore improving the
wettability of the surface of the particles. The choice of the dispersing agent was simply a matter of trial and error, and usually several dispersing agents were tested before
observing the desired level of dispersion. Dispersion agents used for this experiment included soap, ethyl, and isopropyl
alcohol. Only a fraction of a per cent of a dispersing agent was added so corrections for viscosity and density of the water were not warranted.
Another important factor in assuring good dispersion was the concentration of the dust within the fluid. The
literature recommends a concentration ranging from 0.25% to
2.0% by volume, however there is little agreement as to
which of these concentrations is best. Andreasen recommends
2% by volume, Irani and Callis agree on 0.2-0.5% by volume, and the pipette manufacturer recommends 1-2% by volume
concentration is rooted in the need to meet the dual
requirements of having a concentration low enough to allow
unhindered settling of the particles but one high enough to
guarantee detectable quantities, particularly for the finer
particle sizes. For the purposes of this study,
concentrations of 0.25% to 1.25% by volume were used with no
signs of agglomeration or interference of particle settling.
The author does not recommend concentrations at the lower
end of this range for reasons previously discussed.
As dispersion behaviors will vary from one dust to
another, it is good practice to perform the sedimentation
analysis at several concentrations and with more than one
dispersing agent. If all analyses reflect similar results,
it is likely that dispersion is complete; likewise if
conflicting results are obtained then the analysis with the highest percentage of fines should indicate the technique
with the most complete dispersion.
Some dusts, talc for example, showed partial dispersion within the water medium. For these dusts, one particle
component readily dispersed within the medivim and the other component remained on the fluid surface in spite of extreme agitation of the mixture. In these cases, dispersion was
achieved by first preparing a slurry of the water and dust,
and then adding the slurry to the water within the pipette.
A small amount of dust was added to a few drops of water,
This process was repeated until all of the sample was
incorporated into the paste. At this point, enough water was added to the slurry to allow for transfer to the
sedimentation flask.
A final precaution taken to ensure for proper
dispersion was to allow the water to reach thermal
equilibrium with the test environment before sampling commenced. This was achieved by storing the water in the
laboratory for several days prior to sampling. This process
minimized the introduction of thermal currents by
temperature variations which would prevent the free settling
of the individual particles. This procedure is a relatively simple and inexpensive alternate method for temperature
control in comparison to the use of thermal insulators that are often called for in guidelines for carrying out
sedimentation analyses with the Andreasen pipette (8).
C. Increasing the Sensitivity of the Method
A major disadvantage associated with the Andreasen sedimentation pipette is the significant amount of time
required for the sizing of fine particles when following the standard procedure of using a water medium and the
designated 20 cm sampling height. This was of particular
concern for this project since determining the respirable
fraction called for sizing particles having aerodynamic
Law predicts that these particles would require a sampling
time of at least 10 hours.
Observation of Stokes' Equation as defined by equation
(6) suggests that several variables can be feasibly altered
with the net effect of reducing the sampling time (t). These
are the sampling height (H) and the viscosity of the medium
(\i) which in turn would change the medium density (p ).
Variations on each of the above were investigated. The
sampling strategies employed included 1) reducing the
sampling height (h) from 20 cm to 5 cm. Data from a standard
sampling run for the same dust (i.e. using a water medium
and an initial 20 cm sampling height) was used as a standard
of reference, and 2) using hexane in place of water as the
sampling medium. This substitution would show a decrease in
viscosity and density relative to water and would allow for
more rapid settling of dust particles.
Sampling at a height of 5 cm was carried out in a water
medium using the Andreasen method. As predicted by Stokes'
Law, this procedural modification greatly reduced the 10
hour sampling time for 3.5 micron particles (Da) down to 45
minutes. Table II, which reflects sampling time and particle
diameter for water-based runs, shows that the diameter of
the largest particle present in each sample decreases at
least by a factor of two when reducing the initial sampling
height from 20 to 5 cm. This effect becomes more pronounced
TABLE II.
Comparison of Sampling Times
at 5 and 20 Centimeter Sampling Height
Particle Diameter Sampled (microns) Time (seconds) 20 Cm 5 Cm
20 121 51
120 45 17 700 18 6
1200 14 4
1800 11 3 2700 9 2 3650 7 2
Figure 3 shows that the accuracy of the data also seems
to improve with the shorter sampling height, perhaps because
now there are at least two points with mass data less than
50% of the total mass. Agreement is better with the 5 cm
height both in median diameter and geometric standard
deviation.
Conducting the experiment with hexane as the medium
yielded unexpected results. Upon contact with the hexane fluid, the silica particles immediately agglomerated into
clusters and settled to the cylinder bottom, thus
eliminating the possibility of particle sampling. A
possible explanation for this occurrence is the effect of
electrostatic forces. Because the sample readily dispersed
31
100
10
<
Q
COMPARISON OF SAMPLING HEIGHT
1.0
0.1
.^'
9-^
A _^
— " A..>'
rr
-'" .>ͣ
^^
_^,.--.-''
.^-4-"-
n
„-'-..^ͣ' 5^
.'^^'^
.^'
„
-'''' B —^ c Mfg. Spec, --- o ^cmHEfQHT
--- A 20 cm HEIGHT
.-^'.^-ͣ^^ r-^
y""^,^^ !;
10 20 30 40 50 60 70 80 90
PERCENT LESS THAN
98
Figure 3. Comparison of sedimentation data at a sampling height of 5 and 20 cm
bonds between sample particles, consequently preventing
particle agglomeration.
In contrast, the hexane molecules, which are nonpolar, failed to interact with the sample particles, therefore
allowing the sample particles to bond together to form large clusters with settling times of only a few seconds. This
view was supported by mixing the sample with several mediums
of a polar and nonpolar nature. Even so, calculations using polar alcohols such as methyl, ethyl, and isopropyl alcohol for the medium indicated that the best approach to shorter sampling times was to reduce the initial sampling height to
5 cm rather than substituting these substances for water. Based on the results of this investigation, the 5 cm initial sampling height with the water medium was
incorporated into the experimental design for the sampling
of all test dusts.
Experimental Procedure for Sedimentation Method
After completing the dispersion analyses, the sampling method involved preparation of a suspension by mixing a
known quantity of test material and distilled, deionized
water within the glass cylinder. The amount of test
material added ranged from a a concentration of 0.25% to
1.25% by volume.
The mixture was then agitated for two minutes and
sedimentation by applying suction to the upper end of the
pipette with a rubber bulb. The samples were drawn into the
10 ml glass bulb at successive time intervals, with the
actual sampling interval running approximately 20 seconds
(4). Turning the stopcock a quarter revolution and applying
pressure to the rubber bulb allowed the contents of the 10
ml glass bulb to drain via a faucet-shaped mechanism into a
pre-weighed aluminum evaporation dish. The aliquots were
then evaporated to dryness in a drying oven. The samples
were removed from the oven, allowed to cool and then weighed
on a Mettler Model HL 52 balance. Time measurements were
conducted with a Heurr stopwatch. All sedimentation runs
were carried out at 22''C.
Table III shows a typical sampling run for the
sedimentation analysis.
TABLE III.
Typical S«unpling Run for Sedimentation Analysis
Sample Dry Weight Time Height Diameter
(gm) (sec) (cm) (micron)
1 0.236 10
5.0 74.60
2 0.166 120 4.6
20.66
3 0.125 300
4.2 12.48
4 0.087
720 3.8 7.66
5 0.067 1200
3.4 5.62
6 0.057 1500
3.0 4.72
7 0.047 1800 2.6
4.01
8 0.042 2100 2.2
3.41
9 0.035 2400 1.8
2.89
10 0.028 2700
1.4 2.40
11 0.019 3600 1.0
Development of Cumulative Size Distributions
The weight of the first sample represented the initial
weight of the test material. The percentage by weight of
specific groups of grain sizes were calculated by dividing
the weight of each sample into the initial weight of the
test material, i.e. the weight of the first sample. The
Stokes equivalent diameter of the fallen particles was then
determined by application of Stokes' Law as described by
equation (6). Since it took about 20 seconds to siphon the
sample, the midpoint of the interval was used for
calculating particle size.
Each sample drawn has a smaller particle size than that
corresponding to the equivalent diameter predicted by
Stokes' law because all particles of larger size will have
fallen below the level of the tip of the pipette's sampling
tube.
Cumulative size distributions by mass were then
obtained by plotting the particle mass of each sample
against the diameter provided by the equation on
log-probability paper. Each dust curve required a certain
degree of extrapolation at the lower portion of the curve
depending on the number of data points available for the
smaller particles. Longer sampling times, such as 90
the curve and thus required less extrapolation. In contrast,
dust with low densities, such as 2.0 gms/cm-', and/or shorter
sampling times, such as 60 minutes, provided fewer data
points at the lower end of the curve and thereby required
greater extrapolation.
Defining the Respirable Cutpoint
Determining the respirable fraction of the test dust
using the sedimentation data first required developing a
exact cutpoint which distinguished between respirable and
nonrespirable particles. The American Conference of
Governmental Industrial Hygienists (ACGIH) defines
respirable particulate mass as follows:
"Respirable Particulate Mass consists of those
particles that penetrate a separator whose size collection
efficiency is described by a cumulative lognormal function
with a median aerodynamic diameter of 3.5 microns ±0.3
microns and with a geometric standard deviation of 1.5
±0.1." (24)
Based on the ACGIH guidelines, an aerodynamic diameter
of 3.5 microns was selected as the respirable cutpoint
for the sedimentation data (31). Application of the equation
( D, = DV p, ) provided conversion of aerodynamic to actual
Evaluation of the Role of Bias
Although the Andreasen sedimentation pipette is
generally accepted as providing an accuracy of +0.5% to ±3%,
it is important to address potential sources of bias and the
direction of their likely effect on the observed results.
When the sources of error are recognized and controlled for
by periodic checking with other methods, sedimentation is
considered by many to be the best method for particle size
analysis.
A consistent criticism of the Andreasen sedimentation
pipette is that the withdrawal of the sample removes a
portion of the suspension with a thickness in excess of one
centimeter, and subseguently disrupts the free settling of
the particles that are to be sampled next. Various
individuals have modified the design of the Andreasen
pipette with the intent of reducing the effects of these
disturbances, although the author is not familiar with these
apparatus (8,10,23). It has also been noted that the
pipette may actually collect particles a significant
distance below the pipette tip, particularly when the sample
is drawn too rapidly and when extreme pressure is applied to
the bulb. This tendency is more pronounced with the very
fine materials and will serve to overestimate the results
for the per cent remaining in suspension. This is not as
likely to occur for the coarser grained particles. Drawing
interval is the best approach to minimizing these effects
(4).
Another source of error arises when the sedimentation
method is carried out without the proper degree of
dispersion. This effect could bias the size frequency curve
in either direction, depending on the dispersion behavior
patterns. If poor dispersion is due to the clumping of
particles, then the bias would be towards the larger
particles at the expense of the smaller ones since
individual particles behave with densities and diameters
much higher than their true values. This result would be an
underestimation of the percentage of respirable particles.
On the other hand, if the poor dispersion is due to
excessive concentration, then the percentage of fines would
be overestimated because of the hindered settling effects
(13).
Although inadequate dispersion is the most frequently
occurring source of error when employing sedimentation
sampling methods, it should not discourage individuals from
employing this method. Poor dispersion rarely occurs with
subtlety and thus is easy to recognize and control for. In
most cases, improper dispersion results from an excessive
concentration of particles within the suspension and/or the
presence of electrostatic charges. In the former case,
decreasing the particle concentration, and in the latter,
proper dispersion. Analysis of a few drops of the
suspension under the microscope should confirm whether the
proper degree of dispersion has been obtained. However, in
the event that sampling is carried out under conditions of
poor dispersion, oftentimes the error will clearly manifest
itself in the sampling data and the size frequency curve.
Table IV show data collected for a talc sample under
conditions of poor dispersion. Evaluation of the data show
significant increases rather than decreases in mass from one
sample to the next. Significant increases from one sample to
the next are clear evidence for the occurrence of poor
dispersion. Hinkley provides an excellent discussion on
additional indicators of poor dispersion (12).
TABLE IV.
Sedimentation Data Collected
Under Conditions of Poor Dispersion
Sample Sample Collected Sampling Time
Sampling Height
# Dry Weight (Gms)
(Sees) (Cms)
1 0.047 10
5.0
2 0.054 120
4.6
3 0.047
300 4.2
4 0.050
720 3.8
5 0.038
1200 3.4
6 0.048 1800
3.0
7 0.041 2400
2.6
8 0.041 3390
2.2
A final bias associated with any sedimentation pipette
suspension remains in the pipette stem between the operating
tap of the pipette and the pipette's tip. This space between
the pipette tap and the tip is known as the dead space, and
the error it introduces is called the dead-space error (13).
It is generally agreed that the dead-space error is probably
too small to be of any consequence(4). In the case of the
Andreasen sedimentation pipette, the pipette stem's channel
is so narrow that significant dead-space errors are
METHODOLOGY - RESPIRABLE FRACTION MEASUREMENTS
Elutriation Using a Cyclone
Sedimentation respirable results were validated by
side-by-side comparisons with cyclone respirable
measurements performed on the same dusts.
The 10-mm nylon cyclone precollector followed by a
preweighed filter is the most widely used method for
determining respirable mass in the workplace. The cyclone's
operation is based on a recognition of the size-selecting
characteristics of the human respiratory tract (18). A
sampling pump is used to draw air through the cyclone via an
inlet that is tangential to the cyclone's cylindrical
section. The geometry of the inlet forces the air to spin
around the cyclone several times before exiting the top and
then passing through the filter. The respirable particles
are carried with the air stream and deposited on the filter,
whereas the larger particles are propelled out of the
airstreara by centrifugal force and either deposited on the
cyclone walls or dropped into the removal section or grit
pot at the cyclone's bottom (25). Lippman's article offers a
unique and up-to-date perspective of size-selective sampling
and the cyclone, as well as providing scientists of a more
zealous nature with 183 further references (26).
federal respirable mass standards. At this time, the U.S.
enforces respirable dust standards for occupational exposure
to silica, coal, talc, a few other mineral dusts, and
nuisance particulates. Respirable dust standards for silica
are shown in Appendix B.
Respirable dust concentrations within a workplace can
be determined by sampling a volume of air with the cyclone
and filter assembly and then dividing the net weight of dust
collected on a filter by the total volume of air sampled.
(Flow rate X sampling time = total volume of air sampled.)
Respirable mass sampling results are only valid for dusts
that are absorbed in the alveolar region of the lung. The
ACGIH provides guidelines for Particle Size-Selective TLVs
for respirable crystalline silica (18, 31). The Particle
Size-Selective TLV for materials which are hazardous when
deposited in the gas-exchange region of the lungs is
expressed as a Respirable Particulate Mass TLV. The ACGIH
defines the respirable particulate mass in quantitative
terms as follows:
"Respirable Particulate Mass consists of those
particles that penetrate a separator whose size collection
efficiency is described by a cumulative lognormal function
with a median aerodynamic diameter of 3.5 microns +0.3
microns and with a geometric standard deviation of 1.5
±0.1." (24)
This definition is intended to provide an acceptable level
For the research undertaken here, respirable mass
sampling was used to determine the respirable fraction of an
airborne dust. These results were obtained by aspiring a
known amount of dust within a chamber, and taking side-by
side samples of respirable dust and total dust, i.e. dust
collected on a filter without a cyclone precollector. The
ratio of respirable dust to total dust represented the
respirable fraction, as defined by the ACGIH.
Experimental Cyclone Design
Respirable mass samples were collected on 37 mm
polyvinyl chloride filters (PVC) having a nominal pore size
of 5 microns. The rationale for selecting this filter type
was due to anticipation that the samples might be analyzed
in the future for free silica. If free silica analysis is
not expected, use of standard 0.8 micron membrane filters is
recommended.
Sampling was conducted within an acrylic chamber having
a volume of approximately one cubic meter or 37 cubic feet.
The chamber was sealed from potential leaks to ensure
integrity of the system. The sampling train consisted of
one open face sampler and three two-stage "respirable" dust
samplers at a vertical orientation 40 centimeters from the
chamber bottom. The four samplers were placed in a circular
fashion in the center of the chamber with the open-face
circle's center. Each sampler was individually connected by
flexible tubing to a Doerr vacuum pump, located outside the
chamber. The system was designed to provide a flow rate of
1.7 liters per minute (1pm), the flow rate recommended by
the ACGIH for respirable mass sampling. Dwyer RMB 50
rotameters were placed in line to measure pump flow rates.
The rotameters were calibrated against a primary flow
standard. Figure 4 shows the experimental design for the
cyclone respirable fraction analyses.
The open face sampler consisted of a PVC filter loaded
into a standard Lucite filter holder. This sample
represented the "total" airborne dust concentration. The
"respirable" dust samplers consisted of 10-mm nylon cyclones
and 37-mm cassettes loaded with the 37 mm PVC filters.
These samples represented the "mass respirable
concentration" of the total airborne material. All filters,
respirable and open-face were supported by cellulose back up
pads to prevent breakthrough. The cassettes were sealed
from leakage with strips of tape.
Experimental Procedure for Cyclone Sampling
Each run was initiated by coating the inside of the
chamber with a known amount of the test material. Failure to
precoat the chamber resulted in inconsistent sampling data
which predicted unreasonably low respirable and total dust
INTO CHAMBER
A--I=l SOURCg
tJUSttfWECTlON POINT
ACftyUC CHAMB^A
PUMP
OPEN-FACE FILTER
ROTAMETERS
^^^^u^^:^
CYCLONE ASSEMBLY _I
...{pN£&F~nS:E>
Upon injection into the chamber, the tendency seemed to be
for the particles to move towards the walls and to occupy
all free surfaces before developing a uniform dust cloud
within the chamber. This observation was further supported
by data collected following an initial chamber precoating,
which yielded consistent amounts of dust loading on the
filters and total dust values in closer agreement with
theoretical expectations.
Following the initial precoating, a weighed amount of
the bulk test material was dispersed in the chamber.
Dispersion was accomplished either by aspiring the dust
through a venturi injector into the chamber or in the case
of dusts having an appreciable amount of very large
particles, by air flotation of the material from a beaker
placed on the chamber bottom immediately in front of a
mixing fan. After dispersion, a mixing fan was allowed to
operate for an additional minute to ensure a uniform
distribution of the dust cloud within the chamber. The fan
was then turned off and sampling commenced at a flow rate of
1.7 1pm. Actual sampling time varied from 5 to 21 minutes
depending on the amount of dust injected into the chamber.
Sampling was discontinued if excessive dust loading appeared
to be occurring on the open face filter. A Heurr stopwatch
was used for all time measurements. Sampling was carried
The net weight of dust collected on each filter was
determined by weighing the filters before and after each
test run on a Mettler Model HL 52 balance accurate to 10
micrograms. To adjust for fluctuations in the final digit
during weighing, the result was recorded as the average of
five successive readings. Variations greater than 30
micrograms were not accepted; however, variability was
usually much lower. The accuracy of this method was
confirmed by weighing a 100 microgram standard weight prior
to each weighing session.
The high static electrical charge carried by the
membrane filters greatly interfered with the weighing
process. This problem was overcome by passing the filters
over a Po-210 static eliminator (Nuclear Products Co. Model
2U500) prior to each weighing.
The ratio of each of the three respirable dust samples
to the total dust sample was calculated and the respirable
fraction of the bulk material when airborne was taken to be
the average of the three ratios.
Following weighing, the filters were resealed and held
for possible future free silica analysis. This analysis
would be carried out in accordance with NIOSH Analytical
Method #7500 and the sampling was conducted to be in
#
RESULTS
Sedimentation Data - Cumulative Size Distributions
Sedimentation analyses were carried out on a total of
15 different dusts. One run was conducted for the pesticide
dusts, diatomaceous compound #4, and the Arizona road dust,
while a minimum of two runs were performed for the remaining
dusts. Figures 5-25 show the cumulative size distributions
of the bulk material with the percentage by weight equal to
or less than a given particle size plotted as a function of
particle size (microns). A regression analysis was
performed on the data and is plotted as the regression curve
shown on the figures. Also shown on the figures are general
characteristics of the dusts, as well as the geometric mean
and the geometric standard deviation (GSD) of the particle
sizes. The geometric mean represents the value with the
greatest frequency of particles, and the geometric standard
deviation quantifies the particle size variability or
relation to the mean. For example, a GSD of 1.0 indicates no
variability in particle size, while a GSD of 2.0 represents
relatively high variability.
Most samples appear to approximate a log-normal
distribution. For dusts that significantly diverged from a
log-normal distribution, it was speculated that particle
agglomeration may have been occurring. This was also
sample mass from one sample to the next, or had suspiciously
high values for the geometric mean particle diameter. For
dusts which exhibited these tendencies, the sedimentation
analyses were reconducted but with the addition of a known
dispersing agent. In all cases, the follow-up experiments
yielded data that 1) showed a subsequent decrease in sample
mass from one aliquot to the next, 2) predicted a higher
respirable fraction than the initial sedimentation run, and
3) that more closely approximated a log-normal curve. These
observations were taken as indications that complete
dispersion had not been achieved in the original test run.
The sedimentation method shows high levels of
reproducibility ±1% in predicting the respirable fraction of
the bulk material when carried out with adequate dispersion.
Varying the suspension concentration by volume within the
range of 0.5% to 1.2% did not affect the respirable
prediction outside the 1% range of error. It is of interest
to note that the sedimentation technique continues to show
high reproducibility even when the conditions necessary for
carrying out the analysis are not met. For example,
consecutive runs carried out on the clay sample in a
flocculated state predicted the same respirable fraction
value of 10% +1%. These data indicate a state of consistency
with the pipette method when repeat analyses are performed
on the same dust under the same conditions.