“Musicalization of the Culture”: Is Music
Becoming Louder, More Repetitive, Monotonous and Simpler?
Yukun Yang
School of Information and Library Science, University of North Carolina, Chapel Hill [email protected]
Abstract
“Musicalization of the culture” is the social science concept proposed by American philosopher George Stainer. He de-picted the glooming future of music—it would become om-nipresent while having increasing volume, repetitiveness, and monotony, which are ascribed to the debase of literal aesthetics. Although research that relates to one or some of these predictions exists, neither of them encompass all these “musicalization” manifestations, nor do they study the trend of these predictions over time. Therefore, this preliminary research tries to validate whether music has gained acoustic loudness, and lyrical repetitiveness, monotony, and sim-plicity in a computational fashion. Conducting time-series analysis with trend detection, we confirmed the increasing trends of acoustic loudness and repetitiveness but not mo-notony and simplicity from 1970 to 2016 using the MetroL-yrics dataset and Spotify API. To investigate the simultanei-ty of these trends, we further conducted synchrony analysis and found little evidence indicating they would influence each other in a lagged fashion. In light of the results, we briefly discussed our findings by relating to the music in-dustry change in reality. Our research made the first attempt to answer this music sociological preposition. On top of this, we also proposed novel metrics to quantify repetitive-ness using closed frequent sequential pattern mining, which could be illuminating for future research.
Introduction
Ubiquitous is the music in contemporary society: a consid-erable amount of everyday media consumption is music, includes music, or at least, apropos to music. This omni-presence of music, manifesting as the around-the-clock availability of almost all music, has been captured and conceptualized by certain social and humanities research-ers, such as the study of “ubiquitous listening” (Kassabian, 2013) and “sound environment” (Nowak & Bennett, 2014). One of the earliest theories is “musicalization of the cu l-ture”, termed by Steiner. It depicts a gloomy vision of f u-ture by expounding on the process of music, “lingua fra
Copyright © 2020, Association for the Advancement of Artificial Intelli-gence (www.aaai.org). All rights reserved.
ca” in his language milieu, becoming a “universal dialect” that no one can escape from immersing in “constant throb”, “unending beats” and “all-pervasive pulsation” (Steiner, 1971). The form of this auditory culture can be ascribed to the loss of common aesthetic ground and shared cultural criteria, also the adulteration of the linguistic nature of pre-viously private communication activities (Steiner, 1971). Broadly speaking, “musicalization of the culture” focuses on these manifestations of music proliferation, namely the increasing volume, repetitiveness, and monotony of music. On top of that, it also comments on the degrading of words as the culprit, which we understood as the text of music being simpler and unnuanced.
One or some of these major manifestations of “musical i-zation of the culture” have attracted the attention of schol-ars in different disciplines. Loudness, one of the primary facets of contemporary music, has been increasing as commercial companies initializing the competition of loudness for profits (Vickers, 2010, 2011). Not only loud-ness, but also repetition is recognized as a significant factor for enhancing the listener’s preference (Bradley, 1971; Getz, 1966; Middleton, 1983), which serves as a key factor for market success (Nunes, Ordanini, & Valsesia, 2015). Monotony has been interpreted in different ways, such as homogeneity. Recent studies also confirmed that music over the years is becoming more similar (Serrà, Corral, Boguñá, Haro, & Arcos, 2012). Although these studies support the idea of “musicalization of the culture” respe c-tively and implicitly, the concept has not been validated as a whole rigidly and empirically. Besides that, the decreas-ing complicity of words in music has not been mentioned as well.
product, evolves with cultural evolution (Savage, 2019); thus, it is also important to know the trend of music in terms of loudness, repetitiveness, monotony, and simplici-ty. However, the studies about modern music evolution barely poke around all of these concepts together simulta-neously. Given the studies about all these musicalization manifestations exist, they show indifference toward their chronological evolution and change.
Considering the current research progress in this topic, this research tries to encompass that music being louder, more repetitive and monotonous, and the lyrical literacy is deteriorating under the umbrella term of “musicalization of the culture”. We use this compound and sophisticated s o-cial science concept to capture all these harbingered music changes in modern culture. Also, for the want of quantita-tive justification, we position this research in the realm of computational social science, trying to add new insights into this social theory in a computational fashion. We try to understand these questions:
1.Is there a significant trend of increasing loudness in mu-sic acoustically?
2.Is there a significant trend of increasing lyrical repetition in music?
3.Is there a significant trend of increasing lyrical monoto-ny in music?
4.Is there a significant trend of increasing lyrical simplici-ty in music?
5.Is there significant synchrony among these trends? Our research makes contributions in the following ways. First, we propose and evaluate novel ways to quantify the idea of repetition of the lyrics with frequent sequential pat-tern mining, which has not been utilized in the measure-ment of lyrical repetitiveness before. Second, we conflate the study of loudness, repetitiveness, monotony, and sim-plicity of modern music and test their trend using time-series analysis. This juxtaposition would help us better understand their interrelationships, which also further leads to our third contribution: from the perspective of musicol-ogy, we provide a large scale and quantitative verification for “musicalization of the culture”, which has not been tested using this data mining method in the past.
Related Work
Loudness as a human cognitive perception comes from the amplitude of the music acoustically (“Music and Compu t-ers,” 2017). One prominent research topic of the loudness in recent years is about the “loudness war”, denoted as “the ongoing increase in the loudness of recorded music” (Vickers, 2010). The culprit of this phenomenon is said to be technology advances, such as hyper compression. The concept of “loudness war” remains as a theoretical discus-sion because much discusdiscus-sion is devoted to the critical
analysis toward to its origin (Sreedhar, 2007), and its side-effects (NPR, 2009; Singer, 2014). However, the empirical study of “loudness war” is in default. This absence of proof leads to the doubts of the existence of this music-becoming-louder trend, let alone further discussions about its implication and importance. Only a few recent studies had really delved into this concept by substantial data-oriented evidence. Some small sample analysis of hit songs by Echo Nest (The Echo Nest Blog, 2013) and the studies using their API (Lamere, 2009) confirmed this trend to some extent. Barring these, the only big-scale data-driven music evolution research also discovered that the rise of the loudness: the median of the loudness mounted 9 dB from 1965 to 2005 (Serrà et al., 2012).
Repetition could be a motif repeated throughout a com-position. Studies of repetitions in music span at a wide spectrum, noticeably music theory, psychology, and mar-keting. Amid the theoretical and philosophical discussion of repetition, scholars described repetition as a “musical universal” (Nettl, 2005) and a “design feature” (Fitch, 2006) that is found in all cultures. In some research about music education, using repetitive motifs in music has long been considered as a trick to attract listen’s attention (Bradley, 1971; Getz, 1966). This function of repetition is also confirmed by other psychological research. It is re-ported that repetition is the trigger to familiarity, which further causes an emotional response to music (Pereira et al., 2011). However, as repetition also profuses in speech, the mechanism of emotion elicitation caused by repetition is different in music than that of speech; thus, repetition is also argued as a distinguisher of music and other commu-nicative approaches (Margulis, 2013). In regards to the emotional response of musical repetition, some viewed it in a negative lens, associating repetition with regressive emotions like boredom; however, repetition in music could also be intentionally used to serve as a process that induces pleasure, especially in genres like Electronic Dance Music (Garcia, 2005). This is associated with the “mere exp o-sure” effect in psychology: people like the things they e n-countered before (Margulis, 2014). The concept of cogni-tive fluency, “the increased processing ease with an i n-creased hedonic response” (Chmiel & Schubert, 2017), also bears a relationship about why people like to hear re-petitive music. A recent study in marketing deployed the idea of cognitive fluency and reported that lexical repeti-tiveness gives rise to the popularity of a song (Nunes et al., 2015). However, whether music is becoming more repeti-tive is implausible for the want of empirical study. Non-academic chronological analysis of repetitiveness of music does exist (Morris, 2017); however, the focus was similar to Nunes’s (2015) study, the popularity and repetitiveness. Also, the accountability of their measurement is not clear.
vocabulary, so they would reuse many words and therefore have high word homogeneity. No other literature about lyrics has been approached in the direction of vocabulary diversity. Few studies mentioned on the monotonous change of music and only Serrà’s team found out that the musical patterns and metrics have been consistently stable for years (Serrà et al., 2012).
Lyric Simplicity relates to the deterioration of lyrics based on Steiner’s prediction on the process of musicaliz a-tion of the culture. Though the analysis of lyrics over time abounds, we barely found articles discussing lyrical sim-plicity. Most of them focus on topics (Mauch, MacCallum, Levy, & Leroi, 2015), themes (Christenson, de Haan-Rietdijk, Roberts, & ter Bogt, 2019), and sentiments (Na-pier & Shamir, 2018).
Data & Method
Data Source & Feature Generation
Based on our research questions, two kinds of data are ac-quired, namely the acoustic features of the loudness, and the textual lyrics data. We used the MetroLyrics dataset1 in our project, which is the biggest lyrics dataset available online with more than 380,000 songs. It contains the metadata and the lyrics of the songs from 1970 to 2017. Every piece of lyric had been preprocessed by removing punctuations and stopwords before being analyzed. After dropping the empty lyrics records, we had the dataset with 102,575 songs. Next, we will discuss the quantitative measurement of different concepts of “musicalization”.
Loudness, as we discussed before, is the representation of the quality of the sound which primarily correlates to amplitude (“Music and Computers,” 2017). The feature of loudness was retrieved by using Spotify’s API2. This met-ric is the average value of the loudness measured in deci-bels (dB). Because humans interpret loudness based on the average quality of a stream of signals (Huber & Runstein, 2013), the average level of loudness in decibels is the most accurate representation of what we usually call loudness.
Repetitiveness is essentially related to the measure of repetition. The previous study measured this metric using the “compression rate” (Morris, 2017), such as the Lempel-Ziv algorithm (Lempel-Ziv & Lempel, 1977). This is a dictionary-based compression scheme where the dictionary used is the preceding text’s substring set. However, this character -based approach will fragment the lyrics and lose the infor-mation about the lyrics’ structures, also the word order. Aside from the fragmenting issue, the compression result is hard to interpret. Another metric to calculate repetitiveness
1 www.kaggle.com/gyani95/380000-lyrics-from-metrolyrics 2
developer.spotify.com/documentation/web-api/reference/tracks/get-audio-features/
is to count the repetitions of the words (Nunes et al., 2015). Although the repetition of words could somehow show that the lyrics have many overlapping parts, it suffers from the loss of contextual information of the repetition as well. To overcome the deficiency of the previous measurements mentioned above, we proposed to use the pattern-mining techniques, which have been extensively used in text data mining. Our pattern-based approach has two advantages compared to term-based or character-based repetition cal-culating methods. First of all, using frequent sequential patterns as repetition representations decreases the dimen-sionality. It only needs the tokens from all closed patterns while term-based approaches need all the terms in the doc-ument. The second advantage is its interpretability; it could catch more contextual and sequential information than oth-er approaches. It can shed light on the effectiveness and interpretability. The details of our proposed measurements are elaborated as below.
Consider D is the collection of all lyrics and ܦ ൌ ሼ݀ଵǡ ݀ଶǡ ǥ ݀ூǥ ݀ேሽ, where N is the number of lyrics in the collection. Each document ݀ூ߳ܦ has a sentence collection
S and ܵ ൌ ሼݏଵǡ ݏଶǡ ǥ ݏǥ ݏሽ, where n is the number of lines in S. Each sentence ݏ߳ܵ is consist of a collection of terms, and ݏൌ ൛ݐଵǡ ݐ
ଶǡ ǥ ݐǥ ݐൟ, where ݐ is the pth word and q is the number of words of the sentence. We went over each sentence ݏ߳ܵ, and generated a set of terms I of the whole
S, where ܫ ൌ ሼݐଵଵǡ ݐ
ଶଵǡ ǥ ݐ௩ǥ ݐ௪ሽ and w is the total number of unique terms in I. Then we assigned each term ݐ߳ݏ
as a number mapped from itemset I, so each ݏ߳ܵ could also be represented as a collection consist of ܫ, where 1 ݆ ݓ. Next, we generated a frequent sequential pattern collec-tion P for each document ݀ூ߳ܦ whereܲூ ൌ ൛ூǡ
ଶூǡ ǥ ூൟ. The number of frequent sequential patterns in ݀ூ is denoted as q. Specifically, we only generated the closed frequent sequential pattern because the closed pattern is more com-pact—it would reduce the redundancy of the pattern with-out losing much information. By definition, a pattern p is a closed pattern when it meets the following criteria: for eve-ry superset of p, denoted as p’, sup(p) > sup(p’) (Yan, Han, & Afshar, 2003). To get the actual closed frequent sequen-tial pattern, we used an efficient algorithm called BIDE (Wang & Han, 2004). Additionally, we set the support of the frequent sequential pattern as one, which means that we try to keep all the patterns even if the sentence is not being repeated. Therefore, we could get a rough partition of the song with all the frequent sequential patterns.
col-lection ܲூൌ ൛ଵூǡ ଶ ூǡ ǥ
ூൟ , its support collection is
ܨூൌ ൛݂ଵூǡ ݂ଶூǡ ǥ ݂ூൟ and the collection of the size of each pattern is ܮூൌ ൛݈ଵூǡ ݈
ଶ ூǡ ǥ ݈
ூൟ . This metric could be formu-lated as σ ൜
வଵൈ
௦
సభ
σసభൈ
. The Repetition Ratio can capture all the repetitions in the lyric and amplifies the short repeti-tive patterns in the lyrics since short repeated patterns are added multiple times.
Second, we applied the idea of H-index here. We sorted the ܨூ based on the support in a descending way. Then we found the maximum value of h such that the given song has h frequent sequential patterns that have each been re-peated at least h times. It metric, named as Simple H-index by us, could be calculated using the equation shown as
݈ܵ݅݉݁ܪ ൌ ሺܨǡ ݅ሻ, where F is the descendingly sorted support list. The assumptions using this metric are: first, it weights the lyric that has a consistently large num-ber of frequent sequential patterns more than the lyric only have one or two very frequent sequential patterns and many infrequent sequential patterns; second, it favors songs with longer and diverse lyrics because longer and more diverse lyrics could generate more patterns. Howev-er, it doesn’t consider the length of a repeated pattern b e-cause only support and its ranking are included, which slightly leans to weigh more on the short phrases or words.
Third, we also put the length of the pattern into consid-eration. We first sorted ܲூ based on the length of the fre-quent sefre-quential pattern, then we sorted the patterns with the same length based on their support. Therefore, its sup-port collection is ܨூ௦௧ ൌ ൛݂ଵூǡ ݂
ଶூǡ ǥ ݂ூൟ and the corre-sponding pattern size list is ܮூ௦௧ൌ ൛݈ଵூǡ ݈
ଶ ூǡ ǥ ݈
ூൟ. The sort-ing is conducted in a descendsort-ing way. Then we iterated the pattern list and tried to find the first frequent sequential pattern that has at least h items and has appeared at least h
times. It can be calculated by ܮ݁݊݃ݐ݄ െ ܵݑݎݐܪ ൌ ሺܨǡ ܮሻ. This metric takes the same assumption as the Simple H-index since they all favor longer lyrics and the lyrics with more kinds of frequent sequential patterns. It also assumes that longer patterns would receive less port, and tries to find the largest pattern that has large sup-port. In this way, this metric tries to hedge with the prob-lem of the Simple H-index which favors unstructured short repetitive phrases or words in the relatively long lyrics.
We further evaluated the performance of our proposed three repetitiveness metrics. We collected a list of songs that have been discussed as the most repetitive songs by entertainment media and music fan websites, such as VH13
and ultimateclassicfan4. Then, we randomly sampled
an-other ten songs for comparison. An independensamples t-test was conducted to compare the repeated songs
3 www.vh1.com/news/23764/the-15-most-repetitive-songs-of-all-time/ 4 ultimateclassicrock.com/repetitive-songs/
nized by the public with our random songs. There was a significant difference in the value of Repeated Ratio be-tween repeated songs (M = .87, SD = .08) and random songs (M = .63, SD = .21), t (9) = 3.20, p = .005. Similar results are also found in Simple H-index when comparing the repeated songs (M = 7.6, SD = 2.75) and random songs (M = 4.0, SD = 1.88), t (9) = 3.40, p = .003. Length-Support H-index values of repeated songs (M = 6.3, SD = 2.11) and random songs (M = 3.60, SD = 1.42), t (9) = 3.34, p = .003 also showed statistical significance.
Besides the quantitative evaluation, we also conducted a qualitative evaluation. We examined the results returned by our proposed metrics, also the ones returned by the com-pression approached used in previous research. For the Repeated Ratio, we found it has a better performance than the compression rate in finding the longer repetitions. The below lyric is a typical example of this situation.
And she said, "Johnny darling/Ah, ah, ah hoo/Don't ever go, yeah/Ah, ha, ha, ha"/And she said, "Johnny darling/Ah, ah, ah hoo/Don't ever go, yeah/Ah, ha, ha, ha"/And she said, "Johnny darling/Johnny dar-ling/Don't ever go" (Kappa, 1984)
The whole song basically repeats a four-line textual chunk three times, and every line has been repeated for at least two times. This textual arrangement ensures the minimum support for each frequent sequential pattern to be more than one; therefore, this song has a Repeated Ratio of one. However, in terms of the compression rate, the final result is 0.35, that is to say, only 35% of the texts can be com-pressed. At the same time, our Repeated Ratio also per-formed well in the situations when the compression rate worked well, that is when the whole song only has a repeti-tive short and monotonous text segment. For example, one of the most repetitive songs according to the compression rate is “Around the World” by Daft Punk (Daft Punk, 1996). Its lyric contains only one line, with 72 times of repetition. Its compression rate is 0.96 and meanwhile, its Repeated Ratio is 1.0, since the only frequent sequential pattern is P = {“around”, “the”, “world”, “around”, “the”,
“world”}, with the support of 72.
song, not only because it has a single short sentence re-peated time after time, but also it used the same sentence structure in many lines— “If you [verb] me, and I will [verb] you back”. This song scored only a moderately high compression rate of 0.7, but it had a very high H-index of 21.
However, we did find the situation that the Simple H-index misclassified a song being repetitive just because the song has a very long lyric, thus it has a lot of commonly used word phrases counted as frequent patterns. A typical case found in the human analysis is Childish Gambino’s “Because of the Internet Screenplay - Part 2”. It is part of the 72-page screenplay script. Its high ranking in repeti-tiveness based on Simple H-index is mainly because of the length of the lyrics.
The Length-Support H-index is adept at catching long repetitive text segments in a long song. In the human anal-ysis, we confirmed its ability to counterbalance Simple H-index’s tendency to capture short phrases, which will pre-vent the problematic results when we used the Simple H-index. For instance, the Length-Support H-index of the song “Because the Internet Screenplay - Part 2” is only six. Other top-ranking most repetitive songs based on the Length-Support H-index all contain the repetitions of long sentences, for example, the sentence, “To get up, get up, get up so cash your checks and get up”, was repeated 14 times in the song “1st of tha Month” (Bone Thugs-n-Harmony, 1995).
Nonetheless, we failed to use the H-index metrics to capture some extreme cases, for example, when the whole song just repeats one single simple line. The song “Around the World” (Daft Punk, 1996), which has a very high com-pression rate, only has the H-indexes of one, because it only has one closed frequent sequential pattern.
To sum up, in our qualitative analysis, we further con-firmed our metrics’ capacity of capturing repetitions in the lyrics. The Repeated Ratio proved to be an improved gen-eral indicator for the repetitiveness of a song, compared with the compression rate. And the Simple H-index and Length-Support H-index performed well in capturing two different kinds of nuanced repetitiveness in a song. They complement well with each other and provide supplemen-tary information to the Repeated Ratio.
Monotony in our research is interpreted as the diversity of the word usage of each lyric. Lexical Diversity (LD) indicates “the range of different words used in a text” (McCarthy & Jarvis, 2010); a greater range shows a higher diversity. We used the Measure of Textual Lexical Diversi-ty (MTLD) (McCarthy, 2005) as the metric for assessing LD. MTLD adopts the idea of the Type-Token Ratio (TTR). Generally, MTLD reflects the average length of a substring of a text for which a certain TTR value is main-tained (Fergadiotis, Wright, & West, 2013). It has been widely used for its specificity to LD (Fergadiotis et al.,
2013) and its relative robustness to text length (Koizumi & In’nami, 2012).
Lyrical Simplicity is measured by the readability of the lyrics. Readability indicates the level of difficulty to under-stand a text document. A higher value of readability indi-cates a lower level of lyrical simplicity. There are several metrics associated with readability, which are mostly based on the length of the sentences, words, syllables, and other variables. Here we used the majority vote of some estab-lished readability metrics, including Flesch Kincaid Grade (Kincaid, Fishburne, Robert P., Richard L., & Brad S., 1975), Flesch Reading Ease (Flesch, 1948), SMOG Index (Mc Laughlin, 1969), Coleman Liau Index (Coleman & Liau, 1975), Automated Readability Index (Senter & Smith, 1967), Dale Chall Readability Score (Dale & Chall, 1948), Linsear Write Formula (Klare, 1974), and Gunning Fog Index (Gunning, 1968).
Method
Time-series analysis was utilized to find whether there are chronological trends of the music in regards to loudness, repetitiveness, monotony, and lyrical simplicity. We ag-gregated the songs by the year and calculated the average of these features. Thus, time series data ranging from 1970 to 2016 was generated on a yearly basis.
Specifically, we conducted a trend analysis. Mann-Kendall trend test (Mann-Kendall, 1948) is a nonparametric test and is superior for detecting linear or non-linear trends. Sen’s slop (Sen, 1968), a nonparametric procedure for es-timating the slope of trend, is also introduced in our trend detection as a complement to the MK test. It shows the magnitude of the trend, while the MK test validates the significance of the trend and its trend direction. Compared to the parametric test, they do not require the data to con-firm the normal distribution. They have been widely used in trend detection for time-series data in other fields, such as environmental science and economy.
Data Analysis
Preliminary Data Understanding
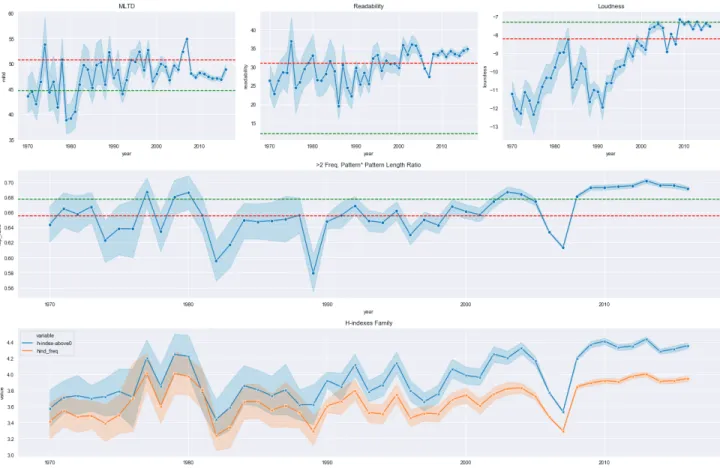
To analyze the series data, we first plotted the time-series data. Figure 1 shows the average value of MTLD, Majority Vote Readability, Loudness, and the other three metrics about Repetitiveness from 1970 to 2016, along with their 95% level confidence interval. Because the number of songs available for each year is different—more data could be retrieved in recent years—the values of the metrics from the early years have more variability while the recent years’ values are more centralized.
fluctuat-ing around -12 dB from 1970 to 1976. It reached the nadir around -12.5 dB in the year of 1975. In the next seven years, loudness enjoyed a consecutive blooming and peaked at 1983 with the mean value of -8 dB. From the middle of the 1980s to the early 1990s, loudness kept dwindling until 1991. From 1992 to 2009, the average loudness of the music soared in the speed similar to the second phase and reaches the record high of -7 dB, 5 dB louder than 40 years ago. Since 2010, the loudness re-mained steady about the level of -7 dB.
The trace of MTLD was more random. It debuted around 45 in the early 1970s, and then rocketed to 55 in two years. This metric kept going up and down alternative-ly until 1979 when it plummeted to the record low value about 38. In the next 20 years, it mostly kept fluctuating in the range of mean and median, which are 51 and 45 respec-tively. The highest value of MTLD was witnessed in 2007 at the level of 55. Since the 2010s, the value merely changed and stayed at the mean of 47.
The readability plot showed similar random shifting pat-terns as MTLD. In the first 30 years since 1970, Readabil-ity kept rolling around 25 and had shown the patterns of oscillation in a five- or six-year basis, with the total of 7 noticeable peaks being in the trend. It continued to rise
around the new century and suddenly dropped in 2007. The last nine years after 2007 witnessed the fluctuation faded away as the readability indexes stayed around 32.5.
All three repetitiveness-related metrics showed similar patterns. The repetitiveness stepped to the height in 1977, where the Repeated Ratio has a value of 0.69 and two H-indexes with the values of 4.2 and 4.0. This abnormal in-crease was transitory as the repetitiveness returned to the level before 1977 in the year of 1978, while in 1979 and 1980, the value came back to another high level. Repeti-tiveness metrics all plunged during 1981 and 1982. From 1982, the Repeated Ratio stayed stable for five years until it decreased to a record low value of 0.58 at the year of 1989. However, the h-indexes gradually declined from 1983 and reached a relatively low value of 1989. The 1990s was the decade that receptiveness change was rela-tively more placid. All three metrics kept seesawing, and 1992, 1995, and 1999 were the years when repetitiveness showed as spikes. In the new millennium, the repetitive-ness metrics slowly rose; however, from 2005 to 2007, they suddenly slumped into a low placement. The sudden drop disappeared in the next year and it regained its 2000s average level. Since 2018, the repetitiveness barely nudged as it stayed at the record high level.
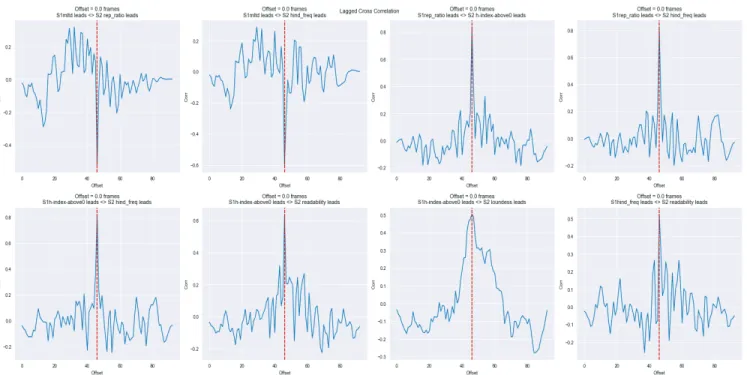
Figure 2. Time Series with Time Lagged Cross Correlation Normalized Coefficient above 0.5
Trend Test
As the plots of the metrics we generated showed non-stationarity, we further conducted the stationary test using the Augmented Dickey-Fuller Test (Dickey & Fuller, 1979).
Table 1. ADF Test Result
Metric Test Statistics P-value
Loudness -1.703 0.429
Readability -1.490 0.538
MTLD -1.809 0.375
Repeated Ratio -3.775 0.003 Simple H-index -1.655 0.454 Length-Support H
-index -1.407 0.578
Table 1 shows the result of the stationary test. With all p
values above the threshold of 0.05, the time series of Loudness, Readability, MTLD, Simple H-index, and Length-Support H-index are non-stationary. However, the Repeated Ratio time series exhibits the stationarity (p <
.05).
Since the time series are mostly not stationary, we fur-ther assumed that fur-there are trends inside. Thus, we con-ducted the MK test for trend detection. Table 2 shows that all time-series have a significant trend over the years under the significance level of 5%.
Specifically, Loudness has an increasing trend (tau = .663 > 0), and it is expected to increase 0.102 per year. Readability with 0.173 significant magnitudes also pre-sents an increasing trend. MTLD’s increasing trend is more subtle, with a slope of 0.093, which is similar to the
Re-peated Ratio with a slope of 0.001. H-indexes for the measurement of repetitiveness are also significant, with the slopes of 0.132 and 0.007 correspondingly.
Table 2. MK Trend Test Result
Metric Tau P-value Slope Sen’s Loudness 0.663 0.000 0.102 Readability 0.354 0.000 0.173
MTLD 0.234 0.020 0.093
Repeated Ratio 0.286 0.005 0.001 Simple H-index 0.417 0.000 0.132 Length-Support H
-index 0.248 0.014 0.007
Synchrony Analysis
As we observed that some metrics showed similar patterns of shifting, we conducted a synchrony analysis to under-stand if there was a correlation between different time-series, and its possible time lags. Considering the nature of time-series and the possible delayed correlation, we use the Time-lagged Cross-Correlation (TLCC) to synchronize different time series.
Length-Support H-index and Repeated Ratio were nega-tively correlated (r = -.6, r = -.5).
All strongly correlated time-series were most correlated when there is no time-lagged. However, we did observe that some weaker correlations occur after lagged, for ex-ample, Readability was mostly correlated with Loudness when it was two years lagged (r = .44); also, MTLD was positively correlated with Simple H-index when there were 6 years lagged (r = .42).
Discussion
“Everything Louder Than Everything Else”:
Loudness War Is Real
Our analysis of loudness confirms the previous study about the evolution of the music (Serrà et al., 2012), also the dis-cussion about the “loudness war” (NPR, 2009). Macr o-scopically, our result is similar to the research from Serrà et al. (2012): their result is a 9 dB increase and an average increase of 0.13 dB each year while ours is a 7 dB incre-ment and an average 0.102 dB increasing speed.
We also want to discuss the fluctuation of the metric in different periods. As the loudness hinges on the production of the music, it concerns how the audio signals are com-pressed in different formats. In the 1960s and 1970s, alt-hough the trend of competing for loudness was intensified, the actual loudness increase was limited due to the nature of vinyl, which was the main music recording at the time (Accattatis, 2010). In our dataset, we do find the increase in the loudness was relatively stable around that time peri-od.
In the 1980s, the invention of compact disk brought more possibility of amplifying loudness, outpacing the limits of vinyl (NPR, 2009). The widespread use of the CD was not dominative until the latter decade, and since the technology limit has broken, it is expected that the loud-ness would increase since the late 1980s. However, in our analysis, we do not witness the huge increase of loudness until the 1990s.
Nonetheless, the CD has its limit, and one workaround is to conquer the zero-dB mark, which began to be adopted widely by pop music until the mid-1990s (NPR, 2009). Our research does capture an increase during the mid-1990s, but not a drastic one. It continued the momentum of increase since the early 1990s. Nonetheless, our analysis confirmed to another loudness war discussion which de-limited the period of loudness war from about 1989 to around 2004 (Cox, 2016), while the most prominent in-crease in our analysis is almost the same, from 1991 to 2005.
During the new century, MP3 and other digital music platforms were increasingly replacing CDs as the most
popular way of listening to music, which further pushed the competition of loudness. The prevalence of MP3 and other downloading services were at the heyday from 2007. It is observed that the increasing trend is not obvious but the loudness level stays high during the years. The three years of sudden decrease around 2007 may be the indicator of a transitional phase from CD to digital music.
It is also argued by other articles that the loudness of music is genre-related, for example, heavy metal music usually has a higher average of loudness than the others (Smith, 2008). While metal music enjoyed mainstream success from 1989 to 1991 (Bennett & Waksman, 2014). Our dataset did not show the match of two trends, which might indicate the market share of the music from this gen-re is pgen-retty gen-restricted.
“One More Time. You Know I'm Just Feeling":
Repetitiveness Growth Never Rests
Our trend analysis also confirms that music is becoming more repetitiveness, with all three proposed repetitiveness metrics having significant increasing trends.
We find our result resembles that of the Collin’s (2017), though different datasets and approaches are adopted in the analysis respectively. This might indicate that the general change of repetitiveness is outward and can be captured in many ways. We both observe a sudden decrease around 1973 and the early 2000s, and the record-high repetitive-ness after the 2010s. Also, we both validate that the period from 2013 to 2014 is the most repetitive period of all time. However, our trends differed with this previous study in several ways. In Collin’s calculation of the compression rate, the value rose from about 47.5% to about 54% from 1970 to 2015 whereas our results are more subtle, especial-ly the Repeated Ratio, with the Sen’s slope of 0.001. The magnitude of the increase was rather unobtrusive in our dataset.
We also find some nuances captured by our metrics that could possibly be interpreted by other outside data, for example, the commerce data. The first peak value of repeti-tiveness is 1977 while it is also the year that has the biggest increase ratio of retail sales from 1973 to 1988, with a 21.5% percent increase (Lopes, 1992). The decline of re-petitiveness in the early 1980s also echoes with the de-creasing retail values, which started in 1979 and stopped in 1982. It is said to be ascribed to the consolidation of major music companies, causing a significant recession in the music industry (Lopes, 1992).
another research about lyrics (Napier & Shamir, 2018). The rise of repetitiveness after 2007, which showed a rec-ord high and ever-growing trend, matched with another discussion about pop music, which “took on more fun, bubbly and sometimes lighthearted qualities” (Donelan, 2015).
Furthermore, we discuss the trend of repetitiveness showed three different metrics. Simple H-index, which is good at catching repetitiveness of short pattens of a diverse and longer song, is the most significant among all metrics, also with the highest Sen’s slope. This indicates that songs might become more repetitive in repeated short patterns. However, the song’s overall repeated patterns are more diverse, since the Repeated Ratio has the smallest increas-ing magnitude among all metrics. The Length-Support H-index, which considers pattern length, is significant with a moderate slope value; it might support the idea that the trend that longer songs with longer repeated patterns are more prevalent now.
“An Ending Fitting for The Start”: Monotony
Circles Back
Monotony, measured as the lexical diversity in our re-search shows a significant increasing trend that contradicts the prediction of “musicalization of the culture”. It is shown that the word usage was more diverse over time. However, in recent years, diversity withdrawals to a previ-ously low level.
Many discussions about the lexical diversity in music were associated with the genre, so here we also try to link the patterns we observed to the change of music tastes in reality. It is obvious that there are two peaks: one is in the early 1970s and the other is the latter half decade of the 1980s. It is reasonable to relate to the emergence of folk and hip-hop music. According to MusixMatch’s previous report, folk and hip-hop are the top two genres that have the average highest vocabulary (MusixMatch, 2015). In the meantime, the 1970s and the latter half of the 1980s were the time these two genres began to receive mainstream attention or popularity (Mauch et al., 2015). Therefore, the prevalence of the songs in these genres, which has a higher level of vocabulary use, potentially increased the overall music lexical diversity. The sudden decrease around 1990 might also bear a relationship with the genre, when dance, electronics, and new waves head over its glory days. Songs of these genres generally use fewer lyrics (Mauch et al., 2015), which might relate to the decrease we observed at that time. It is noticeable that there are different patterns showed in monotony since the 2000s, as the values from the first half are more varied and while those from the last couple of years are more stable. The change of popular music and its theme, for example, the sterner and more
lively differences on the themes at different times might help understand the shift (Myers, 2016).
“Less is More. It’s Minimal.”: Lyrics Are More
Complex Now
The examination of the readability of the lyrics, the oppo-site of lyrical simplicity, showed that the prediction from “musicalization” about literacy degrading is not supported as well. The trend fluctuates severely among all the metrics measured in our research. In all, the readability scores are increasing significantly which means they are probably increasingly hard to read. In default of other relevant re-search about the yearly evolution of readability, it is hard to find comparable results to discuss. Nonetheless, we did find that this metric resembles the trend of lexical diversi-ty.
“All at Once”: No Evidence for Lagged
Interac-tion
By synchronizing all metrics, several implications stand out. Leaving alone the lagged of time, we discover the cor-relations between different metrics. The repetitiveness is positively related to readability scores, which is counter-intuitive to previous research in which repetitive text was more readable (Aziz, Fook, & Alsree, 2010). It might indi-cate that the text of the lyrics was becoming both more repetitive and at the same time using more advanced or rare words. The repetitiveness is also negatively related to lexical diversity. This echoes with the other types of text, for example, the narratives and conversations: the more repetitive they are, the less lexically diverse they would be (Montag, Jones, & Smith, 2018). On top of this, when con-sidering the time-lagged effects, the result shows that the patterns mostly co-occur in the same time window. This implies that the strongest correlation between the metrics happens in the same time frame: all strongest correlations are found with no time-lagged while the maximum-lagged correlation coefficient is relatively small.
Conclusion & Limitation
tech-nology revolution, industry sales, or the change of the pub-lic taste. Additionally, we examined the cross-correlation about these time series to see whether there is an interac-tion between different features.
We recognize that this research has room for improve-ment, and some of these may provide fruitful avenues of further investigation. First of all, our dataset may not be comprehensive enough. The MetroLyrics dataset contains more songs from recent years and did not ensure the repre-sentativeness of the songs. The popularity of the songs in each year is unknown, and since not all songs enjoy similar popularity, the average repetitiveness of the song we ob-tained in this work may not be the average repetitiveness of the songs perceived by the majority of the listeners. Also, the data entries from MetroLyrics might need more human examinations. There are several reissued old songs, remix-es, covers, and might be assigned into a wrong release year.
Also, our proposed measurements for repetition focus on different patterns of repetition. It would be better to syn-thesize them all into a more complex metric to capture dif-ferent kinds of repetition motifs.
Another potential caveat of the metrics is loudness. The loudness we measured here is not the same loudness level people received in reality, because listeners have the dis-cretion to change the volume. Therefore, the conclusion about the loudness war is more theoretical and might be less aligned with reality.
Additionally, our data analysis that takes the average value of these metrics might over-simply the problem. The average value is sensitive to the sample size we obtained each year and some extreme values. There could be the case that there are more extreme repetitive songs in certain years while the rest large amount the songs remain not re-petitive.
Besides overcoming the deficits mentioned above, future research based on this concept could work on the interpre-tations about the minor shifts in different times, the cross-correlations between the time series we generated here and other outside data, for example, sales of music in different genres. Also, the same motif around 2007, as we called it the “mysterious V valley”, is still under interpreting; more domain knowledge could be applied here for clarification. In the end, because there are a lot of missing data about the genre, we do not test the relationship between these metrics about its genre. If relevant data is attainable, future re-search could cast the spotlight on the genre difference on the “Musicalization of the culture” phenomenon.
Acknowledgments
The author appreciates the anonymous reviewers for their helpful comments on this paper. Also, although this paper
is an independent work, the author would like to thank Dr. Yue Wang for his insightful and useful advice on the methodology and the data analysis during the process of this research.
Appendices
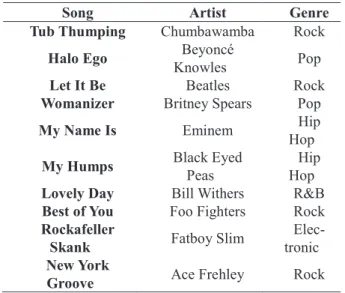
This table contains the data we used to quantitatively eval-uate the ground truth of repetitive songs using the signifi-cance test.
Table 3. Examples of Repetitive Songs Collected from Media
Song Artist Genre
Tub Thumping Chumbawamba Rock
Halo Ego KnowlesBeyoncé Pop
Let It Be Beatles Rock
Womanizer Britney Spears Pop
My Name Is Eminem HopHip
My Humps Black Eyed Peas HopHip Lovely Day Bill Withers R&B
Best of You Foo Fighters Rock
Rockafeller
Skank Fatboy Slim
Elec-tronic New York
Groove Ace Frehley Rock
References
Accattatis, M. 2010. The Loudness Race: A Posthuman Interpre-tation. Essay, August.
Aziz, A.; Fook, C. Y.; and Alsree, Z. 2010. Computational Text Analysis: A More Comprehensive Approach to Determine Read-ability of Reading Materials. Advances in Language and Literary Studies 1(2). doi.org/10.7575/aiac.alls.v.1n.2p.200
Bennett, A., and Waksman, S. 2014. The SAGE Handbook of Popular Music. Thousand Oaks: SAGE.
Bone Thugs-n-Harmony. 1995. 1st of tha Month. Ruthless Rec-ords.
Bradley, I. L. 1971. Repetition as a Factor in the Development of Musical Preferences. Journal of Research in Music Education,
19, 295–298.
Chmiel, A., and Schubert, E. 2017. Back to the inverted-U for music preference: A review of the literature. Psychology of Mu-sic, 45, 886–909.
Christenson, P. G.; Haan-Rietdijk, S.; Roberts, D. F.; and Terbogt, F. M. 2019. What has America been singing about? Trends in themes in the U.S. top-40 songs: 1960–2010. Psycholo-gy of Music, 47, 194–212.
Cox, P. T. 2016. Why is modern music so loud? BBC News. Re-trieved from https://www.bbc.com/news/entertainment-arts-35250557
Daft Punk. 1996. Around the World. Virgin.
Dale, E., and Chall, J. S. 1948. A Formula for Predicting Reada-bility. Educational Research Bulletin, 27, 11–28.
Dickey, D. A., and Fuller, W. A. 1979. Distribution of the estima-tors for autoregressive time series with a unit root. Journal of the American Statistical Association, 74, 427–431.
Digital Underground. 1991. Kiss You Back. Tommy Boy. Donelan, M. 2015. 1995 to 2015: Changes in popular lyrics re-flect the times—Entertainment and Life—The State Journal-Register. Retrieved from https://www.sj-r.com/article/20150921/ENTERTAINMENTLIFE/150929956 Fergadiotis, G.; Wright, H. H.; and West, T. M. 2013. Measuring Lexical Diversity in Narrative Discourse of People With Aphasia.
American Journal of Speech-Language Pathology / American Speech-Language-Hearing Association, 22. doi.org/10.1044/1058-03602013/12-0083
Fitch, W. T. 2006. The biology and evolution of music: A com-parative perspective. Cognition, 100, 173–215.
Flesch, R. 1948. A new readability yardstick. Journal of Applied Psychology, 32, 221.
Garcia, L.-M. 2005. On and On: Repetition as Process and Pleas-ure in Electronic Dance Music. Music Theory Online, 11.
Re-trieved from http://www.mtosmt.org/issues/mto.05.11.4/mto.05.11.4.garcia.ht
ml
Getz, R. P. 1966. The Effects of Repetition on Listening Re-sponse. Journal of Research in Music Education, 14, 178–192. Gunning, R. 1968. Technique of clear writing.
Huber, D. M., and Runstein, R. E. 2013. Modern recording tech-niques. Milton Park, United Kingdom: Routledge.
Kappa, F. 1984. Johnny Darling. Rykodisc.
Kassabian, A. 2013. Ubiquitous Listening: Affect, Attention, and Distributed Subjectivity. Berkeley, CA: University of California Press.
Kendall, M. G. 1948. Rank correlation methods. Oxford, Eng-land: Griffin.
Kincaid, J. P.; Fishburne, J.; Robert P. R., Richard L. C.; and Brad S. 1975. Derivation of New Readability Formulas Automat-ed Readability Index, Fog Count and Flesch Reading Ease For-mula for Navy Enlisted Personnel: Fort Belvoir, VA: Defense Technical Information Center.
Klare, G. R. 1974. Assessing Readability. Reading Research Quarterly, 10, 62–102.
Koizumi, R., and In’nami, Y. 2012. Effects of text length on lexi-cal diversity measures: Using short texts with less than 200 to-kens. System, 40, 554–564.
Lamere, P. 2009, March 24. The Loudness War Analyzed. Re-trieved September 18, 2019, from Music Machinery website: https://musicmachinery.com/2009/03/23/the-loudness-war/ Lopes, P. D. 1992. Innovation and Diversity in the Popular Music Industry, 1969 to 1990. American Sociological Review, 57, 56– 71.
Margulis, E. H. 2013. Repetition and Emotive Communication in Music Versus Speech. Frontiers in Psychology, 4. doi.org/10.3389/fpsyg.2013.00167
Margulis, E. H. 2014. On Repeat: How Music Plays the Mind. New York: Open University Press.
Mauch, M.; MacCallum, R. M.; Levy, M.; and Leroi, A. M. 2015. The evolution of popular music: USA 1960–2010. Royal Society Open Science, 2, 150081.
Mc Laughlin, G. H. 1969. SMOG Grading-a New Readability Formula. Journal of Reading, 12, 639–646.
McCarthy, P. M. 2005. An assessment of the range and useful-ness of lexical diversity measures and the potential of the measure of textual, lexical diversity MTLD. Ph.D. dissertation, Depart-ment of English, University of Memphis, Memphis, TN. McCarthy, P. M., and Jarvis, S. 2010. MTLD, vocd-D, and HD-D: A validation study of sophisticated approaches to lexical di-versity assessment. Behavior Research Methods, 42, 381–392. Middleton, R. 1983. ‘Play it again Sam’: Some notes on the productivity of repetition in popular music. Popular Music, 3, 235–270.
Montag, J. L.; Jones, M. N.; and Smith, L. B. 2018. Quantity and diversity: Simulating early word learning environments. Cogni-tive Science, 42, 375–412.
Morris, C. 2017. Are Pop Lyrics Getting More Repetitive? Re-trieved September 17, 2019, from The Pudding website: https://pudding.cool/2017/05/song-repetition/index.html
Music and Computers: A Theoretical and Historical Approach. 2017, November 21. Retrieved September 18, 2019, from
Com-puter Music Center website:
https://cmc.music.columbia.edu/projects/music-and-computers-a-theoretical-and-historical-approach
MusixMatch. 2015. The Largest Vocabulary in Music. Retrieved
December 10, 2019, from http://lab.musixmatch.com/largest_vocabulary/
Myers, K. 2016. The History of Pop Music in 5 Defining Dec-ades. Retrieved December 10, 2019, from
https://theculturetrip.com/north- america/usa/california/articles/the-history-of-pop-music-in-5-defining-decades/
Napier, K., and Shamir, L. 2018. Quantitative Sentiment Analysis of Lyrics in Popular Music. Journal of Popular Music Studies,
30, 161–176.
Nettl, B. 2005. The Study of Ethnomusicology: Thirty-One Issues and Concepts. Champaign, IL: University of Illinois Press. Nowak, R., and Bennett, A. 2014. Analysing Everyday Sound Environments: The Space, Time and Corporality of Musical Listening. Cultural Sociology, 8. doi.org/10.1177/1749975514532262
NPR. 2009. The Loudness Wars: Why Music Sounds Worse: NPR. Retrieved September 18, 2019, from https://www.npr.org/2009/12/31/122114058/the-loudness-wars-why-music-sounds-worse
Nunes, J. C.; Ordanini, A.; and Valsesia, F. 2015. The power of repetition: Repetitive lyrics in a song increase processing fluency and drive market success. Journal of Consumer Psychology, 25, 187–199.
Pereira, C. S.; Teixeira, J.; Figueiredo, P.; Xavier, J.; Castro, S. L.; and Brattico, E. 2011. Music and Emotions in the Brain: Fa-miliarity Matters. PLOS ONE, 6, e27241.
Sen, P. K. 1968. Estimates of the Regression Coefficient Based on Kendall’s Tau. Journal of the American Statistical Associa-tion, 63, 1379–1389.
Senter, R. J., and Smith, E. A. 1967. Automated readability index. Cincinnati, OH: University of Cincinnati Press.
Serrà, J.; Corral, Á.; Boguñá, M.; Haro, M.; and Arcos, J. L. 2012. Measuring the Evolution of Contemporary Western Popular Music. Scientific Reports, 2, 521.
Singer, D. 2014. Turning It Up to Eleven: The Perils of the Loud-ness War – The Morningside Review. Retrieved September 18, 2019, from https://morningsidereview.org/essay/turning-it-up-to-eleven-the-perils-of-the-loudness-war/
Smith, E. 2008. Even Heavy-Metal Fans Complain That Today’s Music Is Too Loud. Wall Street Journal. Retrieved from https://www.wsj.com/articles/SB122228767729272339
Sreedhar, S. 2007, August. The Future of Music—IEEE Spec-trum. Retrieved from IEEE Spectrum: Technology, Engineering, and Science News website: https://spectrum.ieee.org/computing/software/the-future-of-music Steiner, G. 1971. In Bluebeard’s castle: Some notes towards the
redefinition of culture. New Haven, CT: Yale University Press. The Echo Nest Blog. 2013. The Loudness War Is Real, and We Can Prove It with Science. Retrieved from The Echo Nest Blog
website: https://blog.echonest.com/post/62248127937/the-loudness-war-is-real-and-we-can-prove-it-with
Vickers, E. 2010. The Loudness War: Background, Speculation, and Recommendations. Paper presented at the 2010 Audio Engi-neering Society Convention.
Vickers, E. 2011. The Loudness War: Do Louder, Hypercom-pressed Recordings Sell Better? Journal of the Audio Engineering Society, 59, 346–351.
Wang, J., and Han, J. 2004. BIDE: Efficient mining of frequent closed sequences. Proceedings. 20th International Conference on Data Engineering, 79–90.
Yan, Xifeng.; Han, Jiawei.; and Afshar, Ramin. 2003. CloSpan: Mining: Closed Sequential Patterns in Large Datasets. In Pro-ceedings of the 2003 SIAM International Conference on Data Mining. Philadelphia, PA: Society for Industrial and Applied Mathematics.
Yu, G. C. J., and Ying, L. F. 2015. An Analysis of Repetitive Motifs and Their Listening Duration in Selected Western Popular Songs from 2000 to 2013. Procedia - Social and Behavioral Sci-ences, 185, 18–22.