M E T H O D O L O G Y
Open Access
An accelerated mouse model for atherosclerosis
and adipose tissue inflammation
Angelika Neuhofer
1†, Bernhard Wernly
1†, Lukas Leitner
1, Alisina Sarabi
1, Nicole G Sommer
1, Günther Staffler
2,
Maximilian Zeyda
1and Thomas M Stulnig
1*Abstract
Background:Obesity and particularly the metabolic syndrome, which is often associated with obesity, combine a major risk for type 2 diabetes and cardiovascular disease. Emerging evidence indicate obesity-associated subclinical inflammation primarily originating from adipose tissue as a common cause for type 2 diabetes and cardiovascular disease. However, a suitable and well-characterized mouse model to simultaneously study obesity-associated metabolic disorders and atherosclerosis is not available yet. Here we established and characterized a murine model combining diet-induced obesity and associated adipose tissue inflammation and metabolic deteriorations as well as atherosclerosis, hence reflecting the human situation of cardio-metabolic disease.
Methods:We compared a common high-fat diet with 0.15% cholesterol (HFC), and a high-fat, high-sucrose diet with 0.15% cholesterol (HFSC) fed to LDL receptor-deficient (LDLR−/−) mice. Insulin resistance, glucose tolerance, atherosclerotic lesion formation, hepatic lipid accumulation, and inflammatory gene expression in adipose tissue and liver were assessed.
Results:After 12–16 weeks, LDLR−/−mice fed HFSC or HFC developed significant diet-induced obesity, adipose tissue inflammation, insulin resistance, and impaired glucose tolerance compared to lean controls. Notably, HFSC-fed mice developed significantly higher adipose tissue inflammation in parallel with significantly elevated atherosclerotic lesion area compared to those on HFC. Moreover, LDLR−/−mice on HFSC showed increased insulin resistance and impaired glucose tolerance relative to those on HFC. After prolonged feeding (20 weeks), however, no significant differences in inflammatory and metabolic parameters as well as atherosclerotic lesion formation were detectable any more between LDLR−/−mice fed HFSC or HFC.
Conclusion:The use of high sucrose rather than more complex carbohydrates in high-fat diets significantly accelerates development of obesity-driven metabolic complications and atherosclerotic plaque formation parallel to obesity-induced adipose tissue inflammation in LDLR−/−mice. Hence LDLR−/−mice fed high-fat high-sucrose cholesterol-enriched diet appear to be a suitable and time-saving animal model for cardio-metabolic disease. Moreover our results support the suggested interrelation between adipose tissue inflammation and atherosclerotic plaque formation.
Keywords:Metabolic syndrome, Diet-induced obesity, Sucrose-enrichment, Adipose tissue inflammation, Insulin resistance, Glucose intolerance, Atherosclerosis, Type 2 diabetes, Cardio-metabolic disease
* Correspondence:[email protected] †Equal contributors
1Christian Doppler Laboratory for Cardio-Metabolic Immunotherapy and
Clin-ical Division of Endocrinology and Metabolism, Department of Medicine III, Medical University of Vienna, Vienna, Austria
Full list of author information is available at the end of the article
Background
Obesity is strongly associated with the so-called metabolic syndrome, which comprises a combination of factors con-ferring risk for type 2 diabetes and cardiovascular disease [1]. Hence in humans, risk for metabolic deterioration and atherosclerosis often occurs in common and is based on insulin resistance and inflammation [2,3]. Inflammation is a common soil of insulin resistance and atherosclerosis underlying type 2 diabetes and cardiovascular disease, respectively. Especially obesity-induced chronic low grade inflammation that primarily originates from the adipose tissue has been shown to play a crucial role in the de-velopment of obesity-related diseases [4,5]. In particular, visceral adipose tissue and liver are the primary source and target of circulating inflammatory mediators in obesity-induced inflammation [6]. In both adipose tissue and liver, macrophages, and other immune cells such as T-cells are a main source of inflammatory cytokines
such as tumor necrosis factor-α (TNFα), interleukin-6
(IL-6), monocyte chemoattractant protein-1 (MCP-1), and osteopontin [7-9] which drive the low-grade inflam-mation by mechanisms which need to be elucidated in more detail.
Recently, osteopontin has been identified as one of the key molecules involved in the pathogenesis of atheroscler-osis [10-13], as well as type 2 diabetes [14,15]. Moreover, osteopontin plays a role in the pathogenesis of nonalcoholic fatty liver disease (NAFLD) [16,17].
Epidemiological studies emphasize the relationship be-tween sugar consumption e.g. by sugar-sweetened bever-ages, long-term weight gain and type 2 diabetes mellitus [18,19]. Furthermore, rapidly absorbable carbohydrates such as sucrose leading to high dietary glycemic load may increase type 2 diabetes and cardiovascular risk independently of obesity by provoking inflammation and insulin resistance [20-22]. In addition, fructose also increases blood pressure, dyslipidemia and visceral adi-posity [23,24].
In order to reflect the highly prevalent human situation of cardio-metabolic risk and to elucidate mechanisms by which metabolic complications associated with obesity accelerate atherosclerosis in more detail, a well-character-ized mouse model is necessary which combines obesity, and insulin resistance with development of significant atherosclerosis. Although a number of mouse strains develop obesity and obesity-associated insulin resistance under certain conditions [25,26] most of these models are resistant to atherosclerosis [27]. On the other hand,
both LDL receptor-deficient (LDLR−/−) and particularly
apolipoprotein E-deficient (ApoE−/−) mice display marked
atherosclerosis [28,29] but ApoE−/− mice develop lower
diet-induced obesity, less profound insulin resistance and adipose tissue inflammation when fed a high-fat diet [30-32].
Hence, LDLR−/− mice seem to be a valuable basis to
establish an atherosclerotic mouse model combined with high-fat diet-induced obesity and insulin resistance. How-ever, the impact of a high glycemic load has not been compared to a common high-fat diet in this murine model. In order to develop and standardize a mouse model reflect-ing the human situation of metabolic syndrome with diet-induced obesity, adipose tissue inflammation promot-ing insulin resistance and atherosclerosis we investigated the effect of a common high-fat diet and a
sucrose-enriched high-fat diet in LDLR−/− mice. In addition,
ApoE−/− mice were used as a positive control for
ath-erosclerotic plaque formation.
Here we demonstrate that feeding LDLR−/− mice a
high-fat, high-sucrose cholesterol-enriched diet for 16 weeks represents a suitable mouse model for human cardio-metabolic disease. Moreover, our findings suggest an interrelation between increased obesity-associated inflammation and elevated atherosclerotic plaque
for-mation in LDLR−/−mice.
Methods
Animals and diet
Male LDLR−/− and ApoE−/− mice, both on a C57BL/6 J
background were purchased from Charles River
Labora-tories (Sulzfeld, Germany). At 9 weeks of age LDLR−/−
mice were placed on either a high-fat diet enriched with 0.15% cholesterol (HFC) containing 60 kcal% fat (pri-marily lard) and 20 kcal% carbohydrates with 6.8 kcal% deriving from sucrose (D01120401; Research Diets Inc., New Brunswick, NJ, USA), a sucrose-enriched high-fat diet with 0.15% cholesterol (HFSC) consisting of 58 kcal% fat (primarily lard) and 28 kcal% carbohydrates (with 17.5 kcal% from sucrose; D09071704, Research Diets Inc), [33] or a low-fat control diet (LF, 10 kcal% fat; D12450B; Research Diets Inc.) for up to 20 weeks. Fur-ther details about composition of the used diets are presented as Additional file 1: Table S1. In addition,
ApoE−/−mice were fed HFSC for 16 weeks. LDLR−/−mice
on LF served as a negative control for adipose tissue inflammation and insulin resistance.
of Vertebrate Animals Used for Experimental and Other Scientific Purposes.
Metabolic analyses
Plasma triglyceride and cholesterol concentration was analyzed using an automated analyzer (Falcor 350, A. Menarini Diagnostics, Florence, Italy). Enzyme-linked immunosorbent assay kits were used to determine plasma insulin (Mercodia AB, Uppsala, Sweden) and osteopontin levels (R&D Systems, Minneapolis, MN USA). Homeosta-sis model assessment of insulin reHomeosta-sistance (HOMA-IR) was calculated as an index for insulin resistance [34]. Insu-lin sensitivity was assessed by insuInsu-lin tolerance test after a 5-hour fasting period. Briefly, intraperitoneal injection of recombinant human insulin aspart (Novo Nordisk A/S, Denmark) at a dose of 0.75 U/kg body weight was given
to HFC- and HFSC-fed LDLR−/− mice and HFSC-fed
ApoE−/− mice. Blood glucose concentrations were
de-termined before and 30, 60, 90 and 120 minutes after insulin injection. Glucose tolerance test was performed after a 6-hour fasting period and blood glucose was measured before and 15, 45, 75, 105 and 135 minutes after intraperitoneal injection of 20% glucose (0.75 g/kg body weight).
FPLC analysis of plasma lipoproteins
To analyze plasma lipoproteins 12 μL of EDTA-treated
plasma were injected by autosampler into an Agilent 1200 HPLC instrument equipped with a Superose 6 10/300 gel-filtration FPLC column which separates the intact lipoproteins by size. An in-line assay for total cholesterol (Infinity Cholesterol reagent, Thermo Scientific) was per-formed at 37°C using a post-column reaction. Reaction products were monitored in real-time at 500 nm and the data analyzed using Agilent Chemstation software.
Real-time quantitative RT-PCR
Tissue samples were homogenized in TRIzol reagent (Life Technologies, Carlsbad, CA, USA) and RNA was
isolated according to the manufacturer’s protocol. One
microgram of total RNA was treated with DNase I and transcribed to cDNA using Superscript II and random hexamer primers (all Invitrogen) as described [35].
Gene expression of F4/80 (Emr1, Mm00802530_m1),
MCP-1 (Ccl2, Mm00441242_m1), TNFα (Tnf, Mm00443
258_m1), IL-6 (Il6, Mm00446190_m1), osteopontin (Spp1,
Mm00436767_m1), adiponectin (Adipoq, Mm0045642
5_m1), fatty acid synthase (Fasn, Mm00662319_m1),
acetyl-CoA carboxylase (Acaca,Mm01304289_m1),
stear-oyl-CoA desaturase 1 (Scd1, Mm00772290_m1), CD3
(Cd3e, Mm01179194_m1), CD8 (Cd8a, Mm0118210
8_m1), FoxP3 (Foxp3, Mm00475162_m1), CD19 (Cd19,
Mm00515420_m1), fatty acid binding protein 4 (FABP4;
Fabp4, Mm00445878_m1), leptin (Lep, Mm00434759_m1),
and peroxisome proliferator-activated receptorγ(PPARγ;
Pparg, Mm01184322_m1) was analyzed by quantitative real-time RT-PCR on an ABI Prism 7000 cycler using assays-on-demand kits (TaqMan® Gene Expression Assay, Life Technologies) and normalized to ubiquitin C mRNA
(Ubc, Mm01198158_m1).
Liver histology and Oil Red-O staining
Liver tissue was embedded in OCT and samples were cut
into 5-μm section, and stained with hematoxylin-eosin.
To further evaluate hepatic lipid content with Oil Red
O cryosections (7μm) were fixed in 60% isopropanol for
5 min and stained with 0.5% Oil Red-O (Sigma-Aldrich) in 60% isopropanol for 20 min, and finally counterstained with hematoxylin. Sections were analyzed with standard light microscopy, and relative areas of lipid accumulation (expressed as percentage Oil Red O staining) were quanti-fied using ImageJ software. A minimum of 5 independent fields per sample was evaluated.
Atherosclerosis quantification
Atherosclerotic plaque formation was determined using en face technique as described [36]. Briefly, thorax of sacrificed mice was opened and aorta was cleaned by removing fat and connective tissue. Then the aorta was excised 2 mm above aortic root and below iliac bifur-cation, opened longitudinally and pinned to silicone plates with acupuncture needles (asia-med, Suhl, Germany) and fixed overnight in 4% paraformaldehyde, 5% sucrose,
20 μM EDTA (pH 7.4). Atherosclerotic plaques were
stained with Sudan IV for 15 minutes and destained with 75% ethanol. Pictures were taken with a Sony Z-1000 camera and atherosclerotic lesion area was assessed by a person blinded to the samples by using ImageJ software.
Statistical analyses
Data are given as means ± SEM. Effects of dietary
treat-ment within LDLR−/− mice were analyzed by one-way
ANOVA using Dunnett’s multiple comparisons test.
Com-parisons between LDLR−/− and ApoE−/− mice both fed
HFSC were assessed by unpaired two-tailed Studentttest.
APvalue of≤0.05 was considered statistically significant.
Results
Sucrose-enriched high-fat diet induces earlier insulin resistance and dyslipidemia
In order to establish an appropriate mouse model for
cardio-metabolic disease, we placed male LDLR−/− mice
either on a low-fat control diet (LF) or two different high-fat diets, namely a common high-high-fat diet containing 0.15% cholesterol (HFC) or a high-fat diet rich in sucrose with
0.15% cholesterol (HFSC). In addition, ApoE−/− mice
glucose and insulin concentration before diet start did
not significantly differ between LDLR−/− and ApoE−/−
mice (Additional file 1: Table S2). LDLR−/− mice fed
both HFSC and HFC developed significant diet-induced obesity compared to LF-fed controls with no significant
difference between diets (Figure 1A). Also ApoE−/−
mice on HFSC showed marked obesity (Figure 1A). Gonadal adipose tissue weight was not significantly
altered between HFSC and HFC-fed LDLR−/− mice as
well as LDLR−/− compared to ApoE−/− mice both on
HFSC (Additional file 2: Figure S1).
After dietary treatment for 12 weeks fasting plasma
insulin and HOMA-IR in LDLR−/−mice was higher in the
HFSC and HFC group compared to LF. Moreover, HFSC feeding significantly increased fasting insulin level
com-pared to HFC-fed LDLR−/− mice indicating pronounced
insulin resistance in animals on HFSC (Figure 1B).
Corres-pondingly, HOMA-IR in LDLR−/− mice on HFSC was
significantly increased compared to the HFC-fed group
(Figure 1C). ApoE−/− mice developed significantly less
pronounced insulin resistance than LDLR−/−mice both on
HFSC (Figure 1C). Testing whole body insulin tolerance
Figure 1Sucrose-enriched high-fat diet induces earlier insulin resistance in obese LDLR−/−mice.LDLR−/−mice were placed on LF control
or two different high-fat diets both containing 0.15% cholesterol with (HFSC) or without sucrose enrichment (HFC). ApoE−/−mice were fed HFSC. Mean body weight after dietary treatment up to 20 weeks(A). Fasting plasma insulin and HOMA-IR was determined after treatment with indicated diets for 12 weeks (BandC;n= 8 animals per group except LF-fed LDLR−/−mice withn= 6). Glucose tolerance test was performed by intraperitoneal injection of 0.75 g 20% glucose/kg body weight after 12 weeks of feeding (n = 8 animals per group)(D). Fasting plasma insulin(E), HOMA-IR(F)
did not show significant differences between HFSC and HFC group (Additional file 2: Figure S1) while glucose
tolerance was impaired in HFSC-fed LDLR−/− mice as
illustrated by significantly increased glucose levels in response to a glucose tolerance test at the 15-minute time point (Figure 1D). After 20 weeks on diet, how-ever, there were no differences in fasting insulin levels,
HOMA-IR and glucose tolerance in LDLR−/− mice on
HFSC and HFC (Figure 1E-G) while body weight did not increase further.
Compared to LF-fed LDLR−/− mice, both groups on
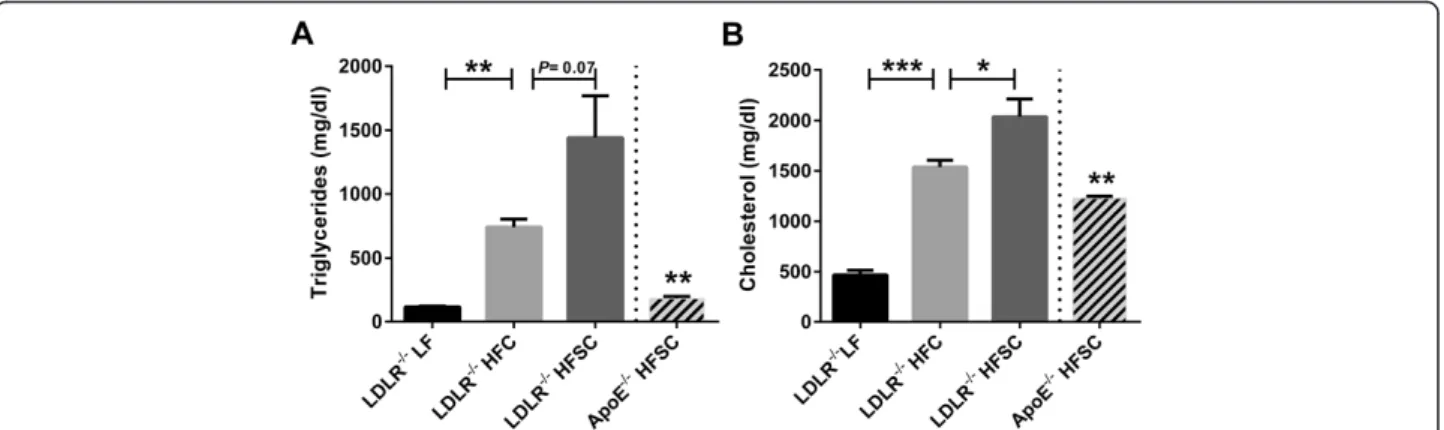
HFC and HFSC developed hypertriglyceridemia and hypercholesterolemia (Figure 2A,B). Fasting triglyceride
levels tended to be higher (P= 0.07) and total cholesterol
was significantly elevated in LDLR−/− mice on HFSC
compared to those on HFC (Figure 2A,B).
Fractionation of plasma lipoproteins by FPLC revealed markedly increased cholesterol in VLDL and LDL
frac-tions of obese LDLR−/−mice on both high-fat diets
com-pared to lean LF-fed LDLR−/−mice after 16 and 20 weeks
of feeding (Figure 3A,B). Lipoprotein profile of HFSC-fed
LDLR−/− mice showed elevated VLDL (P =0.013) and
LDL (P =0.04) cholesterol compared to HFC-fed group
after 16 but not 20 weeks of diet (Figure 3A,B). In addition, cholesterol in the VLDL and LDL fractions was
significantly lower (P≤0.001) in HFSC-fed ApoE−/− mice
than HFSC-fed LDLR−/−mice as shown in Figure 3A.
Sucrose-enrichment of high-fat diet induces more pronounced adipose tissue and hepatic inflammation after 16 weeks of feeding
Cytokines secreted by adipose tissue, so-called adipokines, induce local and systemic low-grade inflammation in obesity. In obese adipose tissue macrophages represent the main source of inflammatory adipokines although other cell types, such as lymphocytes, adipocytes, and
pre-adipocytes may contribute. To investigate the dietary impact on obesity-associated adipose tissue inflammation
in LDLR−/− mice we next analyzed expression of
in-flammatory adipokines and estimated accumulation of macrophages, T cells and B cells in gonadal adipose tissue. After dietary treatment for 16 weeks mRNA expression
ofEmr1, the gene encoding macrophage marker F4/80,
as well as mRNA levels of the inflammatory genes for
TNFα (Tnf), IL-6 (Il6), MCP-1 (Ccl2) and osteopontin
(Spp1) were significantly higher in adipose tissue of
obese LDLR−/− mice on both high-fat diets compared
to lean control group on LF (Figure 4). In contrast gene expression of the anti-inflammatory and
insulin-sensitiz-ing adiponectin (AdipoQ) as well as expression of typical
genes related to adipocyte function such as those for PPARγ (Pparg), FABP4 (Fabp4) and fatty acid synthase
(FAS,Fasn) was significantly lower in obese LDLR−/−mice
on both high-fat diets compared to LF-fed group after 16 weeks of feeding (Figure 4F and Additional file 3: Figure S4). Adipose tissue expression of the marker genes specific
for pan-T cells (Cd3e), cytotoxic (Cd8a), and regulatory T
cells (Foxp3) as well as B cells (Cd19) revealed no
sig-nificant obesity-induced alterations after both high-fat
diets compared to lean LF-fed LDLR−/− mice (Additional
file 4: Figure S2). In LDLR−/− mice adipose tissue
inflam-mation was significantly higher than in ApoE−/− mice fed
the same diet (Figure 4).
Notably, after 16 weeks of feeding adipose tissue
in-flammation was more pronounced in LDLR−/− mice on
HFSC than on HFC as indicated by significantly higher mRNA levels of the genes encoding macrophage marker
F4/80, TNF-α, and osteopontin (Figure 4A,B,E).
More-over, the marked increase of osteopontin mRNA levels in adipose tissue was accompanied by a borderline significant increase of osteopontin plasma levels in the HFSC-fed
group only (P= 0.07), while osteopontin plasma levels
in HFC-fed LDLR−/−mice were equal to animals on LF (Figure 4G). After 20 weeks of feeding, all mice showed similar osteopontin plasma levels (Figure 4G).
After 20 weeks on diet, adipose tissue inflammation
remained more pronounced in high-fat diet-fed LDLR−/−
mice compared to LF while adipose tissue inflammation in the HFSC and HFC group did not remain significantly different from each other suggesting a delayed peak of inflammation in the HFC group (Figure 4).
In order to characterize impact of HFSC compared to
HFC feeding on metabolic phenotype in LDLR−/−mice in
more detail, we next determined hepatic lipid accumula-tion and inflammaaccumula-tion after treatment with indicated diets.
LDLR−/−mice on both high fat diets (HFSC or HFC)
de-veloped extensive hepatic steatosis, compared to LF-fed lean controls after 16 as well as 20 weeks of feeding
(Additional file 5: Figure S3). Hepatic lipogenic gene
expression for FAS (Fasn) and acetyl-CoA carboxylase
(ACC;Acaca) but not stearoyl-CoA desaturase 1 (SCD1;
Scd1) were elevated in HFSC- compared to HFC-fed
LDLR−/−mice after 16 weeks of treatment (Figure 5A-C).
In addition, hepatic inflammation was significantly
elevated in obese LDLR−/− mice on both high-fat diets
compared to the LF group as shown by increased mRNA expression of the genes for macrophage marker F4/80,
MCP-1 and TNFα after 16 weeks of feeding (Figure
5D-F). This high-fat diet-induced increase of hepatic in-flammation was even more pronounced after 20 weeks
of diet. Of note, HFSC feeding of LDLR−/− mice for 16
weeks induced a significant higher expression of
osteopontin and TNFα compared to HFC-fed animals
(Figure 5F, G). These differences in inflammatory gene
expression evened out after 20 weeks of feeding sug-gesting that using a sucrose-enriched high-fat diet ac-celerates some features of fatty liver inflammation.
Sucrose-enriched high-fat diet accelerates atherosclerotic lesion development
To next determine if HFSC feeding affects atherosclerosis development, atherosclerotic lesion area was quantified in
the entire aorta by en face analysis. After 16 weeks of
diet-ary treatment, HFSC-fed LDLR−/− mice achieved similar
levels of atherosclerotic lesion area as HFSC-fed ApoE−/−
mice which we used as a positive control (Figure 6A). In addition, atherosclerotic lesion formation was
signifi-cantly increased in LDLR−/−mice fed HFSC compared to
LDLR−/−mice fed HFC for 16 weeks (Figure 6A,C). Only
after 20 weeks of dietary treatment, LDLR−/− mice on
HFSC and HFC achieved similar levels of atherosclerotic lesion areas (Figure 6B).
Discussion
Obesity and particularly the metabolic syndrome are associated with both, type 2 diabetes based on insulin resistance and cardiovascular disease. Obesity induces adipose tissue inflammation, which plays a key role in the development of obesity-driven metabolic complications leading the way to type 2 diabetes and cardiovascular
diseases [2,5]. Our data show and confirm that both
LDLR−/− and ApoE−/− mice develop diet-induced obesity
on high-fat diets, while LDLR−/− mice are more prone
to adipose tissue inflammation and insulin resistance in addition to atherosclerosis. Hence, this genetic background turned out to be more suitable for investigation of cardio-metabolic disease. Moreover, we show here that using sucrose rather than more complex carbohydrates in a high-fat diet significantly accelerated the development of obesity-induced adipose tissue inflammation, insulin
Figure 5Sucrose-enriched high fat diet partly accelerates hepatic inflammation.LDLR−/−mice were fed either HFSC, HFC or LF for 16 or 20 weeks (n= 6 animals per group). ApoE−/−mice were fed HFSC for 16 weeks (n= 8 animals per group). Hepatic lipogenic gene expression of FAS (Fas)(A), ACC (Acaca)(B), SCD-1 (Scd1)(C)and hepatic expression of the inflammatory genes for macrophage marker F4/80 (encoded byEmr1)
resistance, impaired glucose tolerance and atherosclerosis
in LDLR−/−mice leading to suitable readouts already after
12 to 16 weeks of dietary treatment.
After dietary treatment of LDLR−/− mice with HFSC or
HFC for 16 weeks mice on HFSC revealed significantly more pronounced adipose tissue inflammation as shown by elevated adipose tissue expression of the inflammatory
genes for F4/80, osteopontin and TNF-α Increased gene
expression of F4/80, a typical macrophage marker, indi-cates macrophage accumulation, while increased
osteopon-tin and TNF-αm RNA levels provide additional evidence
for local inflammation. Strikingly, after four more weeks,
adipose tissue inflammation in LDLR−/−mice fed HFSC
or HFC reached similar levels of inflammatory gene ex-pression suggesting that the high sucrose uptake speeds up rather than augments the detrimental effects of
high-fat and cholesterol-rich diets. In addition to adipose tissue
inflammation, LDLR−/− mice fed HFSC further
demon-strated increased hepatic inflammation compared to
HFC-fed LDLR−/− mice after 16 weeks of feeding while these
differences evened out after 20 weeks. These results may indicate an important role of dietary macronutri-ent composition e.g. on inflammatory alterations which grossly exceeds its effect on body weight [37-39].
At earlier time points, we observed marked differences in adipose tissue inflammation, insulin levels, HOMA-IR,
and glucose tolerance between the LDLR−/− animals on
HFSC and those on HFC while the insulin tolerance test did not show significant differences suggesting that whole body insulin resistance was not affected by HFSC. Strik-ingly, after 20 weeks on diet, the stabilization of adipose tissue inflammation was mirrored by comparable levels of
fasting insulin and HOMA-IR, which on the one hand might support the notion that adipose tissue inflammation contributes to insulin resistance [6,40]. On the other hand, this observation could be due to the fact that after a certain time span of feeding maximal biological effects
might be reached in HFSC-fed LDLR−/− mice and thus
reach a plateau while HFC-fed LDLR−/−mice then“catch
up” with the HFSC-fed group. In general this might be
an issue of many experimental diets which are often very extreme in their composition to reach maximum biological effects very fast. Moreover, although body
weight after dietary treatment of LDLR−/− mice with
HFSC or HFC for 12 weeks did not differ, total body weight exposure (area under the body weight curve) was moderately higher in HFSC- compared to HFC-fed
group (LDLR−/− mice on HFSC: 807 ± 23 and HFC:
737 ± 14), which could also contribute to difference in metabolic parameters at this time point.
Notably, mice on both diets used in this study appeared healthy at any time point, which is an advantage over the widely used Western Diets which reportedly leads to changes in fur and skin integrity even leading to ulceration or sudden weight loss [41].
After 16 weeks of diet LDLR−/−mice on HFSC but not
on HFC developed atherosclerotic lesion areas comparable
to the commonly used ApoE−/− model. The significant
early increase of total plasma cholesterol as well as an increase of VLDL and LDL cholesterol levels in
HFSC-fed LDLR−/− mice may certainly contribute to plaque
formation and represent major risk factors for athero-sclerosis [42]. On the other hand, the marked adipose tissue inflammation and insulin resistance in HFSC-fed animals might further suggest an association between obesity-induced inflammation and atherosclerotic plaque formation which was described in murine models [43] and is evident in clinical trials [44,45].
In addition to increased osteopontin mRNA levels in adipose tissue and liver, plasma osteopontin was in trend upregulated by the sucrose-enriched high-fat diet
(HFSC; P= 0.077), but not the common high-fat diet
(HFC) confirming earlier results that high-fat diet locally upregulates osteopontin in tissue but not in plasma [46]. HFSC-induced elevated plasma osteopontin could be directly related to its upregulation by glucose, which was shown in vascular smooth muscle cells and ar-teries of diabetic patients [47,48]. Thus, osteopontin seems to primarily act locally and is closely related to athero-sclerotic disease and cardiovascular events in patients [49]. In humans it is well known that diets with a high dietary glycemic load lead to inflammation, insulin resistance and impaired beta-cell function [20,22] and promote weight gain [50]. Of course one has to bear in mind that mice used in this study were of C57BL/6 background which is known to have smaller islet mass and more prominent
islet inflammation than other mouse strains, [51] but C57BL/6 are a widely accepted mouse model for obesity-associated complications.
Here we show that in LDLR−/−mice addition of sucrose
to a high-fat diet induces earlier and more pronounced adipose tissue inflammation, insulin resistance, glucose intolerance and atherosclerosis. As sucrose consists of both fructose and glucose our findings of worsened
cardio-metabolic situation in LDLR−/− mice fed HFSC
may be due to the high glycemic load on the one hand and fructose-induced adverse effects on the other hand. E.g. sucrose could partly contribute to accelerated in-flammation through fructose, which has been shown to
activate inflammatory pathways such as NF-κB
signal-ing and to induce oxidative stress in animal models which might further contribute to inflammatory alter-ations [52-54]. Moreover, fructose in high amounts has been shown to decrease insulin sensitivity more than glucose and to induce ectopic and visceral fat
depos-ition, de novo lipogenesis, higher blood pressure and
blood uric acid concentrations [23,55]. The fact that fructose absorption is enhanced in presence of glucose [56], may explain why fructose-enriched diets alone could
not induce insulin resistance in LDLR−/−mice [57].
Conclusions
In conclusion, our study demonstrates that feeding
LDLR−/−mice a sucrose-rich high-fat diet (HFSC)
con-stitutes a fast and suitable animal model to investigate the pathogenesis of cardio-metabolic disease including adipose tissue inflammation, insulin resistance and ath-erosclerosis. Saving a couple of weeks in every animal experiment will provide a significant advantage in every-day research. In addition, our data point to the close interrelation between adipose tissue inflammation, insulin resistance and atherosclerosis.
Additional files
Additional file 1: Table S1.Composition of the used diets.Table S2:
Baseline characteristics.
Additional file 2: Figure S1.LDLR-/- mice were placed on LF control or two different high-fat diets both containing 0.15% cholesterol with (HFSC) or without sucrose enrichment (HFC). ApoE-/- mice were fed HFSC. Mean go-nadal adipose tissue (GWAT) weight after dietary treatment for 16 and 20 weeks (A, B). Insulin tolerance test was performed by intraperitoneal injection of 0.75 g insulin/kg body weight after 12 and 20 weeks of feeding. Asterisk indicates significant difference between ApoE-/- and LDLR-/- mice on HFSC (n = 8 animals per group) (C, D). For statistical analysis LDLR-/- mice fed HFSC or LF were compared with HFC-fed LDLR-/- mice. In addititon, LDLR-/- and ApoE-/- mice both fed HFSC were compared. All data represent mean ± SEM. *P< 0.05, **P< 0.01, ***P< 0.001.
real-time RT-PCR. For statistical analysis LDLR-/- mice fed HFSC or LF were compared with HFC-fed LDLR-/- mice. In addititon, LDLR-/- and ApoE-/- mice both fed HFSC were compared. All data represent mean ± SEM. *P< 0.05, **P< 0.01, ***P< 0.001.
Additional file 4: Figure S2.LDLR-/- mice were fed HFSC, HFC or LF for 16 or 20 weeks (n= 6 animals per group). ApoE-/- mice were fed HFSC for 16 weeks (n= 8 animals per group). Gonadal adipose tissue expression of the marker genes for pan-T cells (Cd3e) (A), cytotoxic (Cd8a) (B), and regula-tory T cells (Foxp3) (C) as well as B cells (Cd19) (D) was analyzed by real-time RT-PCR. For statistical analysis LDLR-/- mice fed HFSC or LF were compared with HFC-fed LDLR-/- mice. In addititon, LDLR-/- and ApoE-/- mice both fed HFSC were compared. All data represent mean ± SEM.
Additional file 5: Figure S3.LDLR-/-mice were fed either HFSC, HFC
or LF for 16 or 20 weeks and ApoE-/-mice were fed HFSC for 16 weeks.
Hematoxylin-esoin and Oil Red O staining of liver sections was performed (n= 4-5 animals per group). Representative pictures after dietary treatment for 16 (A) or 20 weeks (B) are given in 20-fold magnification. Quantification of lipid accumulation in Oil Red O-stained sections (C). For statistical analysis LDLR-/-mice fed HFSC or LF were compared with
HFC-fed LDLR-/-mice. In addititon, LDLR-/-and ApoE-/-mice both fed HFSC
were compared. All data represent mean ± SEM.
Abbreviations
ACC:Acetyl-CoA carboxylase; ApoE−/−mice: Apolipoprotein E-deficient mice; FABP4: Fatty acid binding protein 4; HFC: High-fat diet supplemented with 0.15% cholesterol; HFSC: High-fat, high-sucrose diet supplemented with 0.15% cholesterol; HOMA-IR: Homeostasis model assessment of insulin resistance; IL-6: Interleukin 6; LDLR−/−mice: LDL receptor-deficient mice; LF: Low-fat control diet; MCP-1: Monocyte chemoattractant protein-1; OPN: Osteopontin; PPARγ: Peroxisome proliferator-activated receptorγ; SCD1: Stearoyl-CoA desaturase 1; TNFα: Tumor necrosis factor-α.
Competing interests
The authors declare that they have no competing interests.
Authors’contributions
AN conceived the study, researched and interpreted data, wrote the manuscript. BW researched and interpreted data, wrote the manuscript. LL, AS and NGS researched data and reviewed the manuscript. GS contributed to intellectual content of the manuscript, reviewed and edited the manuscript. MZ contributed to data interpretation, made significant contributions to intellectual content of this manuscript, reviewed and edited the manuscript. TMS designed and supervised the study, critically reviewed and edited the manuscript, and rose funding. AN and BW contributed equally to this work. All authors read and approved the final manuscript.
Acknowledgements
This work was supported by the Federal Ministry of Economy, Family and Youth and the National Foundation for Research, Technology and Development (all to T.M.S.). Moreover the authors acknowledge Verónica Moreno Viedma, Barbara Messner and Bernhard Scharinger (all Medical University of Vienna) for technical support and discussion as well as Audric Moses (Lipid Metabolite Analysis Core Facility, part of the Women and Children’s Health Research Institute and Faculty of Medicine and Dentistry at the University of Alberta, Edmonton, Canada) for performing FPLC analysis of plasma lipoproteins.
Author details 1
Christian Doppler Laboratory for Cardio-Metabolic Immunotherapy and Clin-ical Division of Endocrinology and Metabolism, Department of Medicine III, Medical University of Vienna, Vienna, Austria.2AFFiRiS AG, Vienna, Austria.
Received: 6 September 2013 Accepted: 21 December 2013 Published: 17 January 2014
References
1. Alberti KG, Eckel RH, Grundy SM, Zimmet PZ, Cleeman JI, Donato KA, Fruchart JC, James WP, Loria CM, Smith SC Jr:Harmonizing the metabolic syndrome: a joint interim statement of the International Diabetes Federation Task Force on Epidemiology and Prevention; National Heart,
Lung, and Blood Institute; American Heart Association; World Heart Federation; International Atherosclerosis Society; and International Association for the Study of Obesity.Circulation2009,120(16):1640–1645. 2. Bornfeldt K, Tabas I:Insulin resistance, hyperglycemia, and atherosclerosis.
Cell Metab2011,14(5):575–585.
3. An X, Yu D, Zhang R, Zhu J, Du R, Shi Y, Xiong X:Insulin resistance predicts progression of de novo atherosclerotic plaques in patients with coronary heart disease: a one-year follow-up study.Cardiovasc Diabetol 2012,11:71.
4. O’Rourke R:Inflammation in obesity-related diseases.Surgery2009, 145(3):255–259.
5. Hotamisligil GS:Inflammation and metabolic disorders.Nature2006, 444(7121):860–867.
6. Zeyda M, Stulnig TM:Obesity, inflammation, and insulin resistance–a mini-review.Gerontology2009,55(4):379–386.
7. Osborn O, Olefsky JM:The cellular and signaling networks linking the immune system and metabolism in disease.Nat Med2012,18(3):363–374. 8. Weisberg SP, McCann D, Desai M, Rosenbaum M, Leibel RL, Ferrante AW Jr:
Obesity is associated with macrophage accumulation in adipose tissue. J Clin Invest2003,112(12):1796–1808.
9. Sell H, Eckel J:Adipose tissue inflammation: novel insight into the role of macrophages and lymphocytes.Curr Opin Clin Nutr Metab Care2010, 13(4):366–370.
10. Breyne J, Juthier F, Corseaux D, Marechaux S, Zawadzki C, Jeanpierre E, Ung A, Ennezat PV, Susen S, Van Belle E,et al:Atherosclerotic-like process in aortic stenosis: activation of the tissue factor-thrombin pathway and potential role through osteopontin alteration.Atherosclerosis2010, 213(2):369–376.
11. Yan X, Sano M, Lu L, Wang W, Zhang Q, Zhang R, Wang L, Chen Q, Fukuda K, Shen W:Plasma concentrations of osteopontin, but not thrombin-cleaved osteopontin, are associated with the presence and severity of nephropathy and coronary artery disease in patients with type 2 diabetes mellitus. Cardiovasc Diabetol2010,9:70.
12. Matsui Y, Rittling SR, Okamoto H, Inobe M, Jia N, Shimizu T, Akino M, Sugawara T, Morimoto J, Kimura C,et al:Osteopontin deficiency attenuates atherosclerosis in female apolipoprotein E-deficient mice. Arterioscler Thromb Vasc Biol2003,23(6):1029–1034.
13. Bruemmer D, Collins AR, Noh G, Wang W, Territo M, Arias-Magallona S, Fishbein MC, Blaschke F, Kintscher U, Graf K,et al:Angiotensin II-accelerated atherosclerosis and aneurysm formation is attenuated in osteopontin-deficient mice.J Clin Invest2003,112(9):1318–1331.
14. Nomiyama T, Perez-Tilve D, Ogawa D, Gizard F, Zhao Y, Heywood E, Jones K, Kawamori R, Cassis L, Tschöp M,et al:Osteopontin mediates obesity-induced adipose tissue macrophage infiltration and insulin resistance in mice.J Clin Invest2007,117(10):2877–2888.
15. Kiefer F, Zeyda M, Gollinger K, Pfau B, Neuhofer A, Weichhart T, Säemann M, Geyeregger R, Schlederer M, Kenner L,et al:Neutralization of osteopontin inhibits obesity-induced inflammation and insulin resistance.Diabetes 2010,59(4):935–946.
16. Sahai A, Malladi P, Melin-Aldana H, Green RM, Whitington PF:Upregulation of osteopontin expression is involved in the development of nonalco-holic steatohepatitis in a dietary murine model.Am J Physiol Gastrointest Liver Physiol2004,287(1):G264–G273.
17. Kiefer FW, Neschen S, Pfau B, Legerer B, Neuhofer A, Kahle M, Schlederer M, Hrabe de Angelis M, Mair M, Kenner L,et al:Osteopontin deficiency protects against obesity-induced hepatic steatosis and attenuates glucose production in mice.Diabetologia2011,54(8):2132–2142.
18. Schulze MB, Manson JE, Ludwig DS, Colditz GA, Stampfer MJ, Willett WC, Hu FB:Sugar-sweetened beverages, weight gain, and incidence of type 2 diabetes in young and middle-aged women.JAMA2004,292(8):927–934. 19. Malik VS, Popkin BM, Bray GA, Despres JP, Willett WC, Hu FB:
Sugar-sweetened beverages and risk of metabolic syndrome and type 2 diabetes: a meta-analysis.Diabetes Care2010,33(11):2477–2483. 20. Schulze M, Liu S, Rimm E, Manson J, Willett W, Hu F:Glycemic index,
glycemic load, and dietary fiber intake and incidence of type 2 diabetes in younger and middle-aged women.Am J Clin Nutr2004,80(2):348–356. 21. Fung TT, Malik V, Rexrode KM, Manson JE, Willett WC, Hu FB:Sweetened
beverage consumption and risk of coronary heart disease in women. Am J Clin Nutr2009,89(4):1037–1042.
high-sensitivity C-reactive protein in middle-aged women.Am J Clin Nutr 2002,75(3):492–498.
23. Stanhope K, Schwarz J, Keim N, Griffen S, Bremer A, Graham J, Hatcher B, Cox C, Dyachenko A, Zhang W,et al:Consuming fructose-sweetened, not glucose-sweetened, beverages increases visceral adiposity and lipids and decreases insulin sensitivity in overweight/obese humans.J Clin Invest2009,119(5):1322–1334.
24. Jalal DI, Smits G, Johnson RJ, Chonchol M:Increased fructose associates with elevated blood pressure.J Am Soc Nephrol2010,21(9):1543–1549. 25. Rebuffe-Scrive M, Surwit R, Feinglos M, Kuhn C, Rodin J:Regional fat distribution
and metabolism in a new mouse model (C57BL/6 J) of non-insulin-dependent diabetes mellitus.Metabolism1993,42(11):1405–1409.
26. Chua S, Chung W, Wu-Peng X, Zhang Y, Liu S, Tartaglia L, Leibel R:Phenotypes of mouse diabetes and rat fatty due to mutations in the OB (leptin) receptor.Science1996,271(5251):994–996.
27. Nishina P, Naggert J, Verstuyft J, Paigen B:Atherosclerosis in genetically obese mice: the mutants obese, diabetes, fat, tubby, and lethal yellow. Metab Clin Exp1994,43(5):554–558.
28. Zhang S, Reddick R, Piedrahita J, Maeda N:Spontaneous
hypercholesterolemia and arterial lesions in mice lacking apolipoprotein E.Science1992,258(5081):468–471.
29. Lichtman AH, Clinton SK, Iiyama K, Connelly PW, Libby P, Cybulsky MI: Hyperlipidemia and atherosclerotic lesion development in LDL receptor-deficient mice fed defined semipurified diets with and without cholate. Arterioscler Thromb Vasc Biol1999,19(8):1938–1944.
30. Gao J, Katagiri H, Ishigaki Y, Yamada T, Ogihara T, Imai J, Uno K, Hasegawa Y, Kanzaki M, Yamamoto TT,et al:Involvement of apolipoprotein E in excess fat accumulation and insulin resistance.Diabetes2007,56(1):24–33. 31. Hofmann SM, Perez-Tilve D, Greer TM, Coburn BA, Grant E, Basford JE,
Tschop MH, Hui DY:Defective lipid delivery modulates glucose tolerance and metabolic response to diet in apolipoprotein E-deficient mice. Diabetes2008,57(1):5–12.
32. Bartelt A, Orlando P, Mele C, Ligresti A, Toedter K, Scheja L, Heeren J, Di Marzo V:Altered endocannabinoid signalling after a high-fat diet in Apoe (−/−) mice: relevance to adipose tissue inflammation, hepatic steatosis and insulin resistance.Diabetologia2011,54(11):2900–2910. 33. Schreyer SA, Vick C, Lystig TC, Mystkowski P, LeBoeuf RC:LDL receptor but
not apolipoprotein E deficiency increases diet-induced obesity and diabetes in mice.Am J Physiol Endocrinol Metab2002,282(1):E207–E214. 34. Ferrannini E, Mari A:How to measure insulin sensitivity.J Hypertens1998,
16(7):895–906.
35. Neuhofer A, Zeyda M, Mascher D, Itariu BK, Murano I, Leitner L, Hochbrugger EE, Fraisl P, Cinti S, Serhan CN,et al:Impaired local production of proresolving lipid mediators in obesity and 17-HDHA as a potential treatment for obesity-associated inflammation.Diabetes2013, 62(6):1945–1956.
36. Messner B, Zeller I, Ploner C, Frotschnig S, Ringer T, Steinacher-Nigisch A, Ritsch A, Laufer G, Huck C, Bernhard D:Ursolic acid causes DNA-damage, p53-mediated, mitochondria- and caspase-dependent human endothe-lial cell apoptosis, and accelerates atherosclerotic plaque formation in vivo.Atherosclerosis2011,219(2):402–408.
37. Burger KN, Beulens JW, van der Schouw YT, Sluijs I, Spijkerman AM, Sluik D, Boeing H, Kaaks R, Teucher B, Dethlefsen C,et al:Dietary fiber,
carbohydrate quality and quantity, and mortality risk of individuals with diabetes mellitus.PLoS One2012,7(8):e43127.
38. Barclay AW, Petocz P, McMillan-Price J, Flood VM, Prvan T, Mitchell P, Brand-Miller JC:Glycemic index, glycemic load, and chronic disease risk–a meta-analysis of observational studies.Am J Clin Nutr2008,87(3):627–637. 39. Gabrielsson BG, Wikstrom J, Jakubowicz R, Marmon SK, Carlsson NG, Jansson N,
Gan LM, Undeland I, Lonn M, Holmang A,et al:Dietary herring improves plasma lipid profiles and reduces atherosclerosis in obese low-density lipoprotein receptor-deficient mice.Int J Mol Med2012,29(3):331–337. 40. Berg A, Scherer P:Adipose tissue, inflammation, and cardiovascular
disease.Circ Res2005,96(9):939–949.
41. Hartvigsen K, Binder CJ, Hansen LF, Rafia A, Juliano J, Horkko S, Steinberg D, Palinski W, Witztum JL, Li AC:A diet-induced hypercholesterolemic murine model to study atherogenesis without obesity and metabolic syndrome. Arterioscler Thromb Vasc Biol2007,27(4):878–885.
42. Anderson K, Castelli W, Levy D:Cholesterol and mortality. 30 years of follow-up from the Framingham study.JAMA1987,257(16):2176–2180.
43. Ohman MK, Shen Y, Obimba CI, Wright AP, Warnock M, Lawrence DA, Eitzman DT:Visceral adipose tissue inflammation accelerates atherosclerosis in apolipoprotein E-deficient mice.Circulation2008,117(6):798–805. 44. Kaptoge S, Di Angelantonio E, Pennells L, Wood AM, White IR, Gao P,
Walker M, Thompson A, Sarwar N, Caslake M,et al:C-reactive protein, fibrinogen, and cardiovascular disease prediction.N Engl J Med2012, 367(14):1310–1320.
45. Ridker PM, Danielson E, Fonseca FA, Genest J, Gotto AM Jr, Kastelein JJ, Koenig W, Libby P, Lorenzatti AJ, Macfadyen JG,et al:Reduction in C-reactive protein and LDL cholesterol and cardiovascular event rates after initiation of rosuvastatin: a prospective study of the JUPITER trial. Lancet2009,373(9670):1175–1182.
46. Kiefer FW, Zeyda M, Todoric J, Huber J, Geyeregger R, Weichhart T, Aszmann O, Ludvik B, Silberhumer GR, Prager G,et al:Osteopontin expression in human and murine obesity: extensive local up-regulation in adipose tissue but minimal systemic alterations.Endocrinology2008,149(3):1350–1357. 47. Takemoto M, Yokote K, Nishimura M, Shigematsu T, Hasegawa T, Kon S,
Uede T, Matsumoto T, Saito Y, Mori S:Enhanced expression of osteopontin in human diabetic artery and analysis of its functional role in accelerated atherogenesis.Arterioscler Thromb Vasc Biol2000,20(3):624–628.
48. Nilsson-Berglund L, Zetterqvist A, Nilsson-Ohman J, Sigvardsson M, González Bosc L, Smith M-L, Salehi A, Agardh E, Fredrikson G, Agardh C-D,et al: Nuclear factor of activated T cells regulates osteopontin expression in arterial smooth muscle in response to diabetes-induced hyperglycemia. Arterioscler Thromb Vasc Biol2010,30(2):218–224.
49. de Kleijn DP, Moll FL, Hellings WE, Ozsarlak-Sozer G, de Bruin P, Doevendans PA, Vink A, Catanzariti LM, Schoneveld AH, Algra A,et al:Local atherosclerotic plaques are a source of prognostic biomarkers for adverse cardiovascular events.Arterioscler Thromb Vasc Biol2010,30(3):612–619.
50. Ludwig D:The glycemic index: physiological mechanisms relating to obesity, diabetes, and cardiovascular disease.JAMA2002,287(18):2414–2423. 51. Li J, Wang Q, Chai W, Chen MH, Liu Z, Shi W:Hyperglycemia in
apolipoprotein E-deficient mouse strains with different atherosclerosis susceptibility.Cardiovasc Diabetol2011,10:117.
52. Roglans N, Vila L, Farre M, Alegret M, Sanchez RM, Vazquez-Carrera M, Laguna JC:Impairment of hepatic Stat-3 activation and reduction of PPARalpha activity in fructose-fed rats.Hepatology2007,45(3):778–788. 53. Busserolles J, Rock E, Gueux E, Mazur A, Grolier P, Rayssiguier Y:Short-term
consumption of a high-sucrose diet has a pro-oxidant effect in rats. Br J Nutr2002,87(4):337–342.
54. Delbosc S, Paizanis E, Magous R, Araiz C, Dimo T, Cristol JP, Cros G, Azay J: Involvement of oxidative stress and NADPH oxidase activation in the development of cardiovascular complications in a model of insulin resistance, the fructose-fed rat.Atherosclerosis2005,179(1):43–49. 55. Johnson R, Segal M, Sautin Y, Nakagawa T, Feig D, Kang D-H, Gersch M, Benner
S, Sánchez-Lozada L:Potential role of sugar (fructose) in the epidemic of hypertension, obesity and the metabolic syndrome, diabetes, kidney disease, and cardiovascular disease.Am J Clin Nutr2007,86(4):899–906. 56. Ushijima K, Riby JE, Fujisawa T, Kretchmer N:Absorption of fructose by
isolated small intestine of rats is via a specific saturable carrier in the absence of glucose and by the disaccharidase-related transport system in the presence of glucose.J Nutr1995,125(8):2156–2164.
57. Merat S, Casanada F, Sutphin M, Palinski W, Reaven P:Western-type diets induce insulin resistance and hyperinsulinemia in LDL receptor-deficient mice but do not increase aortic atherosclerosis compared with normoin-sulinemic mice in which similar plasma cholesterol levels are achieved by a fructose-rich diet.Arterioscler Thromb Vasc Biol1999,19(5):1223–1230.
doi:10.1186/1475-2840-13-23