ALOHA Computer Code
Application Guidance for
Documented Safety Analysis
Final Report
U.S. Department of Energy
Office of Environment, Safety and Health
1000 Independence Ave., S.W.
Washington, DC 20585-2040
ii
iii FOREWORD
This document provides guidance to Department of Energy (DOE) facility analysts in the use of the ALOHA computer code for supporting Documented Safety Analysis applications.
Information is provided herein that supplements information found in the ALOHA documentation provided by the code developer. ALOHA is one of six computer codes
designated by DOE’s Office of Environmental, Safety and Health as a toolbox code for safety analysis.
Suggestions for corrections or improvements to this document should be addressed to – Chip Lagdon
EH-31/GTN
Office of Quality Assurance Programs U.S. Department of Energy
Washington, D.C. 20585-2040 Phone (301) 903-4218
iv
v
REVISION STATUS
Page/Section Revision Change
1. Entire Document 1. Final Draft for Review 1. Original Issue
2. Entire Document 2. Final Report 2. Updated all sections per review
vi
vii TABLE OF CONTENTS Section Page FOREWORD ... III REVISION STATUS... V EXECUTIVE SUMMARY ... XI 1.0 INTRODUCTION ... 1-1
1.1 BACKGROUND:OVERVIEW OF TOOLBOX SOFTWARE IN CONTEXT OF 10CFR830 ... 1-2 1.2 SCOPE... 1-3 1.3 PURPOSE... 1-3 1.4 APPLICABILITY... 1-3 2.0 SUMMARY DESCRIPTION OF THE ALOHA CODE ... 2-1 2.1 ALOHACODE DEVELOPMENT... 2-1 2.2 OVERVIEW OF ALOHAMODELS... 2-2 2.3 ALOHASOFTWARE QUALITY ASSURANCE... 2-5 3.0 APPLICABLE REGIMES... 3-1
3.1 OVERALL APPLICATION IN SAFETY ANALYSIS... 3-1 3.2 PHENOMENOLOGICAL REGIMES OF APPLICABILITY... 3-2 4.0 INPUTS AND RECOMMENDATIONS ... 4-1 4.1 OVERVIEW OF ALOHAINPUT MENUS... 4-1 4.2 INPUT RECOMMENDATIONS FOR SITE DATA PARAMETERS... 4-2 4.2.1 Location ... 4-2 4.2.2 Building Type ... 4-2 4.2.3 Date and Time... 4-3 4.3 INPUT RECOMMENDATIONS FOR SET UP PARAMETERS (SCENARIO DEFINITION) ... 4-3
4.3.1 Chemical Information ... 4-3 4.3.2 Atmospheric Options ... 4-5 4.3.3 Source ... 4-16 4.3.4 Computational Preferences ... 4-35 4.4 INPUT RECOMMENDATIONS FOR DISPLAY PARAMETERS... 4-36 5.0 SPECIAL CONDITIONS FOR USE ... 5-1 6.0 SOFTWARE LIMITATIONS ... 6-1
6.1 ALOHAISSUES... 6-1 6.2 OUTCOME OF GAP ANALYSIS... 6-6 7.0 SAMPLE CALCULATIONS: PUDDLE EVAPORATION... 7-1 8.0 ACRONYMS & DEFINITIONS... 8-1 9.0 REFERENCES ... 9-1
viii
APPENDIX A: ATMOSPHERIC TRANSPORT AND DISPERSION MODELS... A-1 Neutrally Buoyant Model ... A-1 Dense Gas Model... A-7 APPENDIX B: TORNADO DILUTION FACTOR... B-1 APPENDIX C: DEVELOPMENTAL HISTORY OF ALOHA... C-1
ix TABLE OF TABLES
Table Page
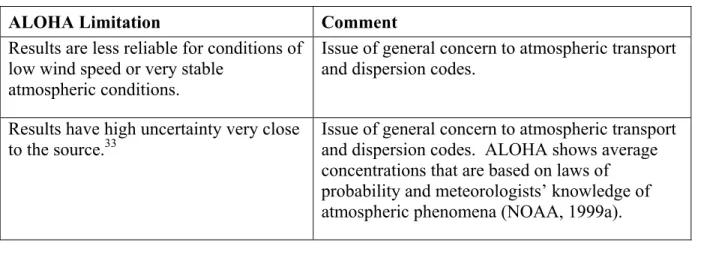
Table 4-1 Use of Chemical Property Data... 4-5 Table 6-1 ALOHA Limitations... 6-1
x TABLE OF FIGURES
Figure Page
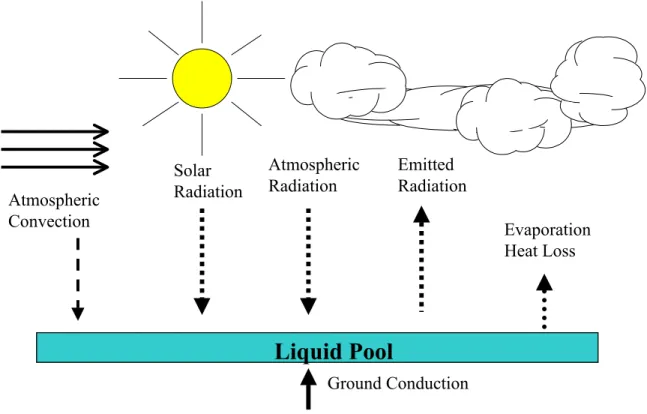
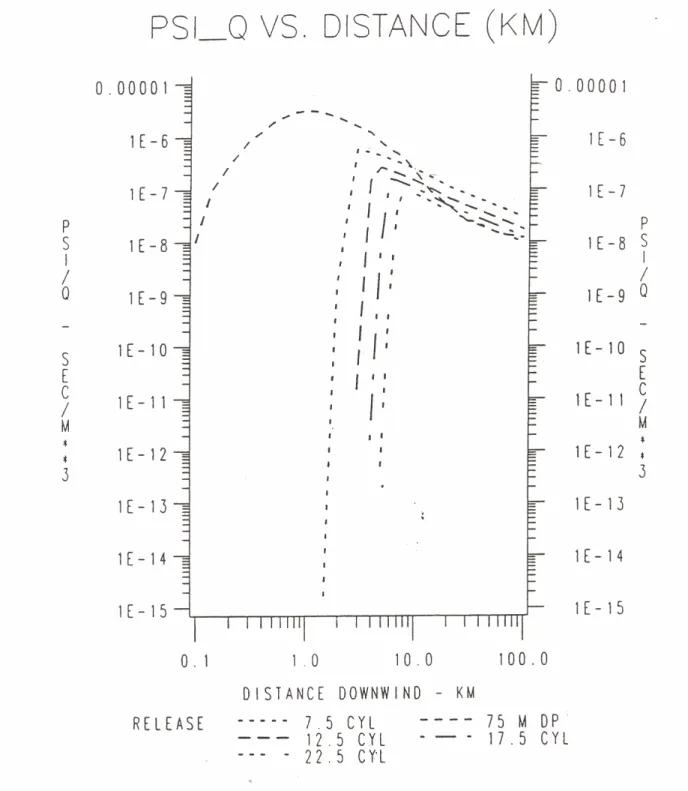
Figure 2-1. ALOHA Graphical Output... 2-5 Figure 4-1. ALOHA Menu Bar... 4-1 Figure 4-2. Sample ALOHA Dialog Box for Data Entry. ... 4-2 Figure 4-3. Heat Transfer Mechanisms with Puddle Source Configuration... 4-22 Figure B-1. The maximum time-integrated ground-level centerline air concentration (s/m3)
versus downwind distance (km) for different mean translational speeds from 7.5m/s to 22.5 m/s. The downdraft speed is 10 m/s and the height of the cylindrical mesocyclone is 3500 m (from Weber and Hunter, 1996). ... B-2
xi
ALOHA Computer Code Application Guidance for Support of
Documented Safety Analysis
EXECUTIVE SUMMARY
The Defense Nuclear Facilities Safety Board issued Recommendation 2002-1 on Quality Assurance for Safety-Related Software in September 2002. The Recommendation identified a number of quality assurance issues for software used in the Department of Energy (DOE) facilities for analyzing hazards, and designing and operating controls that prevent or mitigate potential accidents. The development and maintenance of a collection, or “toolbox,” of high-use, Software Quality Assurance (SQA)-compliant safety analysis codes is one of the major
commitments contained in Implementation Plan for Recommendation 2002-1 on Quality Assurance for Safety Software at Department of Energy Nuclear Facilities. In time, the DOE safety analysis toolbox will contain a set of appropriately quality-assured, configuration-controlled, safety analysis codes, managed and maintained for DOE-broad safety basis
applications (DOE, 2002b). The Areal Locations of Hazardous Atmospheres (ALOHA) code is one of the designated toolbox codes.
ALOHA may require some degree of quality assurance improvement before meeting current SQA standards. In the interim period before these changes are completed, ALOHA is still considered a useful asset in the support of safety basis calculations. To ensure appropriate application of the designated toolbox software, the Implementation Plan has committed to sponsoring a set of code-specific documents to guide informed use of the software, and supplement the available user’s manual information.
The ALOHA guidance report includes the following:
• Applicability information for DSA-type analysis, specifically tailored for DOE safety analysis
• Code development information and SQA background
• Appropriate regimes and code limitations
• Valid ranges of input parameters consistent with code capability and DOE safety basis applications, and
• Default input value recommendations for site-independent parameters.
Use of the information contained here, although not ensuring correct use of ALOHA in each analytical context, will minimize potential user errors and the likelihood of ALOHA use outside its regime of applicability.
xii
1-1 1.0 INTRODUCTION
In January 2000, the Defense Nuclear Facilities Safety Board (DNFSB) issued Technical Report 25, (TECH-25), Quality Assurance for Safety-Related Software at Department of Energy
Defense Nuclear Facilities (DNFSB, 2000). TECH-25 identified issues regarding the state of software quality assurance (SQA) in the Department of Energy (DOE) Complex for software used to make safety analysis decisions and to control safety-related systems. Instances were noted in which computer codes were either inappropriately applied or were executed with
incorrect input data. Of particular concern were inconsistencies in the exercise of SQA from site to site, and from facility to facility, and the variability in guidance and training in the appropriate use of accident analysis software.
During the subsequent 2000 to 2002 period, survey information on SQA programs, processes, and procedures was collected as well as the initial elements to a response plan. However, to expedite implementation of corrective actions in this area, the DNFSB issued Recommendation 2002-1, Quality Assurance for Safety-Related Software at Department of Energy Defense Nuclear Facilities (DNFSB, 2002). As part of its recommendation to the DOE, the DNFSB enumerated many of the points noted earlier in TECH-25, but noted specific concerns regarding the quality of the software used to analyze and guide safety-related decisions, the quality of the software used to design or develop safety-related controls, and the proficiency of personnel using the software.
DOE has developed a series of actions that address the Board’s concerns, contained in the Implementation Plan for the DNFSB Recommendation, Implementation Plan for Defense Nuclear Facilities Safety Board Recommendation 2002-1. Two of the actions include: (i) identification of a suite of accident analysis software that is widely used in the DOE
Complex, and
(ii) issuance of code-specific guidance reports on the use of the “toolbox” codes for DOE facility accident analysis, identifying applicable regime in accident analysis, default inputs, and special conditions for use.
Safety analysis software for the DOE “toolbox” status was designated by the DOE Office of Environment, Safety and Health (DOE/EH, 2003). The supporting basis for this designation was provided by a DOE-chartered Safety Analysis Software Group in a technical report entitled,
Selection of Computer Codes for DOE Safety Analysis Applications,
(https://www.hss.doe.gov/deprep/archive/rec/2002-1/NNSACCodes1.pdf), and includes version 5.2.3 of the Areal Locations of Hazardous Atmospheres (ALOHA) code.
It is believed that each code designated for the toolbox can be applied to accident analysis under the precautions and recommended input parameter ranges documented in the body of this report. This code-specific document will be maintained and updated until a minimum qualification software package is completed.
1-2 bring ALOHA into compliance with defined SQA standards. The primary objective of the guidance report is to provide information on the use of ALOHA for supporting DOE safety basis accident analysis. Specifically, the report contains:
• Applicability guidance for Documented Safety Analysis (DSA)-type analysis, specifically tailored for DOE safety analysis
• Appropriate regimes, recommended configurations
• Overcoming known vulnerabilities and avoiding code errors
• Valid ranges of input parameters consistent with code capability and DOE safety basis applications
• Default input value recommendations for site-independent parameters, and
• Citations of currently available SQA documentation.
Thus, this report is intended to complement existing ALOHA user’s documentation. The latter tends to be much broader in coverage of the full range of capabilities of ALOHA and the spectrum of inputs that might be needed depending upon the application, but lack cohesive and targeted guidance for particular applications such as DSA accident analyses. Furthermore, the goal of this document is to identify limitations and vulnerabilities not readily found in
documentation from the code developer or published elsewhere.
The ALOHA guidance document is written using the following set of sections. The first section contains an introduction and background providing an overview of toolbox software in the context of 10 CFR 830 (CFR, 2001). More information follows on the scope and purpose of this document. The next major section is a summary description of ALOHA. A third section
discusses applicable regimes for using ALOHA in performing accident analysis. A large section on default inputs and recommendations, emphasizing appropriate inputs for DOE applications, succeeds this section. Following this discussion are sections on special conditions for use of the software and software limitations. A sample case is then provided, followed by acronyms and definitions, references, and appendices.
1.1 Background: Overview of Toolbox Software in Context of 10 CFR 830
In the context of 10 CFR 830, the Nuclear Safety Management rule, the six computer codes designated by DOE/EH as toolbox software will be of appropriate pedigree for support of safety basis documentation. After completion of the minimum required SQA upgrade measures for a toolbox code, the safety analyst would still need to justify the specific application with the code of interest, input parameters, and user assumptions, but many SQA burdens would be reduced from current requirements. The user would need to reference the toolbox code and version, identify compliance with their organization’s SQA requirements and demonstrate that the code is being applied in theproper accident analysis context using appropriate inputs. The SQA
pedigree would be sufficiently established for technical review purposes since the code is recognized as toolbox-supported.
1-3
Only six codes out of more than one hundred software packages applied in the DOE Complex for accident analysis purpose have been designated as “toolbox” codes (DOE, 2002b). Other non-toolbox, dispersion and consequence software can still be applied in the context of support safety basis applications. However, each organization applying this category of software will need to demonstrate compliance with applicable SQA criteria, such as those applied to the toolbox software.
1.2 Scope
The ALOHA guidance report includes the following:
• Applicability information for DSA-type analysis, specifically tailored for DOE safety analysis
• Code development information and SQA background
• Appropriate regimes and code limitations
• Valid ranges of input parameters consistent with code capability and DOE safety basis applications, and
• Default input value recommendations for site-independent parameters. 1.3 Purpose
The ALOHA code, while part of the toolbox collection of software, still may require SQA upgrades prior to meeting current established standards for software. However, until these SQA upgrades are completed so that ALOHA meets current established standards for software, ALOHA can be applied safely by following the guidance contained in this report. Once SQA upgrades are finalized with ALOHA, it will be brought under configuration control and placed in the toolbox.
Use of the information contained here, although not ensuring correct use of ALOHA in all analytical contexts, will minimize potential user errors and the likelihood of use outside regimes of applicability.
1.4 Applicability
Even though ALOHA was developed as a tool for emergency response and emergency
preparedness/planning, it is also widely used throughout the DOE complex to support 10 CFR 830 safety analysis. Note that this guidance document does not specifically address application issues related to emergency response or emergency preparedness/planning.
It is recognized that other computer codes besides ALOHA exist that perform similar source term and downwind concentration calculations. Moreover, manual or electronic spreadsheet calculations can be a viable alternative to using a computer code for many accident analysis
1-4 applications that involve chemical spills. The relative merits of using a different computer program or using a hand calculation for a given application is a judgment that must be made by the analyst on a case-by-case basis.
The U.S. Department of Energy (DOE) has provided guidance and general recommendations in this area through the Accident Phenomenology and Consequence (APAC) Methodology
Evaluation Program. As part of this program, the Chemical Dispersion and Consequence Assessment (CDCA) Working Group (WG) was established to address issues and evaluate methodologies in the CDCA domain. Other WGs were also established for other domains of safety analysis (i.e., fire analysis, explosion analysis, spill source term analysis, in-facility transport analysis, and radiological dispersion and consequence assessment). The CDCA WG (also referred to as WG 6) issued a report that identifies and evaluates methodologies and computer codes to support CDCA applications (Lazaro, 1997). Also of interest is the WG 3 report, which performed a similar function for source term analysis of spills (Brereton, 1997). The CDCA WG 6 report identified the ALOHA computer code as a recommended code that is “applicable to generally broad safety basis documentation applications.” The ALOHA code was similarly recommended by the Spills WG 3 report. In addition to code recommendations, both the Spills WG 3 report and the CDCA WG 6 report also provide a broad set of recommended “best practices” for modeling chemical releases to the atmosphere for safety analysis
applications.
This report builds upon the WG 3 and WG 6 work to provide guidance and recommendations that are targeted to the use of the ALOHA code to calculate source terms and downwind concentrations for safety analysis applications.
2-1
2.0 SUMMARY DESCRIPTION OF THE ALOHA CODE
This section provides a summary form description of the ALOHA. A brief overview is given with additional information to follow in other sections and appendices of the report to provide more in-depth coverage of topics such as the principles of source term development for analysis of accidents that involve chemical inventories, the interface with dispersion conditions in the atmosphere, and the overall assessment of toxicological exposure to receptors.
2.1 ALOHA Code Development
The current version (as of January 2004) of the ALOHA code is version 5.2.3, was released in 1999.1 ALOHA is a public domain code that is part of a system of software that is known as the Computer-Aided Management of Emergency Operations (CAMEO) that was developed to plan for and respond to chemical emergencies. It is also widely used throughout the DOE complex for safety analysis applications, which is the focus of this document. The United States Environmental Protection Agency (EPA), through its Chemical Emergency Preparedness and Prevention Office (CEPPO), and the National Oceanic and Atmospheric Administration (NOAA) Office of Response and Restoration jointly sponsor ALOHA. ALOHA can be
downloaded free of charge from the EPA website (http://www.epa.gov/ceppo/cameo/aloha.htm). An accompanying user’s manual can also be obtained at the website (NOAA, 1999a). An online help is also built into the code and a technical staff is available to address user questions (NOAA, 1999b).
The ALOHA code has evolved over the years to add capabilities, improve algorithms, and correct errors. Appendix C contains a reproduction of website information on the developmental history of the ALOHA code from the early 1980s to the present.
(http://response.restoration.noaa.gov/cameo/alohafaq/history.html).
ALOHA runs either on Macintosh or in Microsoft WindowsTM (version 95 or later) on IBM-compatible personal computers. ALOHA requires a least 1 megabyte (MB) of RAM and about 2.5 MB of hard disk space.
Information sources for the technical details of the ALOHA algorithms are from the ALOHA User’s manual (NOAA, 1999a), the online help with ALOHA 5.2.3 (NOAA, 1999b), the APAC WG reports (Brereton, 1997; Lazaro, 1997), a NOAA report (Evans, 1993) and a draft NOAA theoretical description memorandum (for ALOHA 5.0) (Reynolds, 1992). Information from ALOHA websites is also used:
• http://www.epa.gov/ceppo/cameo/instruct.htm
• http://www.nwn.noaa.gov/sites/hazmat/cameo/aloha.html
• 1 A new version of ALOHA, namely ALOHA 5.3, was released in March 2004 just prior
2-2
• http://response.restoration.noaa.gov/cameo/aloha.html
Whenever possible, an attempt was made to verify any information that was in the draft NOAA theoretical description memorandum through use of the others sources of information.
2.2 Overview of ALOHA Models
ALOHA performs calculations for chemical source terms and resulting downwind
concentrations. Source term calculations determine the rate at which the chemical material is released to the atmosphere, release duration, and the physical form of the chemical upon release.2 The term cloud is used in this document to refer to the volume that encompasses the chemical emission. In general, the released chemical may be a gas, a vapor, or an aerosol. The aerosol release may consist of either solid (e.g., fume, dust) or liquid (e.g., fog, mist, spray) particles that are suspended in a gas or vapor medium. 3 Liquid particles are also referred to as droplets. The analyst specifies the chemical and then characterizes the initial boundary conditions of the chemical with respect to the environment through the source configuration input. The ALOHA code allows for the source to be defined in one of four ways (i.e., direct source, puddle source, tank source, or pipe source) in order to model various accident scenarios. The source
configuration input is used to either specify the chemical source term or to provide ALOHA with the necessary information and data to calculate transient chemical release rates and physical state of the chemical upon release. ALOHA calculates time-dependent release rates for up to 150 time steps (NOAA, 1999a). ALOHA then averages the release rates from the individual time steps over one to five averaging periods, each lasting at least one minute (NOAA, 1999a). The five averaging periods are selected to most accurately portray the peak emissions. The five average release rates are inputs to the ALOHA algorithms for atmospheric transport and dispersion (NOAA, 1999a). ALOHA tracks the evolution of the mean concentration field of the five
2 More sophisticated source term algorithms found in some other computer codes will also model the energetic effects of the release (e.g., as would occur with a fire or explosion) to include the impact of the initial momentum and buoyancy. ALOHA ignores these effects that can lead to initial puff or plume rise, which is sometimes modeled through an effective, elevated release height. The ALOHA approach of ignoring initial puff or plume rise is conservative in accident analysis applications since the ground-level concentration will be less with an elevated release with respect to a ground-level release when plume depletion from deposition effects are ignored, as is done in ALOHA.
3 The ALOHA code user’s manual cautions that the ALOHA code does not model particulate transport phenomena (e.g., gravitational settling). Generally, particulate transport phenomena can be ignored with little error, but it is up to the analyst to make a determination of whether a passive atmospheric transport or dense-gas transport model is most appropriate. ALOHA has both models, and information in this document will provide guidance on their use. In the case of low concentrations of very fine airborne particles, it is reasonable to neglect transport phenomena peculiar to particulate and to assume that the particles remain suspended and act as a passive scalar contaminant that follows the flow field (Hanna, 2002). Under high concentrations of particles, the density of the cloud may be high enough that dense gas transport phenomena may be important.
2-3 separate chemical clouds and calculates the concentration at a given time and location through superimposition. ALOHA limits releases to one hour.
Evolution of the mean concentration field of the chemical cloud is calculated through algorithms that model turbulent flow phenomena of the atmosphere. The prevailing wind flows and
associated atmospheric turbulence serve to transport, disperse4, and dilute the chemical cloud that initially forms at the source. For an instantaneous release or release of short duration, the chemical cloud will travel downwind as a puff. In contrast, a plume will form for a sustained or continuous release.
The wind velocity is a vector term defined by a direction and magnitude (i.e., wind speed). The wind direction and wind speed determine where the puff or plume will go and how long it will take to reach a given downwind location. For sustained or continuous releases, the wind speed has the additional effect of stretching out the plume and establishing the initial dilution of the plume (i.e., determines the relative proportion of ambient air that initially mixes with the chemical source emission). Atmospheric turbulence causes the puff or plume to increasingly mix with ambient air and grow (disperse) in the lateral and vertical direction as it travels downwind. Longitudinal expansion also occurs for a puff. These dispersion effects further enhance the dilution of the puff or plume. The two sources of atmospheric turbulence are mechanical turbulence and buoyant turbulence. Mechanical turbulence is generated from shear forces that result when adjacent parcels of air move at different velocities (i.e., either at different speeds or directions)5. Fixed objects on the ground such as trees or buildings increase the ground roughness and enhance mechanical turbulence in proportion to their size. Buoyant turbulence arises from vertical convection and is greatly enhanced by the formation of thermal updrafts that are generated from solar heating of the ground.
The ALOHA code considers two classes of atmospheric transport and dispersion based upon the assumed interaction of the released cloud with the atmospheric wind flow.
• For airborne releases in which the initial chemical cloud density is less than or equal to that of the ambient air, ALOHA treats the released chemical as neutrally buoyant.6 A neutrally
4 The term dispersion is sometimes used in the literature to describe the combined effects of advection (transport by the bulk motion of the wind flow) and turbulent diffusion (spreading) and other times, particularly in meteorological publications, to describe only the turbulent diffusion component. The latter, narrower sense is used in this document.
5 Atmospheric flows experience a change in speed with height due to the friction of the earth’s surface in slowing down the wind adjacent to it.
6 In the strictest sense, neutrally buoyant conditions exist when the density difference between the
released chemical cloud and ambient air is small. A positively buoyant cloud is produced when the cloud density is significantly less than that of the ambient air. The positive buoyancy induces puff or plume rise that results in an effective elevated release. The ALOHA code does not account for these positive
buoyancy effects, but instead models the release as neutrally buoyant. This approach is conservative in accident analysis applications since the ground-level concentration will be less with an elevated release with respect to a ground-level release.
2-4 buoyant chemical cloud that is released to the atmosphere does not alter the atmospheric wind flow, and therefore, the term passive is used to describe the phenomenological characteristics associated with its atmospheric transport and dispersion. As a passive contaminant, the released chemical follows the bulk movements and behavior of the atmospheric wind flow.
• Conversely, if the density of the initial chemical cloud is greater than that of the ambient air, then the possibility exists for either neutrally buoyant or dense-gas type of atmospheric transport and dispersion.7 In dense-gas atmospheric transport and dispersion, the dense-gas cloud resists the influences of the hydraulic pressure field associated with the atmospheric wind, and the cloud alters the atmospheric wind field in its vicinity. Dense-gas releases can potentially occur with gases that have a density greater than air due to either a high molecular weight or being sufficiently cooled. A chemical cloud with sufficient aerosol content can also result in the bulk cloud density being greater than that of the ambient air. Dense-gas releases undergo what has been described in the literature as “gravitational slumping”. Gravitational slumping is characterized by significantly greater lateral (crosswind) spreading and reduced vertical spreading as compared to the spreading that occurs with a neutrally buoyant release.
Appendix A contains a more in-depth discussion of the neutrally buoyant model and the dense gas model that are used in ALOHA for atmospheric transport and dispersion calculations. In addition to the source term and downwind concentration calculations, ALOHA allows for the specification of concentration limits for the purpose of consequence assessment (e.g., assessment of human health risks from contaminant plume exposure). ALOHA refers to these concentration limits as level-of-concern (LOC) concentrations. Safety analysis work uses the Emergency Response Planning Guidelines (ERPGs) and Temporary Emergency Exposure Limits (TEELs) for assessing human health effects for both facility workers and the general public (Craig, 2001). While ERPGs and TEELs are not explicitly a part of the ALOHA chemical database8, ALOHA allows the user to input any value, including an ERPG or TEEL value, as the LOC concentration. The LOC value is superimposed on the ALOHA generated plot of downwind concentration as a function of time to facilitate comparison. In addition, ALOHA will generate a footprint that shows the area (in terms of longitudinal and lateral boundaries) where the ground-level
concentration reached or exceeded the LOC during puff or plume passage (the footprint is most useful for emergency response applications) (Figure 2-1).
7 ALOHA uses the terminology heavy gas in place of dense gas.
8 The ALOHA chemical database incorporates two sets of concentration limits that are used in the
chemical industry to address worker safety issues: (1) immediately dangerous to life or health (IDLH) and (2) threshold limit value – time weighted average (TLV-TWA). Note that ALOHA 5.3 that was released in March 2004 just prior to the issuance of this report does have ERPGs and TEELs as part of the chemical database.
2-5 Figure 2-1. ALOHA Graphical Output.
2.3 ALOHA Software Quality Assurance
The validation and verification (V&V) efforts for ALOHA are not formally documented and do not appear to be part of a systematic quality assurance (SQA) plan (DNFSB, 2000). Some SQA information can be found in a document that is posted on the NOAA website (NOAA, 1998) and in a draft quality assurance report (Evans, 1994) as summarized below. Benchmark comparisons have been made with the results from the ARCHIE (FEMA, 1989) and CHEMS-PLUS (Little, 1988) computer models. Comparisons with field data were also made with the following results reported (NOAA, 1998; Evans, 1994).
• Source term prediction for non-boiling pool evaporation – All ALOHA predictions were within 42% of measured evaporation rates.
• Source term prediction for liquefied propane – About 83% of ALOHA predictions were within a factor of two of measured vaporization rates.
• Atmospheric transport and dispersion predictions with Gaussian model – ALOHA predictions of mean downwind concentrations tended to underestimate measured field
2-6
concentrations at distances of 200 meters or more and overestimate concentrations closer in.
• Atmospheric transport and dispersion predictions with dense-gas model for releases of ammonia, liquefied petroleum gas, liquefied natural gas, and dinitrogen tetroxide – ALOHA predictions were not compared directly with field measurements, but compared with results from the DEGADIS model that was calibrated to 12 trials from field
experiments (Spicer, 1989). About 70% of DEGADIS predictions were within a factor of two of measured field concentrations. ALOHA predictions of mean downwind
concentrations were on average conservative with respect to DEGADIS predictions.
• Atmospheric transport and dispersion predictions with dense-gas model for hydrogen fluoride (HF) releases –ALOHA predictions of mean downwind concentrations were on average 48% of the measured field data.
3-1
3.0 APPLICABLE REGIMES
The objective of this section is to present a discussion of ALOHA applicability from two
perspectives: (1) in terms of its overall function as a key step in accident analysis; and (2) noting the phenomenological regimes in which it provides an approximate model of dispersion in the environment and the resulting toxicological exposure to downwind individuals (receptors). 3.1 Overall Application in Safety Analysis
The ALOHA code is designated for the toolbox under the area of applicability of chemical release and dispersion and consequence assessment. A code of this type of is used primarily to calculate the release rate to the atmosphere of a chemical involved in an accident scenario and the resulting instantaneous or time-averaged concentration of a chemical downwind from the accident. Because the DOE does not have an evaluation guideline for chemicals, the chemical concentration calculated is not used to distinguish safety-class designation for systems,
structures, and components. A typical use of chemical consequence results is to confirm the selection of safety significant systems, structures, and components for worker protection. Occasionally, chemical concentrations are used to help set limits on chemical inventory, and this may present more of a safety implication. When these code calculations are used to help set inventory limits, they have a direct effect on values used in technical safety requirements, and the quality of the calculation may be very important. Again, it is important to note that a hand calculation can often be used to verify this value.
In this context of setting limits on chemical inventory, analysts have generally applied the American Industrial Hygiene Association (AIHA) ERPGs9 and TEELs 10 for the purpose of
9 The American Industrial Hygiene Association (AIHA) has issued three levels of ERPG values based on toxic effect of the chemical for use in evaluating the effects of accidental chemical releases on the general public (AIHA, 2002). The ERPGs are estimates of concentrations for specific chemicals above which acute exposure (up to 1 hour) would be expected to lead to adverse health effects of increasing severity for ERPG-1, ERPG-2, and ERPG-3. The definitions of each ERPG level in terms of toxic effects are as follows (AIHA, 2002).
ERPG-1: The maximum airborne concentration below which it is believed nearly all individual could be exposed for up to 1 hour without experiencing more than mild, transient health effects or without perceiving a clearly defined objectionable odor.
ERPG-2: The maximum airborne concentration below which it is believed nearly all individual could be exposed for up to 1 hour without experiencing or developing irreversible or serious health effects or symptoms that could impair an individual’s ability to take protective action.
ERPG-3: The maximum airborne concentration below which it is believed nearly all individual could be exposed for up to 1 hour without experiencing or developing life-threatening health effects.
3-2 assessing human health effects for both facility workers and the general public (Craig, 2001). Recently, another alternative has become available to analysts. The National Advisory Committee for Acute Exposure Guideline Levels for Hazardous Substances (NAC/AEGL Committee) has been developing acute exposure guideline levels (AEGLs) to assist federal and state agencies and private sector organizations with their need for short-term hazardous chemical exposure information in terms of five emergency exposure periods (10 and 30 min, 1 h, 4 h, and 8 h).11
Since the DOE has not provided definitive evaluation guidelines for chemical exposures for use in DSAs, the specific use of ERPGs, TEELs, and AEGLs in accident analysis remains largely an open issue. It is recommended that guidance from subject-matter experts be followed (Craig, 2001). In some cases, surrogate values for inventory limits (such as EPA or OSHA limits) can also be used.
3.2 Phenomenological Regimes of Applicability
The atmospheric transport and dispersion algorithms of ALOHA are based on Gaussian and dense-gas models. These models are best suited for specific types of conditions. The chief phenomenological regimes for applying ALOHA include:
10 The temporary emergency exposure limits (TEELs) are another set of chemical-specific concentrations that correspond to varying levels of health effects (Craig, 2001). TEELs have been developed since ERPGs are available only for a limited number of chemicals. The TEELs consist of (a) ERPG values for all chemicals for which ERPGs have been published and surrogate ERPG values for chemicals for which ERPGs have not been published (i.e., the TEEL-1, -2, and -3 values), and (b) Permissible Exposure Limit - TWA (PEL-TWA) values for all chemicals for which PEL-TWA values have been published and surrogate PEL-TWA values for additional chemicals (i.e., the TEEL-0 values) (Craig, 2001). PEL-TWA values are developed by the Occupational Safety & Health Administration (OSHA) for use in limiting worker exposures to airborne chemicals (CFR, 1999). Most people are not expected to experience any adverse health effects to accident exposures at the TEEL-0 level (Craig, 2001).
11 The National Advisory Committee for Acute Exposure Guideline Levels for Hazardous Substances (NAC/AEGL Committee) is developing AEGLs in terms of five emergency exposure periods (10 and 30 min, 1 h, 4 h, and 8 h) and three severity levels as defined below:
AEGL-1: airborne concentration of a substance above which it is predicted that the general population, including susceptible individuals, could experience notable discomfort, irritation, or certain asymptomatic nonsensory effects. However, effects are not disabling and are transient and reversible upon cessation of exposure.
AEGL-2: airborne concentration of a substance above which it is predicted that the general population, including susceptible individuals, could experience irreversible or other serious, long-lasting adverse health effects or an impaired ability to escape.
AEGL-3: airborne concentration of a substance above which it is predicted that the general population, including susceptible individuals, could experience life-threatening health effects or death.
3-3
• Temporal regime – These models are best suited for “short” duration plumes, ranging from approximately several minutes to several hours (ALOHA limits the duration to one hour).
• Spatial regime - These models have high uncertainty close to the source, especially where the influence of structures or other obstacles is still significant. Dispersion influenced by several, collocated facilities, within several hundred meters of each other should be modeled with care. Similarly, ALOHA imposes a downwind distance limit of ten kilometers (six miles). The rationale behind the distance limit of ten kilometers and the one-hour time limit that is noted above is that meteorological conditions are likely to vary with location and change after significant passage of time. Long-range projections of toxicological exposures are better calculated with mesoscale, regional models that are able to account for multiple weather observations.
• Terrain variability – These models are inherently flat-earth models, and perform best over regions of transport where there is minimal variation in terrain.
• Extreme weather – These models do not apply to extreme weather conditions such as tornadoes.
4-1
4.0 INPUTS AND RECOMMENDATIONS
4.1 Overview of ALOHA Input Menus
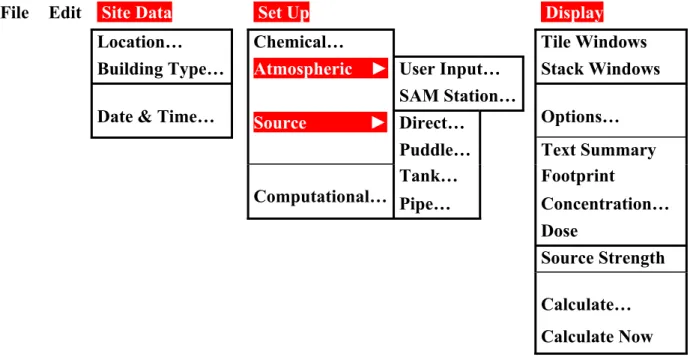
Users of ALOHA enter input data mainly through two menus that are labeled “Site Data” and “Set up” on the menu bar (Figure 4-1). Preliminary information about the location of the accidental release and date and time are entered through a series of dialog boxes that are
accessed through the Site Data menu. The chemical that is released and the initial and boundary conditions associated the postulated accident scenario are input through a series of dialog boxes that are accessed through the Set up menu. In addition, an ERPG or TEEL value can be entered as the LOC value under the menu labeled “Display” (“Options” submenu) or alternatively saved as the default LOC in the chemical library.
File Edit Site Data Set Up Display
Location… Chemical… Tile Windows
Building Type… Atmospheric ► User Input… Stack Windows
SAM Station…
Date & Time… Source ► Direct… Options…
Puddle… Text Summary
Tank… Footprint
Computational… Pipe… Concentration…
Dose
Source Strength
Calculate…
Calculate Now
Figure 4-1. ALOHA Menu Bar.
For each numerical input, ALOHA typically allows for a variety of units (both metric and British) to be used. The user must therefore identify the particular units to be used among those offered by ALOHA and input the numerical value on the basis of the units that have chosen for the given input parameter. Frequently, an ALOHA dialog box presents one or more pre-defined options that the user may select through the use of selection bubbles, but generally the user is not limited to these options as a space for numerical values to be input as an alternative is usually available (Figure 4-2).
4-2 Figure 4-2. Sample ALOHA Dialog Box for Data Entry.
4.2 Input Recommendations for Site Data Parameters The following submenus are included under the Site Data menu:
• Location
• Building Type
• Date and Time
4.2.1 LOCATION
More than 500 U.S. cities as well as some Canadian cites are part of the ALOHA library. The library includes the elevation, longitude, and latitude of each city. The longitude and latitude, along with the time and date inputs that are discussed later, are used to estimate the incoming solar radiation (Reynolds, 1992). The amount of incoming solar radiation on a puddle influences the evaporation rate. ALOHA uses the elevation input to determine ambient air pressure
(Reynolds, 1992).
Recommendation: Choose the city in closest proximity to the location of interest or add a new city to the library by entering its name along with the elevation, longitude, and latitude of the city.
4.2.2 BUILDING TYPE
Building parameters related to infiltration are entered through the dialog box under the Building Type submenu. Choices for the building type are (i) enclosed office building, (ii) single storied
4-3 building, or (iii) double storied building. The user selects one the above three choices or
alternatively enters the number of air changes per hour (allowable range is 0.01 to 60 exchanges per hour) (NOAA, 1999b). The user also identifies the building surroundings as either sheltered (with trees, bushes, etc.) or unsheltered.
Recommendation: ALOHA uses the information entered here to determine indoor infiltration and to estimate indoor concentration and chemical dose at a location. ALOHA assumes that all doors and windows are closed. DSA analysis conservatively takes no credit for sheltering or evacuation. As a result, safety analysts do generally not use the indoor concentration and chemical dose calculated by ALOHA.
4.2.3 DATE AND TIME
The user is provided with the option to use either the internal clock or set a constant time and date. Time is based on a 24-hour clock. ALOHA uses this input, along with the location data, to determine the incoming solar radiation based upon the position of the sun.
Recommendation: Set a constant time that is consistent with the input specification for the atmospheric stability class (discussed in a later section). For example, stable atmospheric conditions occur at night or early morning. Unstable atmospheric conditions occur during the day. Neutral atmospheric conditions can occur either at day or night. For analysis of a daytime release, the evaporation rate increases with increasing solar influx. A conservative approach for unstable and neutral atmospheric conditions is to set the date to a mid-summer day (e.g., June 30th) and the time to around noon (e.g., 12:00). Any year may be specified since the results can be expected to be insensitive to the year input (ALOHA, however, will prompt the user to check his entry if the year is more than 10 years away from the current year).
4.3 Input Recommendations for Set Up Parameters (Scenario Definition) The following submenus are included under the Set Up menu:
• Chemical Information
• Atmospheric Options
• Source
• Computational Preferences
4.3.1 CHEMICAL INFORMATION
Over 1000 chemicals are part of the chemical library.
Recommendation: Choose chemical of concern from chemical library list or enter new chemical into library. An ALOHA dialog box will prompt the user to enter the following information for the new chemical.
4-4
• Molecular weight
• Boiling point
• Critical pressure
• Critical temperature
• Default level of concern
• Density (gas)
• Density (liquid)
• Diffusivity (molecular)
• Freezing point (normal)
• Heat capacity (gas, constant pressure)
• Heat capacity (liquid, constant pressure)
• IDLH
• TLV-TWA
• Vapor pressure
Information on what properties are required to support each source configuration option and atmospheric transport and dispersion type is given in Table 4-1 (NOAA, 1999a).
4-5 Table 4-1 Use of Chemical Property Data
Property Direct Source Puddle Source Tank Source Pipe Source
Gaussian Heavy Gas Gaussian Heavy Gas Gaussian Heavy Gas Gaussian Heavy Gas Chemical Name
•
•
•
•
•
•
•
•
Molecular Weight•
•
•
•
•
•
•
•
Boiling Point•
1•
•
•
•
•
•
•
Critical Pressure•
1•
2•
•
•
•
•
•
Critical Temperature•
1•
2•
•
•
•
•
•
Gas Density•
•
•
•
Freezing Point•
•
•
•
Gas Heat Capacity•
•
•
•
•
•
•
Liquid Heat Capacity•
•
•
•
Vapor Pressure•
21 Required only if direct source term is expressed in volume or volume rate units. That is, these properties are not required if source term is expressed in mass or mass rate units.
2 Either the vapor pressure is required or both the critical pressure and critical temperature is required.
4.3.2 ATMOSPHERIC OPTIONS
ALOHA allows meteorological conditions to be entered from a portable monitoring station. For accident analysis purposes, however, the user enters the meteorological data manually. Note that ALOHA does not handle extreme weather conditions such as tornadoes Appendix B
summarizes an approach that has been used at Savannah River Site for tornadoes. ALOHA requires input for the following meteorological parameters.
• Wind speed
4-6
• Measurement height of wind speed
• Ground roughness • Cloud cover • Air temperature • Stability class • Inversion height • Humidity
In calculating puff or plume concentrations, both “unfavorable” and “typical” dispersion
conditions are of special interest in accident analyses. For accident analysis consideration of the offsite receptor, unfavorable meteorology is ideally based on site data. In defining unfavorable meteorological conditions for chemical releases, it seems reasonable to follow the practices that are used for radiological consequence analysis. Unfavorable meteorology refers to the
meteorology that coupled with the source term would lead to doses (or concentration exposures for chemicals) that are exceeded less than five percent of the time. The method should be conservative or consistent to the discussion in the NRC Regulatory Guide 1.145 (Position 3) (NRC, 1983) as summarized in Appendix A to DOE-STD-3009-94, CN2 (DOE, 2002a). The 95th percentile result of the distribution of doses (or concentration exposures for chemicals) to the offsite receptor, accounting for variation in distance to the site boundary as a function of direction, is generally the consequence result of interest. The median or the 50th percentile result of the consequence distribution is usually the basis for typical meteorological conditions. The determination of the meteorological conditions that correspond to 50th and 95th percentile consequence results will require the simultaneous consideration of both atmospheric stability class and wind speed (the effect of ambient temperature on chemical vapor pressure may also be considered for scenarios that involve pool evaporation).
Meteorological variables such as wind speed and solar radiation affect both the evaporation rate and the amount of dilution of the puff or plume during atmospheric transport. Generally, these variables affect the evaporation rate and atmospheric dilution in opposite ways with regard to the effect produced on downwind concentrations. For example, higher wind speeds increase the evaporation rates, but also support greater dilution of the plume. Similarly, higher solar radiative influx and warmer temperatures also increase the evaporation rates, but typically support
atmospheric conditions that are less stable and more dispersive. Meteorologists at Savannah River Site (SRS) studied these effects and concluded that the dominant influence of the meteorological variables generally occurs with atmospheric dispersion and dilution (Hunter, 1993). Higher downwind concentrations are associated with stable atmospheric conditions and low wind speeds (Hunter, 1993).
The size of the data set used in the meteorological assessments should be sufficiently large that it is representative of long-term meteorological trends at most sites. Meteorological data, qualified and meeting requirements of Regulatory Guide 1.23 (NRC 1972), available at most DOE sites
4-7
should be applied that is representative of long-term trends. A five-year data set is desirable, but a one-year data set can be applied under the right circumstances.12
In lieu of site-specific meteorology, the accident analysis may use generally accepted, default stability and wind speed combinations. For example, F stability class and 1.5 m/s wind speed is recommended by the EPA for analysis of ground-level releases of neutrally buoyant plumes (EPA, 1999). See Appendix A for a fuller discussion on the role of wind speed and atmospheric stability class on downwind puff or plume concentrations, especially as these parameters relate to the Gaussian transport and dispersion models for neutrally buoyant releases. For elevated
releases, the lofted plume must travel further downwind with stable atmospheric conditions before reaching the ground and exposing receptors to the hazardous contaminant. Therefore, neutral or even unstable stability conditions may produce the most unfavorable meteorological conditions for receptors close to the elevated release.
It should be noted that in the long run, site data is normally preferable over the default conditions for accident analysis. Meteorologists evaluated SRS data and found the conditions associated with 95th percentile results varied with release height, and receptor distance (Hunter, 1993). For most facility distances to the offsite boundary, it was determined for neutrally buoyant plumes that 95th percentile results correspond to conditions of E stability and the following wind speeds.13
• 1.7 m/s wind speed (release height 0 m – 10 m)
• 2.1 m/s wind speed (20-m release height), and
• 3.0 m/s wind speed (60-m release height).
Finally, note that the specification of the atmospheric stability class in ALOHA should be consistent with inputs for location, date and time, wind speed, surface roughness length, and cloud cover. Algorithms are used within ALOHA to inform the user of which atmospheric stability classes are consistent with other data that the user has entered for these parameters. Guidance for each meteorological parameter required by ALOHA follows.
Wind Speed
ALOHA accepts 10-m reference elevation wind speeds in the range of 1 m/s to 60 m/s (NOAA, 1999b). ALOHA can accommodate wind speed values that are representative of other heights since inputs are required for both the wind speed and the corresponding height for this wind
12 In Regulatory Guide 1.194, this subject is discussed as follows: “The NRC staff considers five
years of hourly observations to be representative of long-term trends at most sites. With sufficient justification of its representativeness, the minimum meteorological data set is one complete year (including all four seasons) of hourly observations.” (NRC, 2003)
13 The cited wind speeds reflect the value at the release height (at 10 m for the 0 m – 10 m release height range).
4-8
speed. The height input parameter for the wind speed is discussed separately in a later section of this document.
Recommendation: As discussed above, statistical analysis of site-specific, wind speed measurements is the preferred approach for specifying wind speed. The determination of the meteorological conditions that correspond to the 50th and 95th percentile consequence results will require the simultaneous consideration of both atmospheric stability class and wind speed
(ambient temperature may also be considered for scenarios that involve pool evaporation). In general, higher downwind concentrations (i.e., unfavorable meteorological conditions) are associated with lower wind speeds. In lieu of site-specific meteorological data, the following default wind speeds may be considered for each atmospheric stability class (Lazaro, 1997). More discussion of the interplay between wind speed and atmospheric stability in establishing typical and unfavorable meteorological conditions is presented later in the context of the input for atmospheric stability class. Also, performing a parametric study among the various
combinations of wind speed and atmospheric stability classes can provide useful insights about the role of wind speed and atmospheric stability class in determining unfavorable meteorological conditions.
Atmospheric Stability Class
A B C D E F
Default Wind Speed [m/s] 2.0 * * 4.5 1.5 1.5
* Lazaro (1997) does not specify default wind speeds for B and C stability classes. The 2.0 m/s default wind speed value that is specified for A stability class would seem to be a reasonably conservative choice based on information presented later in this section, as well as in Appendix A, for atmospheric stability class and wind speed.
Wind Direction
The wind direction is specified as the direction from which the wind is blowing. This
information is entered in either units of degrees true, or in one- to three-letter directional terms. For example, the wind blowing from the north-northeast is indicated by entering either NNE or 22.5 degrees.
Wind directions expressed in degrees and letter terms correspond as follows:
• N = 0 degrees or 360 degrees • NNE = 22.5 degrees • NE = 45 degrees • ENE = 67.5 degrees • E = 90 degrees • ESE = 112.5 • SE = 135 degrees
4-9 • SSE = 157.5 degrees • S = 180 degrees • SSW = 202.5 degrees • SW = 225 degrees • WSW = 247.5 degrees • W = 270 degrees • WNW = 292.5 degrees • NW = 315 degrees • NNW = 337.5 degrees
Recommendation: For accident analysis calculations, any direction may be input. The calculated concentrations for a given downwind distance that are calculated by ALOHA are insensitive to direction input.
Measurement Height for Wind Speed
ALOHA accounts for the variation of wind speed with distance from the earth’s surface as caused by friction. Therefore, ALOHA needs the height that is associated with the wind speed that is entered. From discussions with ALOHA technical staff, the atmospheric transport and dispersion calculations of ALOHA are based on either the wind speed at the release height or at 3 meters for release heights of 3 meters or less.
Recommendation: The input for this parameter must be consistent with the value that is input for the wind speed (that was discussed in a previous section above). If the value for wind speed input into ALOHA is based on site measurements at a known height, then that height should be input. Generally, portable weather monitoring stations are mounted approximately 3 meters high. Typically, the NWS measures and reports wind speeds at 10 meters. When using the generally accepted, default combination of F stability class and 1.5 m/s wind speed or the equivalent for analysis of ground-level releases of neutrally buoyant plumes, specifying a 10-meter measurement height is expected to yield a more conservative result than that obtained from specifying a 2-meter measurement height. With a 10-meter measurement height specification, ALOHA will calculate a wind speed at 2 meters that is less than 1.5 m/s for use in the Gaussian plume model, and the Gaussian plume model predicts downwind concentrations that are
inversely proportional to wind speed as shown in Appendix A. Ground Roughness
ALOHA accepts input of “open country” or ”urban or forest” to characterize the surface roughness. Alternatively, ALOHA accepts input of a roughness length (zo) between 0.001
centimeters and 200 centimeters (NOAA, 1999b). How ALOHA uses this input depends upon whether ALOHA is performing a heavy-gas or Gaussian dispersion calculation as discussed below (NOAA, 1999b).
4-10 For a heavy-gas dispersion calculation, ALOHA limits zo to a maximum 10 centimeters.
ALOHA will set zo to the value entered by the user when the value is 10 centimeters or less.
ALOHA uses a maximum zo value of 10 centimeters whenever the user enters a value that is
greater than 10 centimeters.
For a Gaussian dispersion calculation, ALOHA will either use a zo value of 3 centimeters or
100 centimeters. The 3-cm value corresponds to terrain that is characterized as “open country”. In open country, the roughness elements are small and widely spaced (e.g., open fields, parking lots). The 100-cm value corresponds to terrain that is characterized as “urban or forest” and that would be characteristic of residential housing developments, industrial areas or forests. ALOHA will set zo to the 3-cm value whenever the user enters a value that
is 20 centimeters or less. ALOHA uses a zo value of 100 centimeters whenever the user
enters a value that is greater than 20 centimeters. ALOHA uses the ground roughness input to determine which set of vertical dispersion coefficients (σz) will be used in the calculation.
Two different sets of σz curves are used by ALOHA for rural and urban environments,
respectively.14
The different approaches for heavy-gas dispersion and Gaussian dispersion are consistent with the observation that surface roughness has less influence on dense-gas releases in comparison with neutrally buoyant releases (Lazaro, 1997).
Various tables of zo as a function of terrain attributes are found in the literature (Lazaro, 1997;
Hanna, 2002). In addition, the ALOHA online help (NOAA, 1999b) provides the following guidance from Brutsaert (1982).
Surface description zo (cm)
Mud flats, ice 0.001
Smooth tarmac (airport runway) 0.002 Large water surfaces (average) 0.01-0.06 Grass (lawn to 1 cm high) 0.1
Grass (airport) 0.45
Grass (prairie) 0.64
Grass (artificial, 7.5 cm high) 1.0 Grass (thick to 10 cm high) 2.3 Grass (thin to 50 cm) 5.0 Wheat stubble plain (18 cm) 2.44
14 The Gaussian plume equation makes use of both a vertical dispersion coefficient (σz) and a horizontal dispersion coefficient (σy). Typically, dispersion modeling uses different sets of σy and σz dispersion coefficients for open country (often referred to as rural) and urban applications. ALOHA, however, uses the same set of σy dispersion coefficients for both open country and urban applications (Reynolds, 1992). Appendix A has a brief discussion of the Gaussian plume equation and the role of the dispersion
4-11
Grass (with bushes, some trees) 4 1-2 m high vegetation 20 Trees (10-15m high) 40-70 Savannah scrub (trees, grass, sand) 40 Large city (Tokyo) 165
Recommendation: It is generally conservative to choose open country dispersion (or
equivalently specify a zo value of 3 cm) instead of urban or forest dispersion (zo = 100 cm). It is
recommended, however, that the analyst uses judgment based on site observation and published guidance to take credit for surface roughness effects in increasing puff and plume dispersion where appropriate. Ideally, consultation with the laboratory or site meteorology organization responsible for recording and maintaining site meteorological data is available to the analyst to assist in specifying this input and defending its use.
The ALOHA online help recommends using the dominant characteristic of the terrain that surrounds the postulated release and receptor distances of interest (NOAA, 1999b). Following this guidance, urban or forest terrain would be selected whenever more than 50% of the
surrounding terrain is urban or forest. This recommendation is generally consistent with EPA guidance as defined in the Risk Management Program (RMP) (EPA, 1999). EPA considers the term rural to refer to terrain that is generally flat with few buildings or other obstructions (e.g., hills, trees). Conversely, EPA guidance recommends assuming urban conditions for a site area with many obstructions “even if it is in a remote location that would not usually be considered urban” (EPA, 1999).
Cloud Cover
This input parameter represents the proportion of the sky that is covered by clouds. It is
expressed in tenths following the convention that is used by U.S. meteorologists. For example, 5 tenths corresponds to a sky that is half-covered by clouds. The allowable input range is from 0 (completely clear sky) to 10 (completely cloudy sky).
Cloud cover is a determining factor of atmospheric stability class. Since cloud cover and atmospheric stability are separate input parameters in ALOHA, input values entered for these two parameters should be consistent with one another. ALOHA primarily uses the cloud-cover input to estimate the amount of incoming solar radiation that is incident upon the puddle formed by a liquid spill (cloud cover is expected to also have an effect at night on the long wave
radiation calculations and therefore a small effect on evaporation). Decreasing cloud cover during daytime allows for more heating of the puddle by the sun and a higher evaporation rate. The calculation uses this input for the release scenarios that involve a puddle forming on the ground (e.g., specified explicitly by user through puddle source or determined by ALOHA with a user-specified tank source). Although not used for scenarios that do not involve a puddle (e.g., direct source, pipe source), a value for the fractional cloud cover is still required by ALOHA. Recommendation: The specification of fractional cloud cover should be consistent with the atmospheric stability class input. Stable and unstable atmospheric conditions are supported by
4-12 low cloud cover conditions. For daytime releases, some minimum amount of cloud cover may be necessary to support neutral (class D) atmospheric conditions.
A recommended conservative approach is based upon algorithms that are used in ALOHA to identify appropriate choices for atmospheric stability class based on the inputs for location, date and time, wind speed, surface roughness length, and cloud cover. Using the data entered for these other input parameters, ALOHA dims the stability class designations that it determines to be incompatible (and fills the associated selection bubble gray as shown in Figure 4-2) and leaves the other stability classifications available for selection (clear selection bubble).15 A
trial-and-error approach for specifying a conservative fractional cloud cover use with daytime puddle scenarios is outlined below.
• Following guidance that is in this document, determine the combination of atmospheric stability class and wind speed that is appropriate for the accident scenario to be analyzed and type of meteorological conditions (e.g., unfavorable, typical) to be assumed for the analysis.
• Completely enter data under the Site Data menu, which will include the inputs for location and date and time.
• Under the Set Up menu, start entering data under the Atmospheric Options submenu in the order that ALOHA prompts the user through the dialog boxes: wind speed; wind direction; measurement height for wind speed; and then ground roughness length.
• Enter 0 (tenths) for fractional cloud cover. Observe the section of dialog box pertaining to atmospheric stability class to see if the atmospheric stability class of interest for the scenario is identified by ALOHA as compatible with the other inputs. If so, continue with the data entry thus using 0 tenths as the fractional cloud cover for the calculation. If not, increase the fractional cloud cover by 1 (tenth) until the atmospheric stability class of interest for the scenario is identified by ALOHA as compatible.16
Air Temperature
The allowable input range for air temperature is -100 degrees F to 150 degrees F (-73 degrees C to 65 degrees C) (NOAA, 1999b). Air temperature is an input to the puddle heat-transfer
algorithm that is used to determine the puddle temperature, from which the vapor pressure of the liquid chemical and the evaporation rate are determined for non-boiling liquids.
15 An override button allows the user to select any of the atmospheric stability classes that ALOHA has determined to be incompatible.
16 If the atmospheric stability class of interest does not show up as compatible for any input value (0 to 10) for fractional cloud cover, check other input entries for correctness. The correctness check should include the date and time entries (note that if the user neglects to enter the date and time, ALOHA defaults to information supplied by the internal computer clock).
4-13 Recommendation: As discussed above, statistical analysis of site-specific, meteorological measurements is the preferred approach for specifying meteorological conditions. For air temperature, a reasonably bounding high temperature is recommended based on analysis of the site data. For example, Lazaro suggests the 95th percentile value of a five-year record of daily high temperatures for the warmest month of the year (Lazaro, 1997).
Stability Class
ALOHA uses data entered for date and time, wind speed, and cloud cover to identify stability classes that are compatible with the entered data and to automatically select one of the stability classes. ALOHA uses the table below for determining compatible stability classes (Turner, 1970; NOAA, 1999b).
Surface
Wind Day Night
Wind Speed Incoming Solar Radiation Cloud Cover
[m/s] Strong Moderate Slight > 0.5 < 0.5
< 2 A A-B B E F
2-3 A-B B C E F 3-5 B B-C C D E 5-6 C C-D D D D
> 6 D D D D D
Notes for information above:
• Stability is D for completely overcast conditions during day or night.
• "Night" is the time period from 1 hour before sunset until 1 hour after sunrise.
• "Strong" solar radiation corresponds to clear skies with the sun high in the sky (solar angle greater than 60 degrees).
• "Slight" solar radiation corresponds to clear skies with the sun low in the sky (solar angle between 15 and 35 degrees).
Recommendation: As mentioned several times in this document, statistical analysis of site-specific, meteorological measurements is the preferred approach for specifying meteorological conditions. The determination of the meteorological conditions that correspond to the 50th and
95th percentile consequence results will require the simultaneous consideration of both atmospheric stability class and wind speed (ambient temperature may also be considered for scenarios that involve pool evaporation). In lieu of site-specific meteorological data, the following guidance is provided.
i) For ground-level (and nearly ground-level) releases that are neutrally buoyant, stable atmospheric conditions and low wind speeds represent generally accepted, unfavorable
4-14 meteorological conditions (i.e., F stability class and 1.5-m/s wind speed) (Hanna, 1996a; Lazaro, 1997). Stable atmospheric conditions and low wind speeds are also expected to produce unfavorable meteorological conditions for dense gas releases at ground level that are continuous (Hunter, 1993; Hanna, 1996a; Lazaro, 1997).
ii) For short-duration releases (i.e., puffs) of dense gases, unfavorable meteorological conditions may occur with neutral stability conditions and moderate wind speeds (Hanna, 1996a;
Lazaro, 1997). With dense-gas puffs or plumes, it is recommended that a parametric study be performed among the various combinations of wind speed and atmospheric stability classes to determine unfavorable meteorological conditions for the receptor locations of interest.
iii) For elevated releases of neutrally buoyant gases, the atmospheric stability class associated with unfavorable meteorological conditions will be dependent upon the distance of the receptor from the source. At very close distances, the ground level concentration may be zero for stable conditions as the puff or plume simply passes overhead. Unstable
atmospheric stability will result in the highest ground-level concentrations at close distances as high levels of turbulence will promote rapid dispersion of the puff or plume to the ground from its elevated release position. At receptor locations further downwind, neutral
atmospheric buoyant conditions produce the highest ground-level concentrations with the Gaussian plume model. Even further downwind, the highest ground-level concentrations occur with stable atmospheric conditions as the puff or plume has traveled far enough downwind for the puff or plume to disperse enough to reach ground level. With elevated releases of neutrally buoyant gases, it is recommended that a parametric study be performed among the various combinations of wind speed and atmospheric stability classes to determine unfavorable meteorological conditions for the receptor locations of interest.
As mentioned above, accident analysis calculations under typical meteorological conditions may sometimes be performed. Atmospheric stability class D is the most common stability class for many DOE sites. This is due to the large number of combinations that can result in stability class D. For example, high-wind conditions and/or cloudy conditions during the day or at night are normally associated with stability class D. A wind speed of 4.5 m/s together with
atmospheric stability class D has been suggested to represent typical meteorological conditions (FEMA, 1989). This set of conditions is also consistent with a basis by chemical process industry for determining limits on chemical inventories, and is representative of most U.S. regions (CFR, 1992) and for radiological hazard categorization of DOE facilities (DOE, 1997). Inversion Height
ALOHA prompts the user for an inversion height or to indicate that no inversion exists.
ALOHA accept input values for the inversion height between 10 feet (about 3 meters) and 5,000 feet (about 1,524 meters) (NOAA, 1999b).
A dense-gas cloud generally remains close to the ground as it travels downwind. As a result, ALOHA assumes that dense-gas dispersion in unaffected by the presence of an inversion layer