Performance of a New-Generation
Chemiluminescent Assay for Hepatitis B
Surface Antigen
Dan Chen
1*and
Lawrence A. Kaplan
1†Background:The usual criteria for analysis of hepatitis B surface antigen (HBsAg) are detection of HBsAg and result confirmation by antibody neutralization. We ob-served that with the Immulite 2000 HBsAg assay [Diag-nostics Product Corporation (DPC)] a relatively high percentage of weakly reactive (WR) samples did not pass the neutralization step.
Methods: For each of 3 lots of Immulite 2000 HBsAg reagent (DPC), we collected and analyzed HBsAg data from⬃3000 to 4000 patient blood samples and compared these data with HBsAg data from 3393 samples tested with the Abbott Auszyme assay. For 127 samples with initially WR detection signals (relative signal/cutoff index of 1.00 –2.5) on the Immulite 2000 HBsAg assay, we then measured hepatitis B (HB) viral load and/or other HB serologic markers.
Results: The Immulite 2000 HBsAg assay produced more initially reactive results than the Abbott Auszyme method. Many of these reactive samples, however, were WR and did not meet the confirmation criteria in the neutralization test. Moreover, DNA PCR testing indi-cated that 22 of the 38 WR samples (58%) that did meet the confirmation criteria had no detectable HB viral DNA.
Conclusions: Immulite 2000 HBsAg assay results in-clude a unique group of WR samples that are associated with both false-positive and false-negative results, re-gardless of neutralization status, and require careful interpretation. WR HBsAg samples should be reported as confirmed HBsAg reactive only if the samples not
only meet the neutralization criteria but also are positive for other HB serologic markers such as anti-HB core total and anti-HB core IgM.
© 2006 American Association for Clinical Chemistry
Hepatitis B virus (HBV)3 infection is a major health
problem worldwide. It is estimated that more than 1 million persons in the United States are chronic HBV carriers and are potentially infectious to others. In addi-tion, HBV chronic carriers are at high risk for liver cirrhosis and hepatocellular carcinoma (1–3 ). Identifica-tion of HBV carrier status in pregnant women and blood donors is critical to eliminating the transmission of HBV through blood transfusion and drastically decreasing the rate of infant infection through maternal transmission
(4 – 6 ).
Hepatitis B surface antigen (HBsAg) is an HBV sero-logic marker that plays a major role in the diagnosis of HBV infection. A new-generation chemiluminescent HBsAg assay performed on the Immulite 2000 [Diagnos-tics Product Corporation (DPC)] measures HBsAg with a method that involves 2 steps: initial screening and confir-mation neutralization. We observed that a relatively high percentage of weakly reactive (WR) samples did not pass the confirmation neutralization step and therefore inves-tigated these results.
Material and Methods
We analyzed samples sent to the Bellevue Hospital labo-ratory for routine assessment of HBV infectivity status. Beginning in May 2003, we used the Immulite 2000 assay (DPC) to measure HBsAg. We investigated the perfor-mance of the assay during 3 different 1-month time
1Department of Pathology, New York University, School of Medicine, Clinical Chemistry Laboratory of Bellevue Hospital, New York, NY.
†Current address: Department of Pathology, Beth-Israel Hospital, New York, NY.
* Address correspondence to this author at: Department of Pathology, Bellevue Hospital, Room 4S-12, 462 1st Ave., New York, NY 10016. Fax 212-263-8284; e-mail [email protected].
Received November 23, 2005; accepted May 11, 2006.
Previously published online at DOI: 10.1373/clinchem.2005.064063
3Nonstandard abbreviations: HBV, hepatitis B virus; S/C, signal/assay cutoff; HBsAg, hepatitis B surface antigen; DPC, Diagnostic Products Corpo-ration; WR, weakly reactive; aHBs, antibodies against hepatitis B surface antigen; aHBcT, total antibodies against hepatitis B core antigen; and aHBcIgM, IgM antibodies against hepatitis B core antigen.
periods, which corresponded to the use of 3 different lots of reagent. During each 1-month period for each reagent lot, we collected HBsAg sample data from all HBsAg tests performed for the Bellevue Hospital patient population. We also calculated the positive detection rates of HBsAg by the Immulite 2000 assay and the historical positive rate of detection by the Abbott Auszyme enzyme immunoas-say in the Bellevue patient population (same data collec-tion procedure as for Immulite 2000 assay) and used2
analysis to compare the results.
The HBsAg qualitative assay requires 2 incubation steps and a total reaction time of 65 min. Patient results were reported as reactive [sample signal/assay cutoff (S/C) indexⱖ1.00] or nonreactive (S/C ratio⬍1.00). The DPC protocol requires that samples deemed reactive must be repeated in duplicate. If the S/C ratios of 2 replicates are both ⬍1.00, the result of this sample is reported as nonreactive. If the S/C of at least 1 of the 2 replicates is
ⱖ1.00, the sample is considered reactive, and the result must be confirmed by an HBsAg neutralization test, in which the percentage of HBsAg signal reduction in the presence of antibodies against HBsAg (aHBs) is measured
(7 ). The DPC HBsAg confirmation protocol requires a signal reduction ofⱖ50% after neutralization. If the signal reduction is⬍50%, then the sample is considered negative for HBV(7,8 ).
The Abbott Auszyme enzyme immunoassay is a semi-manual procedure that involves 2 incubation steps at 2 different temperatures (reaction at 40 °C and color devel-opment at room temperature). The cutoff value of each run is calculated from a formula based on the negative controls from that run(9 ).
Qualitative assays for aHBs, total antibodies against HB core antigen (aHBcT), and IgM antibodies against HB core antigen (aHBcIgM) were run on the DPC Immulite 2000. The DPC-defined criteria for positive results of these assays are as follow: aHBs ⱖ11.0 mIU/mL (10,11 ), aHBcIgM ⱖ11.0 IU/mL (12 ), and aHBcT cutoff/signal
ⱖ1.15(13 ). We used2statistical analysis of reactive rates
among different lots(14,15 ).
We used the Roche COBAS Amplicor HBV Monitor test (Ver. 2.0) to detect HBV viral DNA(16,17 ). Although the quantitative detection limit isⱖ200 copies/mL, qual-itatively the detection limit goes to zero. A sample with a result of 1 to 199 copies/mL is reported as “⬍200 copies”; a sample with 0 copies is reported as “no HBV DNA detected”.
Results
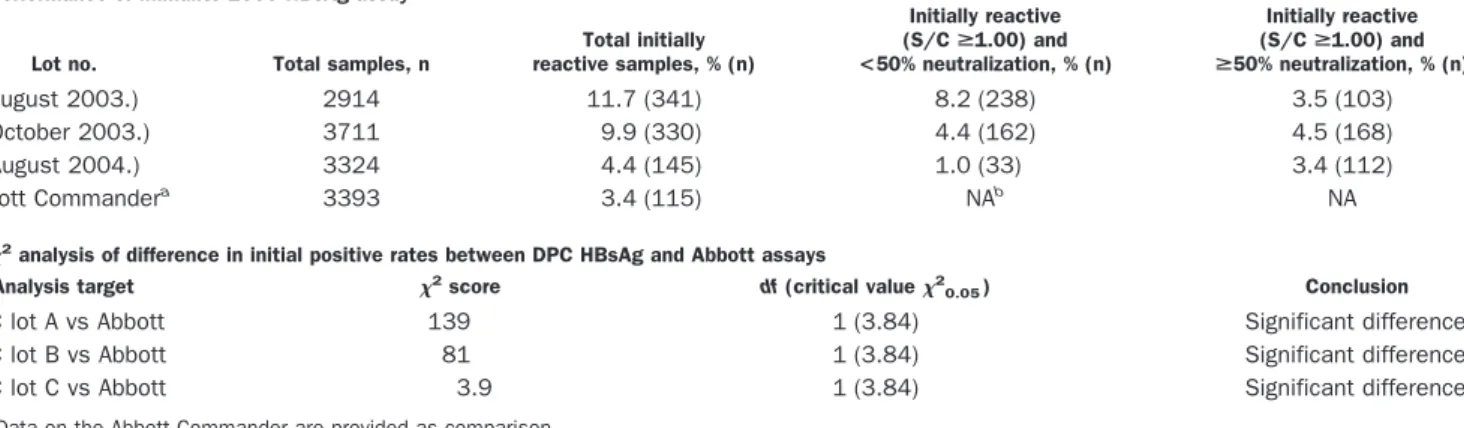
Our initial results are shown in Table 1. Samples tested with reagent lots A and B on the DPC Immulite 2000 assay yielded a fairly high percentage of initially reactive sam-ples. Statistical analysis indicated that the initial positive rate of the DPC assay was significantly different from the initial positive rate of the Abbott assay, particularly in the case of lots A and B. After we performed the confirmation step, up to 70% of the initially reactive samples had⬍50% neutralization activity.
We randomly selected ⬃200 patient samples with
Fig. 1. Distribution of the S/C ratio vs neutralization result for samples with initial HBsAg reactivity by Immulite 2000 HBsAg assay.
Group 1, samples with⬍50% neutralization in confirmation test;group 2,ⱖ50% neutralization. Thex axisindicates the groups of sample based on the confir-mation results. They axisindicates the initial S/C ratio of each sample. Table 1. Results for Immulite HBsAg assay.
A. Performance of Immulite 2000 HBsAg assay
Lot no. Total samples, n
Total initially reactive samples, % (n)
Initially reactive (S/C>1.00) and <50% neutralization, % (n)
Initially reactive (S/C>1.00) and
>50% neutralization, % (n)
A (August 2003.) 2914 11.7 (341) 8.2 (238) 3.5 (103) B (October 2003.) 3711 9.9 (330) 4.4 (162) 4.5 (168) C (August 2004.) 3324 4.4 (145) 1.0 (33) 3.4 (112)
Abbott Commandera 3393 3.4 (115) NAb NA
B.2analysis of difference in initial positive rates between DPC HBsAg and Abbott assays
Analysis target 2score df(critical value2
0.05) Conclusion
DPC lot A vs Abbott 139 1 (3.84) Significant difference DPC lot B vs Abbott 81 1 (3.84) Significant difference DPC lot C vs Abbott 3.9 1 (3.84) Significant difference
aData on the Abbott Commander are provided as comparison. bNA, not applicable.
initial reactive HBsAg results (S/C ratioⱖ1.00) from lots A and B for the confirmation outcome study. Samples with unconfirmed neutralization⬍50% and samples with confirmed neutralization (ⱖ50%) were grouped sepa-rately. The relationship between patient S/C result and neutralization result is illustrated in Fig. 1. It is clear that the confirmation rate correlates with the S/C ratio: the higher the ratio, the greater likelihood of being confirmed by neutralization. In group 1, 98% of samples had S/C ratios⬍2.5, whereas group 2 contained all of the samples with S/C ratios⬎10.
The high initial positivity rate and the subsequent failure at the confirmation step for a significant portion of the initial positives led us to question the clinical signifi-cance of these results and led to further investigation. To get a better understanding of the true nature of these WR samples, we used HBV viral load and other HBV serologic markers to judge the HBV infectious status.
hbv dna load test
Patient samples (n⫽127) with WR HBsAg results (S/C ratio ⱕ2.5) measured on the DPC Immulite 2000 assay with reagents from any 1 of the 3 lots were randomly selected and tested for the viral load and other serologic HBV markers. Among the 127 samples, 38 had ⱖ50% neutralization activity and the other 89 had ⬍50% neu-tralization activity.
The PCR results indicated that 83 of the 89 WR samples with⬍50% neutralization activity (93%) had no detectable HBV DNA (zero copies); 6 of the 89 had low DNA (up to 9000 copies/mL). The serologic profiles of the 6 samples with detectable HBV DNA are shown in Table 2. One sample had positive aHBcIgM (45% HBsAg confirmation and negative aHBs), suggesting early acute-phase infec-tion; 2 samples had positive aHBcT and negative aHBs, suggesting either early or chronic infection; and 3 had negative aHBs, aHBcT, and aHBcIgM. These 3 samples could indicate a very early stage of infection, in which case HBsAg reactivity would be low, or infection with (an) HBsAg mutant strain(s) that led to neutralization failure(18 ). For 1 of the 6 samples (sample 3, which was negative for aHBs, HBsAg, and aHBcT), the patient had follow-up tests ordered 1 year later. The follow-up
indi-cated that both HBsAg and aHBs were still negative. However, the lack of aHBcT data made it difficult to differentiate the likely cause of the original positive HBV viral load result.
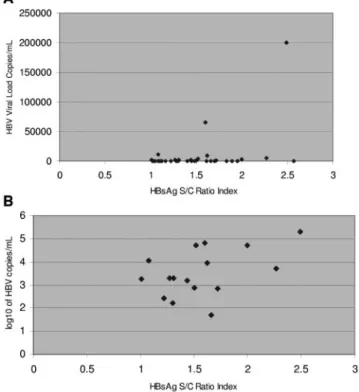
In the group of 38 WR samples that did have ⱖ50% neutralization in the confirmatory step, 22 samples (58%) had no detectable DNA (zero copies), and 16 samples had detectable HBV DNA. Among this group of WR samples, the correlation between the DNA copy number and the quantitative index of the HBsAg serologic result was poor (Fig. 2).
The 22 HBV DNA-negative samples could be divided
Fig. 2. Distribution of HBV viral load copies vs S/C ratio.
(A), distribution of HBV viral load copies vs S/C ratio in the 38 WR samples that gaveⱖ50% HBsAg neutralization results.x axis, S/C ratio of HBsAg reactivity (range, 0 –3.0;y axis, viral load (range, 0 –250 000 copies/mL). (B), distribution of HBV viral load copies vs S/C ratio in the 16 samples (of the 38 samples in
panel A) that hadⱖ50% neutralization and positive viral load results.x axis, S/C ratio of HBsAg reactivity;y axis, log-transformed viral load (log10).
Table 2. Serologic characterization of samples with positive HBV viral load and initially weakly positive results (S/C ratio
<2.5) that could not be confirmed (neutralization<50%).
Patient aHBs aHBcIgM aHBcT HBV viral load (copies/mL)a
1 ⫺ ⫹ ⫹ Positive (9700)
2 ⫺ ⫺ ⫺ Positive (570)
3 ⫺ ⫺ ⫺ Positive (⬍200)b
4 ⫺ NAc
⫹ Positive (900)
5 ⫺ ⫺ ⫺ Positive (217)
6 ⫺ NAc
⫹ Positive (5230)
aValues in parentheses are HBV DNA copy numbers.
bQuantitative cutoff is⬎200 copies/mL; qualitative cutoff is extended to 1–199 copies/mL. cNA, not available.
into 5 groups based on available serologic markers other than HBsAg (Table 3). Because group 2 samples had positive aHBs and negative aHBcT, suggesting previous immunization, theirⱖ50% neutralization HBsAg results were most likely false positives.
The follow-up results available for samples from groups 1 and 4 suggested that at least 2 samples had false-positive HBsAg results (follow-up with negative results for both HBsAg and aHBs). Furthermore, 1 group 1 sample from a hemodialysis patient was highly likely to be false positive because 12 subsequent HBsAg follow-up tests (1 per month) were all negative.
The serologic profile of aHBs⫺/aHBcT⫹/aHBcM⫺for group 5 samples indicated that the HBsAg-positive re-sults were highly likely to be true positives despite the lack of detectable HBV DNA in these samples. One of the 6 samples had a follow-up result that repeated as aH-BcT⫹/HBsAg⫹, which provided further evidence for the likely true HBsAg positivity of the original patient sam-ple.
Discussion
Our current study (Fig. 3) and previously published data indicate that although the Immulite 2000 HBsAg assay has HBsAg detection rates similar to those of the Abbott Auzyme and Bayer Centaur (19 ), the specificity of the Immulite 2000 at the initial run is not as high as the other 2 assays. The occurrence of a high number of initially positive results that are not confirmed by the neutraliza-tion step is likely related to the inherent poor separaneutraliza-tion between signal and background noise of this assay. We found that as a consequence of this poor specificity, the rate of initially positive samples was 1.5- to 3.5-fold higher than for the Abbott assay (see Table 1). Although we observed this situation over multiple reagent lots during the last 3 years, we also found that the quality of the assay reagent has improved (see lot C in Table 1). However, a reasonable and accurate report format is still needed for the⬃1% of samples that are WR, regardless of whether they pass confirmation criteria. The Immulite 2000 assay instructions state that, “the patient appears to not be infected with HBV” if the neutralization is⬍50%, whereas any sample with neutralizationⱖ50% should be reported as “confirmed reactive for HBsAg”(8 ). Our results, how-ever, suggest that this approach may lead to both
false-positive and false-negative results and that, therefore, a more careful and thorough protocol is needed to deal with this issue.
To avoid the reporting of false-negative HBsAg results, we suggest that any sample, from any manufacturer, with a low-positive result that does not pass the assay’s con-firmation test not be designated “nonreactive” until other HBV serologic markers are measured to provide a clearer picture of the patient’s status (Fig. 4). For these samples, laboratories should consider reflex testing to aHBcT, aHBs, and aHBcIgM, if these tests were not ordered by the physician together with the HBsAg test, and review by the laboratory director.
In a similar vein, our data also indicate that at least some of the samples (6 of the 22) that were WR (S/C ratios, 1.00 –2.50) and did pass neutralization criteria for positive results did not have evidence of HBV infection (Table 3). This finding is understandable because the impact of the inherent high CV (⬃10%) and poor separa-tion between signal and noise of this assay(19 )can give poor separation between true negatives and false posi-tives.
Although the DPC assay instructions advise laborato-ries to rely entirely on the neutralization result to decide the HBsAg outcome, our results suggest that further testing is needed before WR samples are reported as “confirmed HBsAg reactive”. Again, we would recom-mend that other HBV serologic markers be tested and that final results reported as confirmed HBsAg reactive only if the sample is also positive for aHbcT and/or aHbcIgM. Otherwise, the test should be repeated in 2 weeks (Fig. 4). This approach is similar to some other test procedures recommended by the CDC. In the guidelines for labora-tory testing and result reporting of HCV antibody, the CDC recommends that a reflex test be performed before HCV positives with low S/C ratios are reported(20 ).
Although we investigated only the DPC Immulite assay, we suspect that similar low positive results with questionable status might occur with other HBsAg assays, and we recommend study of the issue by each laboratory. In conclusion, our analysis of the performance of the DPC Immulite 2000 chemiluminescent HBsAg test at Bellevue Hospital indicates that samples identified by this assay as WR (S/C ratios, 1.00 –2.50) need additional testing and review, regardless of neutralization status. Laboratories
Table 3. Serologic profile and follow-up results for the 22 HBV DNA–negative samples with confirmed HBsAg neutralization results.
Group Sample no. Serologic marker profile Follow-up availability Follow-up result
1 8 aHBs⫺/aHBcT⫺/aHBcIgM⫺ 3 of 8 2 HBsAg⫺; 1 HBsAg⫺/aHBs⫺ 2 4 aHBs⫹/aHBcT⫺/aHBcIgM⫺ NAa
3 2 aHBs (NA)/aHBcT (NA)/aHBcIgM (NA) 1 of 2 HBsAg⫺ 4 2 aHBs⫺/aHBcT (NA) 1 of 2 HBsAg⫺/aHBs⫺ 5 6 aHBs⫺/aHBcT⫹/aHBcIgM⫺ 1 of 6 HBsAg⫹/aHBcT⫹
performing HBsAg testing should determine the signifi-cance of WR assay results. When interpreting WR sam-ples, one should look at the whole profile of HBV tests,
including the HBsAg neutralization test and assays of other hepatitis serologic markers, to provide the most accurate status of HBV infection to clinicians. Laboratories
should establish HBV test panel(s) to allow the reflex test(s) such as aHBcT and aHBcIgM to be performed in these cases.
This study is partially supported by Diagnostics Product Corporation (DPC; Los, Angeles, CA).
References
1. Lee WM. Hepatitis B infection. N Engl J Med 1997;337:1733– 45.
2. Centers for Disease Control. Protection against viral hepatitis: recommendations of Immunization Practices Advisory Committee. MMWR Morbid Mortal Wkly Rep 1990;39:5–22.
3. Gitlin N. Hepatitis B: diagnosis, prevention, and treatment. Clin Chem 1997;43:1500 – 6.
4. Stevens CE, Toy PT, Tong MJ, Taylor PE, Vyas GN, Nair PV, et al. Perinatal hepatitis B virus transmission in the United States: prevention by passive-active immunization. JAMA 1985; 253:1740 –5.
5. Stevens CE, Toy PT, Tong MJ, Taylor PE, Vyas GN, Nair PV, et al. Yeast-recombinant hepatitis vaccine: efficacy with hepatitis B immune globulin in prevention of perinatal hepatitis B virus transmission. JAMA 1987;257:2612– 6.
6. Beasley RP, Hwang L-Y. Epidemiology of hepatocellular carcinoma.
In: Vyas GN, Dienstag JL, Hoofnagle JH, eds. Viral Hepatitis and Liver Disease. New York: Grune & Stratton, 1984:209 –24.
7. Weber B, Dengler T, Berger A, Doerr HW, Rabenau H. Evaluation of two new automated assays for hepatitis B virus surface antigen (HBsAg) detection: Immulite HBsAg and Immulite 2000 HbsAg. J Clin Microbiol 2003;41:135– 43.
8. Diagnostic Products Corporation. Immulite 2000 HBsAg assay: hepatitis B surface antigen and confirmatory test. DPC Immulite 2000 assay instructions. Los Angeles, CA: DPC, 2005.
9. Gostein MG, Aide PM, Coleman PE. Rate of hepatitis B virus infection in pregnant women determined by a monoclonal HBsAg immunoassay. J Clin Microbiol 2002;40:3493– 6.
10. Centers for Disease Control. Sensitivity of the test for antibody to hepatitis B surface antigen—United States. MMWR Morbid Mortal Wkly Rep 1990 1993;42:707–10.
11. Diagnostic Products Corporation. Immulite 2000 anti-HBs assay: antibody to hepatitis B surface antigen. DPC Immulite 2000 assay instructions. Los Angeles, CA: DPC, 2002.
12. Diagnostic Products Corporation. Immulite 2000 anti-HBc IgM assay: IgM antibody to hepatitis B core antigen. DPC Immulite 2000 assay instructions. Los Angeles, CA: DPC, 2002.
13. Diagnostic Products Corporation. Immulite 2000 anti-HBc total assay: total antibodies to hepatitis B core antigen. DPC Immulite 2000 assay instructions. Los Angeles, CA: DPC, 2002.
14. Ball CN, Connor-Linton J. Georgetown Linguistics Web Chi Square Fig. 4. Algorithm for Immulite 2000 HBsAg testing and result reporting footnotes.
Footnotes: (1), each laboratory should determine its own S/C ratio for WR; (2), the result reporting follows the criteria provided manufacturer; (3), the result reports as “Equivocal, please resubmit in two weeks”.
Calculator. http://www.georgetown.edu/faculty/ballc/webtools/ web_chi.html (accessed December 2005).
15. Kahn SE, Jandreski MA. Laboratory statistics. In: Kaplan LA, Pesce AJ, Kazmierczak SC, eds. Clinical Chemistry: Theory, Anal-ysis, Correlation, 4th ed. St. Louis, MO: Mosby, 2003:356 –7.
16. Lok AS, Ghany MG, Watson G, Ayola B. Predictive value of aminotransferase and heptatitis B virus DNA levels on response to interferon therapy for chronic hepatitis B. J Viral Hepat 1998; 5:171– 8.
17. Nagata I, Colucci G, Gregorio GV, Cheeseman P, Williams R. Mieli-Vergani G, et al. The role of HBV/DNA quantitative PCR in
monitoring the response to interferon treatment in chronic hepa-titis B virus infection. J Hepat 1998;30:965–9.
18. Carman WF. The clinical significance of surface antigen variants of hepatitis B virus. J. Viral Hepat 1997;4(Suppl 1):11–20.
19. Chen D, Kaplan LA, Liu Q. Evaluation of two chemiluminescent immunoassays of ADVIA centaur for hepatitis B serology marker. Clin Chim Acta 2005;355:41–5.
20. Alter MJ, Kuhnert WL, Finelli L. Guidelines for laboratory testing and result reporting of antibody to hepatitis C virus. MMWR Morbid Mortal Wkly Recomm Rep 2003;52:1–13, 15; quiz CE 1– 4.