Sociodemographic Differences and Infant
Dietary Patterns
WHAT’S KNOWN ON THIS SUBJECT: Despite breastfeeding recommendations by the World Health Organization and the American Academy of Pediatrics, there is less agreement on appropriate use of infant solid foods. There are currently no well-established dietary guidelines for US infants that are similar to
the Dietary Guidelines for Americans (aged.2 years).
WHAT THIS STUDY ADDS: Distinct dietary patterns exist among
US infants and have differential influences on growth. Use of
“Infant guideline solids” (vegetables, fruits, baby cereal, and
meat) with prolonged breastfeeding is a promising healthy dietary pattern for infants after age 6 months.
abstract
OBJECTIVES:To identify dietary patterns in US infants at age 6 and 12 months, sociodemographic differences in these patterns, and their associations with infant growth from age 6 to 12 months.
METHODS:We analyzed a subsample (760 boys and 795 girls) of the
Infant Feeding Practices Study II (2005–2007). Mothers reported their infants’ intakes of 18 types of foods in the past 7 days, which were used to derive dietary patterns at ages 6 and 12 months by principal component analysis.
RESULTS:Similar dietary patterns were identified at ages 6 and 12 months. At 12 months, infants of mothers who had low education or non-Hispanic African American mothers (vs non-Hispanic white) had a higher score on “High sugar/fat/protein” dietary pattern. Both “High sugar/fat/protein” and“High dairy/regular cereal”patterns at 6 months were associated with a smaller increase in length-for-agezscore (adjustedbper 1 unit dietary pattern score, 21.36 [95% confidence interval (CI), 22.35 to 20.37] and 20.30 [20.54 to 20.06], respectively), while with greater increase in BMI z score (1.00 [0.11 to 1.89] and 0.32 [0.10 to 0.53], respectively) from age 6 to 12 months. The“Formula”pattern was associated with greater increase in BMIz score (0.25 [0.09 to 0.40]). The “Infant guideline solids” pattern (vegetables, fruits, baby cereal, and meat) was not associated with change in length-for-age or BMIzscore.
CONCLUSIONS:Distinct dietary patterns exist among US infants, vary
by maternal race/ethnicity and education, and have differential influences on infant growth. Use of “Infant guideline solids” with prolonged breastfeeding is a promising healthy diet for infants after age 6 months.Pediatrics 2014;134:e1387–e1398
AUTHORS:Xiaozhong Wen, MD, PhD,aKai Ling Kong, PhD,a
Rina Das Eiden, PhD,bNeha Navneet Sharma,cand
Chuanbo Xie, MD, PhDa
aDivision of Behavioral Medicine, Department of Pediatrics,
School of Medicine and Biomedical Sciences,bResearch Institute
on Addictions, andcDepartment of Psychology, State University of
New York at Buffalo, Buffalo, New York
KEY WORDS
infant, dietary patterns, feeding, nutrition, growth, epidemiology
ABBREVIATIONS
AAP—American Academy of Pediatrics
CDC—Centers for Disease Control and Prevention CI—confidence interval
IFPS II—Infant Feeding Practices Study II WHO—World Health Organization
WIC—Special Supplemental Nutrition Program for Women, Infants, and Children
Dr Wen initiated and developed the research question, led the analytic plan, conducted all data analyses, and drafted the manuscript; Drs Kong and Eiden contributed to the development of research question and the analytic plan, interpreted the results, and made major contributions to revising the manuscript; Ms Sharma and Dr Xie contributed to the development of research question, result interpretation, and revision of the manuscript; and all authors approved thefinal manuscript as submitted.
www.pediatrics.org/cgi/doi/10.1542/peds.2014-1045
doi:10.1542/peds.2014-1045
Accepted for publication Aug 11, 2014
Address correspondence to Xiaozhong Wen, MD, PhD, Division of Behavioral Medicine, Department of Pediatrics, School of Medicine and Biomedical Sciences, State University of New York at Buffalo, 3435 Main St, G56 Farber Hall, Buffalo, NY 14214-3000. E-mail: [email protected]
PEDIATRICS (ISSN Numbers: Print, 0031-4005; Online, 1098-4275).
Copyright © 2014 by the American Academy of Pediatrics
FINANCIAL DISCLOSURE:The authors have indicated they have nofinancial relationships relevant to this article to disclose.
FUNDING:This work was supported by a seed funding (awarded to Dr Wen) from the Department of Pediatrics, State University of New York at Buffalo.
Infancy is a critical period for learning about foods including milk and solids.1
Most infants experience a rapid tran-sition from a diet of predominantly milk (breast milk and/or formula) to a mixed diet from various food groups con-sumed by other family members.2,3 The
World Health Organization (WHO) and the American Academy of Pediatrics (AAP) recommend exclusive breastfeeding for 6 months with continuation of breastfeeding for 12 months or longer,4,5
but there is less agreement on the ap-propriate use (ie, introduction timing and types) of solid foods.6–8As a result,
there are currently no well-established dietary guidelines for infants and toddlers that are similar to the Dietary Guidelines for Americans, which apply only to indi-viduals older than age 2 years.9
Age-specific dietary guidelines are needed for infants and toddlers, because they have different nutrient needs from older children and adults.10
However, more research is needed to better understand the effects of foods on the health and development of infants and toddlers to develop evidenced-based dietary guidelines for them. It is difficult to study the health effect of individual solid foods on infants be-cause solid foods consumed by infants are often inter-correlated with each otherand with the type of milk consumed by the infants.11For example, fruits are
usually eaten together with vegetables, and baby cereal with formula. This methodological challenge may be par-tially solved by dietary pattern analysis, a relatively new tool in nutrition re-search that examines one’s whole diet rather than individual foods.12,13To date,
only 3 studies examined dietary patterns among infants and toddlers. They were conducted in the United Kingdom (Southampton Women’s Survey),14
Aus-tralia (NORISH and South AusAus-tralian Infants Dietary Intake Study),15and France (Etude
des Déterminants pré et post natals précoces du dévelopement et de la santé
de l’Enfant).16 These non-US studies
reported that distinct dietary patterns already existed among infants and toddlers, suggesting disparities in eating behaviors begin at a very young age. It is very likely that infant dietary patterns from other countries cannot be generalized to US infants, given the considerable differences in culture, food availability, and parental feeding practices. Little is known on the role of infant dietary patterns in child growth and development. In the UK study men-tioned previously, infants who had a high score on the“infant guidelines” dietary pattern (fruit, vegetables, and home-prepared foods) at 6 months gained body weight more rapidly from age 6 to 12 months, whereas infants who had high consumption of “adult foods”(bread, savory snacks, biscuits, and chips) gained weight less rapidly.17
In the same cohort, a higher score of “infant guidelines” dietary pattern at age 12 months was associated with higher lean mass index and IQ at age 4 years, but not with BMI or fat mass index at age 4 years.18,19The Australian
study found that “core foods” (fruit, grains, vegetables, cheese, and nuts/ seeds) and“basic combination”(white bread, milk, spreads, juice, and ice cream) pattern scores at age 14 months were not associated with BMIzscore at age 14 or 24 months.15
To the best of our knowledge, there is no known published study on dietary patterns among US infants. Given the importance of this area of research, we therefore conducted a secondary data analysis on infant dietary patterns in the Infant Feeding Practices Study II.20
We aimed to (1) identify infant dietary patterns among US infants, (2) explore sociodemographic differences in these dietary patterns, and (3) examine the associations between dietary patterns and infant growth. Accordingly, we hy-pothesized that (1) several distinct di-etary patterns, such as breastfeeding,
formula, healthy solids, and unhealthy solids, were prevalent among US infants, (2) these dietary patterns varied by maternal education, race/ethnicity, and household income, and (3) formula and unhealthy solids (energy dense) patterns were associated with fast growth in infant adiposity.
METHODS
Sample and Subjects
We analyzed data from a subsample of the Infant Feeding Practices Study II (IFPS II), a US longitudinal pre-birth cohort study conducted from 2005 to 2007. The IFPS II was conducted by the US Food and Drug Administration in collaboration with the Centers for Disease Control and Pre-vention (CDC). Details on the study design have been published elsewhere.20Briefly,
this longitudinal study followed pregnant women from late pregnancy through their infant’sfirst year of life.
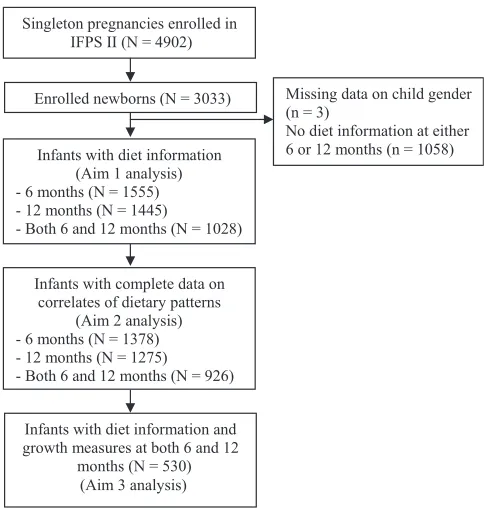
The original full study sample consisted of 4902 pregnant women and 3033 full-term newborns (gestational age
$37 complete weeks); 2095 of mother-child dyads were followed at age 6 months and 1807 were followed at age 12 months.20
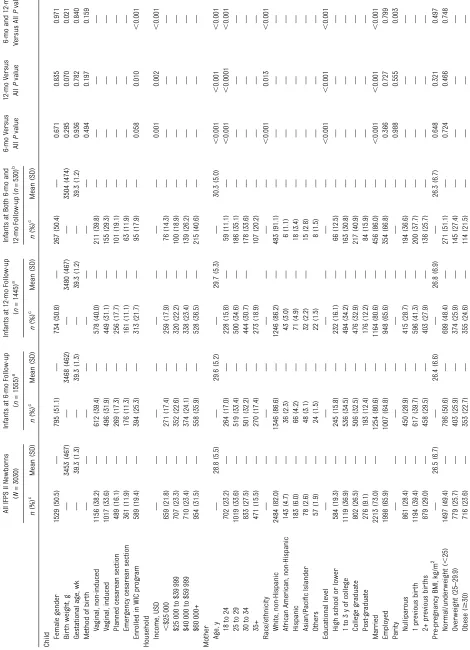
more representative sample is usually preferred in principle component anal-ysis, which could identify more robust and complete infant dietary patterns in the Aim 1 analysis, (2) the smaller samples for Aim 2 and Aim 3 were used because of practical survey issues such as missing data and attrition, and (3) for Aim 3, we further required complete growth data at both age 6 and 12 months to assess the change in growth mea-sures, which was essential for causal interpretation. Fig 1 shows the analytic sampleflow. Sample characteristics with regard to sociodemographic variables and birth outcomes are displayed in Table 1. Overall, the distributions of these characteristics were fairly similar across the original full 6-month follow-up and 12-month follow-follow-up samples. However, compared with all newborns in the original full sample, the infants who had both 6-month and 12-month follow-ups had higher birth weight and household income, and their mothers were more likely to be white, highly educated, and married.
The CDC approved this analytic plan and provided access to the de-identified and public-use data of IFPS II. This secondary data analysis was exempted from ethical approval by the Social and Behavioral Sciences Institutional Review Board, State University of New York at Buffalo.
Measures
Infant Diet
In the monthly surveys at 3, 4, 5, 6, 7, 8, 9, 10.5, and 12 months of infant ages, mothers reported their full-term infant’s intake of 18 types of foods in the past 7 days. These foods included breast milk, formula, cow’s milk, other milk (eg, soy milk, rice milk, goat milk), other dairy foods (eg, yogurt, cheese, ice cream, pudding), other soy foods (eg, tofu, frozen soy desserts), 100% fruit or 100% vegetable juice, sweet drinks (eg, juice drinks, soft drinks, soda, sweet tea, Kool-Aid), baby cereal, other cereals and starches (eg, breakfast cereals, teething biscuits, crackers, breads, pasta, rice), fruit, vegetables,
French fries, meat/chicken/combination dinners,fish or shellfish, peanut butter/ other peanut foods/nuts, eggs, and sweet foods (eg, candy, cookies, cake). Infant food intake was reported as the number of feedings per day or per week. For consistency, we converted the number of feedings per day into that of per week by multiplying by 7. The weekly intake of these 18 types of foods at age 6 and 12 months was used to derive infant dietary patterns. We chose age 6 and 12 months because (1) they are the cut-off points used in current WHO and AAP feeding guidelines: exclusive breastfeeding for at least 6 months, adding nutritious solids after age 6 months; breastfeeding for at least 12 months, transition from baby food to table food after age 12 months4,5,21,22; and (2) 2 well-child visits
are also usually scheduled at age 6 and 12 months for infant growth check-up.23
By focusing on dietary transition at age 6 and 12 months, ourfindings on dietary patterns can inform the discussion on infant diet and growth between the pe-diatrician and parents or other care-givers at these 2 critical well-child visits. In addition, we examined infant dietary patterns at age 9 months (Aim 1) and their correlates (Aim 2) in the supplemental analysis, given its importance in well-child visits. IFPS-II did not collect any infor-mation on infant growth measures be-tween 7-month and 12-month visits, which prevented us from including 9 months in our Aim 3 analysis on the association be-tween dietary patterns and infant growth.
Correlates of Dietary Patterns
Based on previous literature,14–16 we
considered some important household, maternal, and child characteristics as potential correlates of dietary patterns. These characteristics included household income; maternal age, race/ethnicity, education level, marital status, employ-ment, parity, pre-pregnancy BMI (normal/ underweight [BMI,25], overweight [BMI 25–29.9], and obese [BMI 30+]), gesta-tional diabetes, gestagesta-tional weight gain
FIGURE 1
(low, normal, and excessive)24; and child
gender, birth weight, gestational age, method of birth, and enrollment in the Special Supplemental Nutrition Program for Women, Infants, and Children (WIC) at age 6 and 12 months. Mothers reported the information on these correlates at prenatal survey, birth screeners (phone interview), or neonatal surveys.
Infant Growth Outcomes
Mothers reported their infant’s weight, length, and age at their most recent doctor’s visit at the 3-month (mean age at the most recent visit, 2.28 [SD, 0.48] months), 5-month (4.21 [SD, 0.43] months), 7-month (6.34 [SD, 0.48] months), and 12-month (12.02 [SD, 0.61] months) surveys. For the purpose of this analysis, we only included infant growth data at 7-month and 12-month surveys. Because the infants’actual age at the most recent doctor’s visit reported at the 7-month survey was closer to 6 months, we renamed these measures as 6-month growth measures. We calculated in-fant BMI as weight in kilograms/length in meters,2and used it as an indirect
measure for infant adiposity. For both age 6 and 12 months, we calculated gender- and age-specific length-for-age zscore and BMIzscore by gender and age for children using WHO Child Growth Standards.25 To quantify the
longitudinal change in infant growth measures, we further calculated the differences in theirzscores from age 6 to 12 months (eg, length-for-agezscore at age 12 months minus length-for-age zscore at age 6 months), which were used as our key growth outcomes in the following analyses.
Although the literature is inconclusive, we operationally defined optimal infant growth as length-for-age z score and BMI z score being ∼0 (equivalent to population average) based on WHO Child Growth Standards.25 WHO Child
Growth Standards are believed to reflect the optimal or ideal child growth, as they were derived from an
international, longitudinal sample of healthy, breastfed infants and young children raised in environments (eg, no maternal smoking) that do not constrain growth.25,26 In developed
societies such as the United States, infancy fast adiposity growth measured by the gain in BMIzscore or weight-for-lengthzscore is unfavorable because it is a strong risk factor for later obesity and cardio-metabolic disorders, espe-cially in an obesogenic environment.27,28
Statistical Analyses
Despite the well-documented evidence for the obesogenic effect of formula (vs breastfeeding), little is known about the role of different solids in infant growth. Because this was the veryfirst study on dietary patterns in US infants, we de-cided to apply an exploratory rather than confirmatory approach, which could offer more flexibility for gener-ating hypotheses for future replication and confirmation. Specifically, based on infants’intake of 18 types of foods, we derived infant dietary patterns at the ages of 6, 9, and 12 months using principle component analysis (FACTOR PROCEDURE in SAS; SAS Institute, Inc, Cary, NC).29 We applied orthogonal
transformation (Varimax) to rotate the original derived components, which could lead to uncorrelated components with a greater interpretability.30We only
retained the derived components with an eigenvalue.1.00 and also containing 2 or more original foods with loading factor$0.4. An infant’s individual factor score for each dietary pattern (compo-nent) was constructed by summing his or her intakes of the component food items weighted by factor loadings. A higher factor score indicated higher adherence to the corresponding dietary pattern. These factor scores (continu-ous variables) were then used for the following analyses on their correlates and associations with infant growth.
For each dietary pattern (dependent variable), wefit a multivariable linear
regression model to examine sociodemo-graphic and other correlates. Because most of these correlates were suggested by the literature and have individual predefined hypotheses (rather than 1 universal null hypothesis), we chose not to adjustPvalues for multiple compar-isons in the same multivariable linear regression model.31,32Guided by a
hier-arch approach, we fit 3 multivariable linear regression models to examine the associations between each of dietary patterns (predictor) at 6 months and each of infant growth variables (out-come). The key growth outcomes in-cluded differences in length-for-age z score and BMI z score from age 6 to 12 months. In the Model 1 (basic model) we adjusted for thezscore of the corresponding growth measure at age 6 months to yield “conditional growth”from age 6 to 12 months. The use of conditional growth could mea-sure the deviation in an infant’s sub-sequent growth from its expected level, given his or her baseline growth status.33In the Model 2
(other-dietary-patterns-adjusted model) we addition-ally adjusted for the other 3 dietary patterns at age 6 months. In the Model 3 (confounders-adjusted model) we fur-ther adjusted for the significant corre-lates of dietary patterns. We completed all data analyses in SAS version 9.3. The significant levelawas set as 0.05.
RESULTS
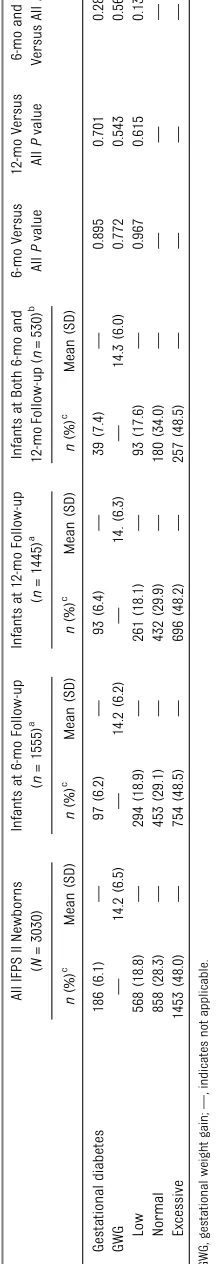
Sample Characteristics
Table 1 shows child, household, and maternal characteristics of the original full sample (N= 3030) and the 2 analytic samples followed at age 6 months (n= 1555), 12 months (n= 1445), and both 6 and 12 months (n= 530), respectively.
Dietary Patterns
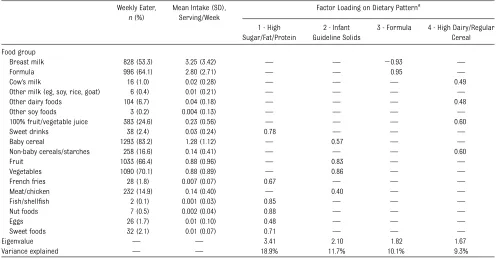
Based on the infants’intake of 18 types of foods, we derived 4 dietary patterns with an eigenvalue.1.00 and also 2 or more original foods with loading factor
$0.4 at age 6 months, which could explain 50.0% of the total variance (Table 2). Based on the included foods
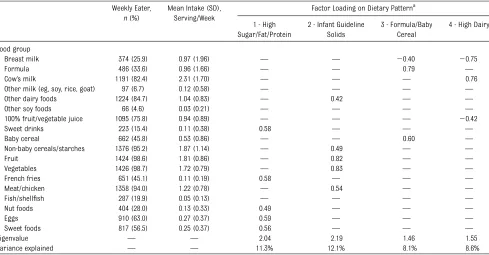
in each pattern, they were named as “High sugar/fat/protein,” “Infant guide-line solids,” “Formula,”and“High dairy/ regular cereal.” Although breast milk was not literally reflected by any of these 4 patterns at age 6 months, it was highly inversely correlated with the“Formula” pattern (loading factor = 20.93). We also derived 4 dietary patterns at age 12 months, which explained 40.1% of the total variance (Table 3). They were named as “High sugar/fat/protein,” “Infant guideline solids,” “Formula/baby cereal,” and“High dairy.”The included food types were similar to those at age 6 months except that“baby cereal non-baby cereals/ starches”replaced“baby cereal”to be in“Infant guideline solids.” “Baby cereal” was combined with“Formula”as the “Formula/baby cereal”pattern. Similarly, breast milk was not literally reflected by any of these 4 patterns at age 12 months, but it was inversely correlated with the “Formula/baby cereal” pattern (loading factor = 20.93) and the “High dairy” pattern (loading factor =20.40). Overall, the dietary patterns at age 9 months
TABLE 2 Infant Food Intake and Dietary Patterns at Age 6 Months (N= 1555) Weekly Eater,
n(%)
Mean Intake (SD), Serving/Week
Factor Loading on Dietary Patterna
1 - High Sugar/Fat/Protein
2 - Infant Guideline Solids
3 - Formula 4 - High Dairy/Regular Cereal
Food group
Breast milk 828 (53.3) 3.25 (3.42) — — 20.93 —
Formula 996 (64.1) 2.80 (2.71) — — 0.95 —
Cow’s milk 16 (1.0) 0.02 (0.28) — — — 0.49
Other milk (eg, soy, rice, goat) 6 (0.4) 0.01 (0.21) — — — —
Other dairy foods 104 (6.7) 0.04 (0.18) — — — 0.48
Other soy foods 3 (0.2) 0.004 (0.13) — — — —
100% fruit/vegetable juice 383 (24.6) 0.23 (0.56) — — — 0.60
Sweet drinks 38 (2.4) 0.03 (0.24) 0.78 — — —
Baby cereal 1293 (83.2) 1.28 (1.12) — 0.57 — —
Non-baby cereals/starches 258 (16.6) 0.14 (0.41) — — — 0.60
Fruit 1033 (66.4) 0.88 (0.96) — 0.83 — —
Vegetables 1090 (70.1) 0.88 (0.89) — 0.86 — —
French fries 28 (1.8) 0.007 (0.07) 0.67 — — —
Meat/chicken 232 (14.9) 0.14 (0.40) — 0.40 — —
Fish/shellfish 2 (0.1) 0.001 (0.03) 0.85 — — —
Nut foods 7 (0.5) 0.002 (0.04) 0.88 — — —
Eggs 26 (1.7) 0.01 (0.10) 0.48 — — —
Sweet foods 32 (2.1) 0.01 (0.07) 0.71 — — —
Eigenvalue — — 3.41 2.10 1.82 1.67
Variance explained — — 18.9% 11.7% 10.1% 9.3%
aOnly show loading factors 0.4 or greater.
were similar to those at age 6 and 12 months (Supplemental Table 7), except that nut foods and eggs were included in the“High dairy/protein”patterns rather than the“High sugar/fat”pattern.
Significant Correlates of Dietary
Patterns
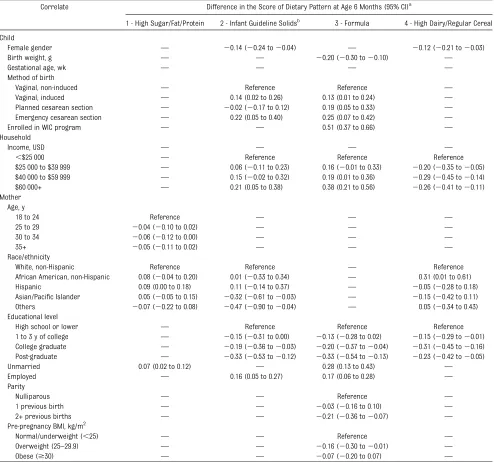
Table 4 shows significant correlates of 6-month dietary patterns. Supplemental Table 8 shows significant correlates of 9-month dietary patterns. Table 5 shows significant correlates of 12-month dietary patterns. At age 12 months, a high score on“High sugar/fat/protein”pattern was correlated with low household income, maternal non-Hispanic African American race/ethnicity, and low education. In contrast, a high score on“Infant guide-line solids”pattern was correlated with high household income, maternal non-Hispanic white race/ethnicity, and high education. A high score on “Formula/ baby cereal” pattern was correlated with emergency cesarean section, infant’s enrollment in WIC program, maternal older age, Asian/Pacific Islander
race/ethnicity, first childbirth, and low gestational weight gain. A high score on “High dairy”pattern was correlated with lower birth weight, methods of births other than vaginal–non-induced, mater-nal non-Hispanic white race/ethnicity, low education, being employed, and obesity.
Dietary Patterns and Infant Growth
Table 6 shows the estimated associa-tions between 6-month dietary patterns and change in infant growth outcomes from age 6 to 12 months from multi-variable linear regression models. Both“High sugar/fat/protein”and“High dairy/regular cereal” dietary patterns at age 6 months were associated unfavorable infant growth patterns (ie, being shorter and fatter). Specifi -cally, they were associated with smaller increase in length-for-age z score (adjustedbper 1 unit dietary pattern score,21.36 [95% CI,22.35 to20.37] and 20.30 [20.54 to 20.06], res-pectively), while greater increase in BMIzscore (1.00 [0.11 to 1.89] and 0.32 [0.10 to 0.53], respectively) from age
6 to 12 months, after adjusting for the corresponding growth measure at age 6 months, other dietary patterns, and potential confounders. The“Formula” dietary pattern at age 6 months was as-sociated with greater increase in BMI zscore (0.25 [0.09 to 0.40]) from age 6 to 12 months (fatter); but it was not associ-ated with change in length-for-agezscore (0.01 [20.16 to 0.18]) from age 6 to 12 months (normal linear growth). The “Infant guideline solids”pattern was not associated with change in length-for-agezscore (0.12 [20.05 to 0.29]) (normal linear growth) or BMIzscore (0.06 [20.09 to 0.22]) (normal body mass growth) from age 6 to 12 months.
DISCUSSION
In this national and prospective sample, we identified 4 dietary patterns at age 6 and 12 months from the 18 original types of foods commonly consumed by US infants. As we expected, 1 pattern was milk-based (“Formula,” or not breastfeeding), 2 contained unhealthy solids (“High sugar/fat/protein,” “High
TABLE 3 Infant Food Intake and Dietary Patterns at Age 12 Months (N= 1445) Weekly Eater,
n(%)
Mean Intake (SD), Serving/Week
Factor Loading on Dietary Patterna
1 - High Sugar/Fat/Protein
2 - Infant Guideline Solids
3 - Formula/Baby Cereal
4 - High Dairy
Food group
Breast milk 374 (25.9) 0.97 (1.96) — — 20.40 20.75
Formula 486 (33.6) 0.96 (1.66) — — 0.79 —
Cow’s milk 1191 (82.4) 2.31 (1.70) — — — 0.76
Other milk (eg, soy, rice, goat) 97 (6.7) 0.12 (0.58) — — — —
Other dairy foods 1224 (84.7) 1.04 (0.83) — 0.42 — —
Other soy foods 66 (4.6) 0.03 (0.21) — — — —
100% fruit/vegetable juice 1095 (75.8) 0.94 (0.89) — — — 20.42
Sweet drinks 223 (15.4) 0.11 (0.38) 0.58 — — —
Baby cereal 662 (45.8) 0.53 (0.86) — — 0.60 —
Non-baby cereals/starches 1376 (95.2) 1.87 (1.14) — 0.49 — —
Fruit 1424 (98.6) 1.81 (0.86) — 0.82 — —
Vegetables 1426 (98.7) 1.72 (0.79) — 0.83 — —
French fries 651 (45.1) 0.11 (0.19) 0.58 — — —
Meat/chicken 1358 (94.0) 1.22 (0.78) — 0.54 — —
Fish/shellfish 287 (19.9) 0.05 (0.13) — — — —
Nut foods 404 (28.0) 0.13 (0.33) 0.49 — — —
Eggs 910 (63.0) 0.27 (0.37) 0.59 — — —
Sweet foods 817 (56.5) 0.25 (0.37) 0.56 — — —
Eigenvalue — — 2.04 2.19 1.46 1.55
Variance explained — — 11.3% 12.1% 8.1% 8.6%
aOnly show loading factors with absolute values 0.4 or greater.
dairy”), and the other contained healthy solids (“Infant guideline solids”). Con-sistent with our previous knowledge, these dietary patterns varied sub-stantially by maternal education and race/ethnicity. As we hypothesized,“High sugar/fat/protein,” “High dairy/regular,” and“Formula”were associated with fast gain in infant adiposity reflected by BMI zscore. An unexpectedfinding was that “High sugar/fat/protein”and“High dairy/
regular” were associated with slower growth in infant length.
In line with the literature, we found evidence on sociodemographic dis-parities in infant dietary patterns.14,16
Maternal education seems to be an important correlate for infant dietary patterns, as mothers who had a low education level tended to feed their infant with “High sugar/fat/protein” diet at age 12 months. In previous
studies, mothers who had low educa-tion level tended to feed their infant with“adult”diet (bread, savory snacks, biscuits, and chips)14 or “basic
combi-nation”diet (white bread, milk, spreads, juice, and ice-cream),15which were also
unhealthy or age-inappropriate dietary patterns. Mothers of low education level might lack the needed nutrition knowl-edge for their infant, which could cause them to practice unhealthy infant feeding,
TABLE 4 Significant Correlates of Infant Dietary Patterns at Age 6 Months (N= 1378)
Correlate Difference in the Score of Dietary Pattern at Age 6 Months (95% CI)a
1 - High Sugar/Fat/Protein 2 - Infant Guideline Solidsb 3 - Formula 4 - High Dairy/Regular Cereal
Child
Female gender — 20.14 (20.24 to20.04) — 20.12 (20.21 to20.03)
Birth weight, g — — 20.20 (20.30 to20.10) —
Gestational age, wk — — — —
Method of birth
Vaginal, non-induced — Reference Reference —
Vaginal, induced — 0.14 (0.02 to 0.26) 0.13 (0.01 to 0.24) —
Planned cesarean section — 20.02 (20.17 to 0.12) 0.19 (0.05 to 0.33) — Emergency cesarean section — 0.22 (0.05 to 0.40) 0.25 (0.07 to 0.42) —
Enrolled in WIC program — — 0.51 (0.37 to 0.66) —
Household
Income, USD — — — —
,$25 000 — Reference Reference Reference
$25 000 to $39 999 — 0.06 (20.11 to 0.23) 0.16 (20.01 to 0.33) 20.20 (20.35 to20.05) $40 000 to $59 999 — 0.15 (20.02 to 0.32) 0.19 (0.01 to 0.36) 20.29 (20.45 to20.14) $60 000+ — 0.21 (0.05 to 0.38) 0.38 (0.21 to 0.56) 20.26 (20.41 to20.11) Mother
Age, y
18 to 24 Reference — — —
25 to 29 20.04 (20.10 to 0.02) — — —
30 to 34 20.06 (20.12 to 0.00) — — —
35+ 20.05 (20.11 to 0.02) — — —
Race/ethnicity
White, non-Hispanic Reference Reference — Reference
African American, non-Hispanic 0.08 (20.04 to 0.20) 0.01 (20.33 to 0.34) — 0.31 (0.01 to 0.61) Hispanic 0.09 (0.00 to 0.18) 0.11 (20.14 to 0.37) — 20.05 (20.28 to 0.18) Asian/Pacific Islander 0.05 (20.05 to 0.15) 20.32 (20.61 to20.03) — 20.15 (20.42 to 0.11) Others 20.07 (20.22 to 0.08) 20.47 (20.90 to20.04) — 0.05 (20.34 to 0.43) Educational level
High school or lower — Reference Reference Reference
1 to 3 y of college — 20.15 (20.31 to 0.00) 20.13 (20.28 to 0.02) 20.15 (20.29 to20.01) College graduate — 20.19 (20.36 to20.03) 20.20 (20.37 to20.04) 20.31 (20.45 to20.16) Post-graduate — 20.33 (20.53 to20.12) 20.33 (20.54 to20.13) 20.23 (20.42 to20.05)
Unmarried 0.07 (0.02 to 0.12) — 0.28 (0.13 to 0.43) —
Employed — 0.16 (0.05 to 0.27) 0.17 (0.06 to 0.28) —
Parity
Nulliparous — — Reference —
1 previous birth — — 20.03 (20.16 to 0.10) —
2+ previous births — — 20.21 (20.36 to20.07) —
Pre-pregnancy BMI, kg/m2
Normal/underweight (,25) — — Reference —
Overweight (25–29.9) — — 20.16 (20.30 to20.01) —
Obese ($30) — — 20.07 (20.20 to 0.07) —
aEstimates from multivariable linear regression model; significant if 95% CI does not cross 0.00. bIncluding fruits, vegetables, baby cereal, and meats.
which emulates their own poor personal dietary choices.14,34 Additionally, our
analysis also showed that non-Hispanic African American women tended to feed their infant with unfavorable diet (ie, “High dairy/regular cereal” at age 6 months and“High sugar/fat/protein”at age 12 months). Most foods in these 2 dietary patterns, such as cow’s milk and other dairy foods, non-baby cereals,
sweet drinks, French fries, and sweet foods, are discouraged by the AAP guidelines to be offered to infants.22,35
Infant formula is on the list of WIC-eligible food and is free to low-income households.36 This might explain our
observation that enrollment in the WIC program was associated with high consumption of“Formula”pattern at age 6 months and “Formula/baby cereal”
pattern at age 12 months. After ad-justing for WIC enrollment and other sociodemographics, we found that in-fants from low-income households were more likely to be fed “High sugar/fat/ protein” diet, possibly because of the relatively low price of these foods and family dietary habit.
In addition, we observed notable dif-ferences in the correlates of dietary
TABLE 5 Significant Correlates of Infant Dietary Patterns at Age 12 Months (N= 1275)
Correlate Difference in the Score of Dietary Pattern at Age 12 Months (95% CI)a
1 - High Sugar/Fat/Protein 2 - Infant Guideline Solidsb 3 - Formula/Baby Cereal 4 - High Dairy
Child
Birth weight, g — — — 20.10 (20.30 to 0.00)
Method of birth
Vaginal, non-induced Reference — Reference Reference
Vaginal, induced 0.14 (0.03 to 0.26) — 0.05 (20.07 to 0.18) 0.22 (0.10 to 0.35) Planned cesarean section 20.03 (20.17 to 0.10) — 0.03 (20.11 to 0.18) 0.21 (0.06 to 0.36) Emergency cesarean section 20.03 (20.20 to 0.13) — 0.32 (0.13 to 0.50) 0.25 (0.07 to 0.44)
Enrolled in WIC program — — 0.24 (0.12 to 0.37) —
Household Income, USD
,$25 000 Reference Reference — —
$25 000 to $39 999 20.33 (20.49 to20.18) 0.00 (20.17 to 0.18) — — $40 000 to $59 999 20.35 (20.51 to20.19) 0.22 (0.04 to 0.39) — —
$60 000+ 20.43 (20.58 to20.27) 0.17 (0.00 to 0.34) — —
Mother Age, y
18 to 24 — — Reference —
25 to 29 — — 20.07 (20.23 to 0.10) —
30 to 34 — — 0.22 (0.04 to 0.39) —
35+ — — 0.40 (0.21 to 0.60) —
Race/ethnicity
White, non-Hispanic Reference Reference Reference Reference
African American, non-Hispanic 0.41 (0.13 to 0.70) 20.19 (20.50 to 0.12) 0.15 (20.15 to 0.45) 20.10 (20.41 to 0.22) Hispanic 0.12 (-0.11 to 0.35) 20.26 (20.50 to20.01) 0.12 (20.12 to 0.36) 0.14 (20.11 to 0.40) Asian/Pacific Islander 0.17 (20.15 to 0.49) 20.51 (20.85 to20.16) 0.38 (0.05 to 0.71) 20.46 (20.81 to20.10) Others 20.02 (20.41 to 0.38) 0.60 (0.17 to 1.03) 0.21 (20.21 to 0.62) 20.44 (20.88 to 0.00) Educational level
High school or lower Reference Reference — Reference
1 to 3 y of college 20.20 (20.35 to20.06) 0.15 (0.00 to 0.31) — 20.21 (20.37 to20.05) College graduate 20.34 (20.49 to20.19) 0.25 (0.08 to 0.41) — 20.33 (20.49 to20.17) Post-graduate 20.42 (20.62 to20.23) 0.39 (0.18 to 0.60) — 20.54 (20.74 to20.33)
Employed — — — 0.23 (0.12 to 0.35)
Parity
Nulliparous — — Reference —
1 previous birth — — 20.26 (20.39 to20.13) —
2+ previous births — — 20.47 (20.61 to20.33) —
Pre-pregnancy BMI, kg/m2
Normal/underweight (,25) — — — Reference
Overweight (25–29.9) — — — 0.03 (20.10 to 0.16)
Obese ($30) — — — 0.14 (0.01 to 0.28)
GWG
Low — — Reference —
Normal — — 20.15 (20.30 to20.01) —
Excessive — — 20.12 (20.26 to 0.02) —
aEstimates from multivariable linear regression model; significant if 95% CI does not cross 0.00. bIncluding fruits, vegetables, dairy, regular cereal, and meats.
patterns between age 6 and 12 months. These differences may be explained by the fact that the optimal diet during infancy should be age-tailored tofit the infant’s growth and nutritional need, status of teeth growth, ability of chewing and other eating skills, and allergic sensitivity. For example, higher maternal education was associated with lower score on “Infant guideline solids” at age 6 months, but with higher score on the same dietary pat-tern at age 12 months. This seemingly paradoxical phenomenon might be explained by that although solid foods of this pattern are relatively healthy, they should be used in moderation during mid-infancy so that they will not com-pete with or replace breastfeeding at age 6 months when breast milk is still the preferred food for infants.37
Edu-cated mothers may prefer breast milk over these“healthy”solid foods at age 6 months, but gradually increase them with age to a high level at age 12 months.
Infant diet plays an important role in infant growth. As expected, we found that“High sugar/fat/protein”and“High dairy/regular cereal” diet patterns were associated with greater increase in weight-for-lengthzscore, an indirect measure for adiposity. This may be at-tributable to the excessive caloric in-take from these high-energy-density foods.38High protein intake by infants
could lead to accelerated growth and increased adipose tissue (“the early protein hypothesis”), possibly by stim-ulating secretion of insulin-like growth factor 1 and cell proliferation.39Rapid
infant weight gain, especially fat mass gain, is a major concern, as it is asso-ciated with obesity later in life.27,28,40
Interestingly, both “High sugar/fat/ protein”and“High dairy/regular cereal” diet patterns were associated with slower length (linear) growth. These associations might just be attributable to random error or residual confounding such as genetics, shared family habits
(eg, poor diet, poor sleep), and/or poor home environment limiting infant move-ments (eg, small home space, poor house structure).41 They might also be
attributable to 1 of the intrinsic limitations of the principle component analysis (ie, it sometimes generates a biologically im-plausible conclusion). If not, they might be explained by the real biological effects (eg, calcium, vitamin D, growth hormone) of some special nutritional composition of these 2 dietary patterns on infant length growth. “High sugar/fat/protein” foods are often palatable and could easily dominate the infant’s diet by competing with other more nutritious foods rich in calcium and vitamin D (essential for bone growth) and consequently inhibit infant length growth. For example, research has shown that high sugar intake is as-sociated with insufficient intake of cal-cium and iron among young children.42,43
“High dairy/regular cereal” diet at age 6 months is considered as age-inappropriate foods by the AAP.44The
high protein content in cow’s milk can irritate the lining of the digestive system of an infant, which can result in malabsorption of micronutrients such as calcium. Another possible explanation is that short stature or slow length growth itself could alter feeding behavior; some mothers may offer energy-dense foods in an effort to make their infant grow faster. But this reverse causality was less likely in our prospective analysis in which a dietary pattern at age 6 months was the exposure and change in length-for-agez score from age 6 to 12 months was the outcome.
In line with previous research,45 we
found the“Formula”dietary pattern was
associated with greater adiposity
accu-mulation during late infancy, indicated by greater increase in BMIzscores from
age 6 to 12 months. This may be attrib-utable to low self-regulation of food
in-take and over-consumption of energy in
formula-fed infants.46,47
TABLE 6 Associations Between Dietary P atterns at Age 6 Months and Change in Infant Gr owth Outcomes Fr om Age 6 to 12 Months ( N = 530) Dietar y pat tern at age 6 mo Change in Leng th-F or-Age Z Scor e Fr om 6 to 12 Month s (95% CI) a Cha nge in BMI Z Scor e Fr om 6 to 12 Mo nths (95% CI) a b in basic model b b in other -dietary-p atte rn-adjust ed mod el c b in co nfoun ders-adju sted model d b in basic mod el b b in other -dieta ry-patter n-adjust ed mod el c b in confoun ders-adju sted model d 1 -High sugar/fat/pr otein 2 1.04 ( 2 1.96 to 2 0.13) 2 1.38 ( 2 2.36 to 2 0.41) 2 1.36 ( 2 2.35 to 2 0.37) 0.70 ( 2 0.14 to 1.53) 1.13 (0.25 to 2.01) 1.00 (0. 11 to 1.89) 2 -Infant gui deline solids e 0.13 ( 2 0.03 to 0.30) 0.10 ( 2 0.07 to 0.27) 0.12 ( 2 0.05 to 0.29) 0.05 ( 2 0.10 to 0.21) 0.09 ( 2 0.06 to 0.24) 0.06 ( 2 0.09 to 0.22) 3 -Form ula 2 0.02 ( 2 0.19 to 0.15) 2 0.01 ( 2 0.18 to 0.16) 0.01 ( 2 0.16 to 0.18) 0.29 (0.13 to 0.44) 0.28 (0.13 to 0.43) 0.25 (0. 09 to 0.40) 4 -High dairy/r egular cer eal 2 0.19 ( 2 0.41 to 0.03) 2 0.30 ( 2 0.53 to 2 0.06) 2 0.30 ( 2 0.54 to 2 0.06) 0.24 (0.04 to 0.44) 0.34 (0.13 to 0.55) 0.32 (0. 10 to 0.53) aEstimates fr om multivariable linear regr ession models; signi fi cant if 95% CI does not cr oss 0.00. bAdjusted for corresponding gro wth m easure at 6 m onths. cAdjusted for corresponding growth measure at 6 m onths and the other 3 dietary patterns. dAdjusted for corresponding growth measur e at 6 months; the other 3 dietary patterns; household income; maternal age, race/ethnicity ,education lev el, pr e-pr egnancy BMI, gestational diabetes, gestational weight gain; and child gender and g estational
age. eIncluding
We found the “Infant guideline solids” pattern was not associated with length-for-age or BMIzscore from age 6 to 12 months in our sample, suggesting that it could promote normal linear and body mass growth in infancy that met WHO Child Growth Standards. The UK study reported that infants who had high consumption of “infant feeding guide-lines” foods (fruit, vegetables, and home-prepared foods) at age 6 months gained weight more rapidly from age 6 to 12 months,17but in a later study they
found that “infant guidelines” dietary pattern at age 12 months was associ-ated with higher lean mass index, but not with BMI or fat mass index at age 4 years.18 Taken together, it seems that
“Infant guideline solids”dietary pattern is beneficial to infant growth by selec-tively promoting lean mass growth without increasing the risk for obesity.
This analysis had several limitations. First, although the IFPS II sample was national, it might not represent the total US population, because the sample was not randomly obtained, rather it was based on customer opinion panel.20
Secondly, the IFPS II only collected the information on the frequency of 18 com-mon food groups, not specific foods
con-sumed or portion size.20Thirdly, maternal
reports of infant diet and clinically mea-sured growth outcomes were subject to recall bias.48Fourthly, there was
consid-erable attrition and missing data at age 6 and 12 months, which could threaten the generalizability of our findings. Particu-larly, our analytic sample for the final growth analysis over-represented non– low-income households and white and more educated mothers. Fifthly, the principle component analysis was per-formed in an overlapping but different (larger) subsample than thefinal growth analysis. Although this approach was needed to generate more robust dietary patterns, it was subject to mismatch of main dietary patterns between the 2 subsamples. Sixthly, we did not include maternal diet in the analysis owing to its large amount of missing data (.50%) by study design.20Lastly, our
analysis did not adjust for paternal ge-netic contribution (eg, weight and height) to infant growth.
CONCLUSIONS
In summary, distinct dietary patterns could be identified among US infants as early as age 6 months. These patterns varied considerably by
sociodemo-graphics, especially by maternal edu-cation and race/ethnicity. Although existing evidence is insufficient for us to make a solid recommendation on the optimal dietary pattern(s) for US infants, a combination of prolonged breastfeeding and gradual introduction of“Infant guideline solids”(vegetables, fruits, baby cereal, and meat) can be a promising candidate of healthy di-etary pattern for infants after 6 months of age based on our analysis and others. Our advice to parents is to introduce “Infant guideline solids” gradually after age 6 months so that these solids will not completely replace breastfeeding (which should be continued until at least age 12 months). For example, at each meal the mother can try to breastfeed the infant
first and then use these guideline solids if the infant is still hungry.
ACKNOWLEDGMENTS
The authors appreciate Dr Leonard H. Epstein for providing critical comments on data analysis and the manuscript. The authors thank the CDC staff for pro-viding access to raw data and guidance of data use. The IFPS II study was con-ducted by the US Food and Drug Admin-istration and the CDC.
REFERENCES
1. Hetherington MM, Cecil JE, Jackson DM, Schwartz C. Feeding infants and young children. From guidelines to practice.
Ap-petite. 2011;57(3):791–795
2. Grummer-Strawn LM, Scanlon KS, Fein SB. Infant feeding and feeding transitions during the first year of life. Pediatrics. 2008;122(suppl 2):S36–S42
3. Smithers LG, Golley RK, Brazionis L, Lynch JW. Characterizing whole diets of young children from developed countries and the association between diet and health: a sys-tematic review.Nutr Rev. 2011;69(8):449–467 4. World Health Organization. The Optimal Duration of Exclusive Breastfeeding. Report of
the Expert Consultation. Geneva, Switzerland:
World Health Organization; 2002
5. Eidelman AI, Schanler RJ, Johnston M, et al; Section on Breastfeeding. Breastfeeding and the use of human milk. Pediatrics.
2012;129(3). Available at: www.pediatrics. org/cgi/content/full/129/3/e827
6. Huh SY, Rifas-Shiman SL, Taveras EM, Oken E, Gillman MW. Timing of solid food intro-duction and risk of obesity in preschool-aged children. Pediatrics. 2011;127(3). Available at: www.pediatrics.org/cgi/ content/full/127/3/e544
7. van Rossem L, Kiefte-de Jong JC, Looman CW, et al. Weight change before and after the introduction of solids: results from a longitudi-nal birth cohort.Br J Nutr. 2013;109(2):370–375 8. Burdette HL, Whitaker RC, Hall WC, Daniels SR. Breastfeeding, introduction of comple-mentary foods, and adiposity at 5 y of age.
Am J Clin Nutr. 2006;83(3):550–558
9. US Department of Agriculture. Human UDoHa, Services. Dietary Guidelines for
Americans, 2010, 7th ed. Washington, DC:
US Government Printing Office; 2010
10. Birch LL, Doub AE. Learning to eat: birth to age 2 y.Am J Clin Nutr. 2014;99(3):723S–728S 11. Noble S, Emmett P. Differences in weaning practice, food and nutrient intake between breast- and formula-fed 4-month-old infants in England.J Hum Nutr Diet. 2006; 19(4):303–313
12. Hu FB. Dietary pattern analysis: a new di-rection in nutritional epidemiology. Curr
Opin Lipidol. 2002;13(1):3–9
13. Newby PK, Tucker KL. Empirically derived eating patterns using factor or cluster analysis: a review. Nutr Rev. 2004;62(5): 177–203
15. Bell LK, Golley RK, Daniels L, Magarey AM. Dietary patterns of Australian children aged 14 and 24 months, and associations with socio-demographic factors and adi-posity.Eur J Clin Nutr. 2013;67(6):638–645 16. Betoko A, Charles MA, Hankard R, et al;
EDEN mother-child cohort study group. In-fant feeding patterns over thefirst year of life: influence of family characteristics.Eur
J Clin Nutr. 2013;67(6):631–637
17. Baird J, Poole J, Robinson S, et al; South-ampton Women’s Survey Study Group. Milk feeding and dietary patterns predict weight and fat gains in infancy.Paediatr Perinat
Epidemiol. 2008;22(6):575–586
18. Robinson SM, Marriott LD, Crozier SR, et al; Southampton Women’s Survey Study Group. Variations in infant feeding practice are associated with body composition in child-hood: a prospective cohort study. J Clin
Endocrinol Metab. 2009;94(8):2799–2805
19. Gale CR, Martyn CN, Marriott LD, et al; Southampton Women’s Survey Study Group. Dietary patterns in infancy and cognitive and neuropsychological function in child-hood. J Child Psychol Psychiatry. 2009;50 (7):816–823
20. Fein SB, Labiner-Wolfe J, Shealy KR, Li R, Chen J, Grummer-Strawn LM. Infant Feeding Practices Study II: study methods.Pediatrics. 2008;122(suppl 2):S28–S35
21. World Health Organization.Complementary Feeding: Report of the Global Consultation, and Summary of Guiding Principles for Complementary Feeding of the Breastfed
Child. Geneva, Switzerland: World Health
Organization; 2002
22. American Academy of Pediatrics. Infant— food and feeding. Available at: www.aap. org/en-us/advocacy-and-policy/aap-health- initiatives/HALF-Implementation-Guide/Age-Specific-Content/Pages/Infant-Food-and-Feeding. aspx. Accessed January 31, 2014
23. Bright Futures/American Academy of Pediat-rics. Periodicity schedule—recommendations for preventive pediatric health care. Available at: www.aap.org/en-us/professional-resources/ practice-support/Pages/PeriodicitySchedule. aspx. Accessed July 8, 2014
24. Institute of Medicine and National Research Council. Weight Gain During Pregnancy:
Reexamining the Guidelines. Washington,
DC: The National Academies Press; 2009 25. WHO Multicentre Growth Reference Study
Group. WHO Child Growth Standards based on length/height, weight and age. Acta
Paediatr Suppl. 2006;450:76–85
26. Grummer-Strawn LM, Reinold C, Krebs NF; Centers for Disease Control and Prevention (CDC). Use of World Health Organization and CDC growth charts for children aged
0-59 months in the United States. MMWR
Recomm Rep. 2010;59(RR-9):1–15
27. Sovio U, Kaakinen M, Tzoulaki I, et al. How do changes in body mass index in in-fancy and childhood associate with cardiometabolic profile in adulthood? Find-ings from the Northern Finland Birth Cohort 1966 Study.Int J Obes (Lond). 2014;38(1): 53–59
28. Taveras EM, Rifas-Shiman SL, Belfort MB, Kleinman KP, Oken E, Gillman MW. Weight status in the first 6 months of life and obesity at 3 years of age.Pediatrics. 2009; 123(4):1177–1183
29. Joliffe IT, Morgan BJ. Principal component analysis and exploratory factor analysis.
Stat Methods Med Res. 1992;1(1):69–95
30. Hu FB, Rimm EB, Stampfer MJ, Ascherio A, Spiegelman D, Willett WC. Prospective study of major dietary patterns and risk of cor-onary heart disease in men.Am J Clin Nutr. 2000;72(4):912–921
31. Perneger TV. What’s wrong with Bonferroni adjustments.BMJ. 1998;316(7139):1236–1238 32. Feise RJ. Do multiple outcome measures
require p-value adjustment?BMC Med Res
Methodol. 2002;2:8
33. Adair LS, Martorell R, Stein AD, et al. Size at birth, weight gain in infancy and childhood, and adult blood pressure in 5 low- and middle-income-country cohorts: when does weight gain matter?Am J Clin Nutr. 2009;89 (5):1383–1392
34. Vereecken CA, Keukelier E, Maes L.
In-fluence of mother’s educational level on food parenting practices and food habits of young children. Appetite. 2004;43(1): 93–103
35. Greer FR, Sicherer SH, Burks AW; American Academy of Pediatrics Committee on Nu-trition; American Academy of Pediatrics Section on Allergy and Immunology. Effects of early nutritional interventions on the development of atopic disease in infants and children: the role of maternal dietary restriction, breastfeeding, timing of intro-duction of complementary foods, and hydrolyzed formulas.Pediatrics. 2008;121 (1):183–191
36. United States Department of Agriculture. WIC food packages—regulatory require-ments for WIC-eligible foods. Available at: www.fns.usda.gov/wic/wic-food-packages-regulatory-requirements-wic-eligible-foods. Accessed July 8, 2014
37. Heinig MJ, Nommsen LA, Peerson JM, Lonnerdal B, Dewey KG. Intake and growth of breast-fed and formula-fed infants in relation to the timing of introduction of complementary foods: the DARLING study. Davis Area Research on Lactation, Infant
Nutrition and Growth.Acta Paediatr. 1993; 82(12):999–1006
38. Ong KK, Emmett PM, Noble S, Ness A, Dunger DB, Team AS; ALSPAC Study Team. Dietary energy intake at the age of 4 months predicts postnatal weight gain and childhood body mass index. Pediatrics. 2006;117(3). Available at: www.pediatrics. org/cgi/content/full/117/3/e503
39. Koletzko B, von Kries R, Closa R, et al; European Childhood Obesity Trial Study Group. Lower protein in infant formula is associated with lower weight up to age 2 y: a randomized clinical trial.Am J Clin Nutr. 2009;89(6):1836–1845
40. Ong KK, Loos RJ. Rapid infancy weight gain and subsequent obesity: systematic reviews and hopeful suggestions.Acta Paediatr. 2006; 95(8):904–908
41. Liu YX, Jalil F, Karlberg J. Risk factors for impaired length growth in early life viewed in terms of the infancy-childhood-puberty (ICP) growth model.Acta Paediatr. 1998;87 (3):237–243
42. Kranz S, Smiciklas-Wright H, Siega-Riz AM, Mitchell D. Adverse effect of high added sugar consumption on dietary intake in American preschoolers.J Pediatr. 2005;146 (1):105–111
43. Ruottinen S, Niinikoski H, Lagstrom H, et al. High sucrose intake is associated with poor quality of diet and growth between 13 months and 9 years of age: the special Turku Coronary Risk Factor Intervention Project.
Pediatrics. 2008;121(6). Available at:
www.pe-diatrics.org/cgi/content/full/121/6/e1676 44. American Academy of Pediatrics. American
Academy of Pediatrics Committee on Nu-trition: the use of whole cow’s milk in infancy.Pediatrics. 1992;89(6 pt 1):1105– 1109
45. Dewey KG, Heinig MJ, Nommsen LA, Peerson JM, Lönnerdal B. Growth of breast-fed and formula-fed infants from 0 to 18 months: the DARLING Study.Pediatrics. 1992;89(6 pt 1): 1035–1041
46. Bartok CJ, Ventura AK. Mechanisms un-derlying the association between breast-feeding and obesity. Int J Pediatr Obes. 2009;4(4):196–204
47. Hester SN, Hustead DS, Mackey AD, Singhal A, Marriage BJ. Is the macronutrient intake of formula-fed infants greater than breast-fed infants in early infancy?J Nutr Metab. 2012;2012:891201
DOI: 10.1542/peds.2014-1045 originally published online October 13, 2014;
2014;134;e1387
Pediatrics
Services
Updated Information &
http://pediatrics.aappublications.org/content/134/5/e1387 including high resolution figures, can be found at:
References
http://pediatrics.aappublications.org/content/134/5/e1387#BIBL This article cites 38 articles, 15 of which you can access for free at:
Subspecialty Collections
http://www.aappublications.org/cgi/collection/nutrition_sub
Nutrition
http://www.aappublications.org/cgi/collection/epidemiology_sub
Epidemiology
sub
http://www.aappublications.org/cgi/collection/fetus:newborn_infant_
Fetus/Newborn Infant
following collection(s):
This article, along with others on similar topics, appears in the
Permissions & Licensing
http://www.aappublications.org/site/misc/Permissions.xhtml in its entirety can be found online at:
Information about reproducing this article in parts (figures, tables) or
Reprints
DOI: 10.1542/peds.2014-1045 originally published online October 13, 2014;
2014;134;e1387
Pediatrics
Chuanbo Xie
Xiaozhong Wen, Kai Ling Kong, Rina Das Eiden, Neha Navneet Sharma and
Sociodemographic Differences and Infant Dietary Patterns
http://pediatrics.aappublications.org/content/134/5/e1387
located on the World Wide Web at:
The online version of this article, along with updated information and services, is
http://pediatrics.aappublications.org/content/suppl/2014/10/08/peds.2014-1045.DCSupplemental Data Supplement at:
by the American Academy of Pediatrics. All rights reserved. Print ISSN: 1073-0397.