Analysis of the role of General Practice in
preventing Avoidable Hospitalisation through
a multilevel approach
ABSTRACT
Objectives: To examine the relationship between Avoidable Hospitalisation (AH) and General Practitioners (GPs) organisation, prescriptions of diagnostic procedures and drugs. The study was carried out in the Lazio Region (Italy) within different organisational models of primary care (PC) delivery.
Methods: Secondary data of a set of health services provided by GPs delivered to the population included in the lists of GPs working in the Lazio region in 2008 were used. The indicator of AH was built by selecting fourteen amenable conditions to be considered as Ambulatory Care Sensitive Conditions (ACSCs). Age-adjusted hospitalisation rate for ACSCs by treating GP per 1’000 patients was calculated using the hospitalisation records of 2008. The relation between the rates of AH, acute and chronic conditions separately, and GPs organisation and the rate of prescriptions of diagnostic procedures and drugs per 100 patients were analysed through the use of a multilevel Poisson regression model, adjusted according to patients’ health status.
Results: The study included data from all the active GPs (4’837) in the Lazio Region and their 4’666’037 registered patients. The overall AH rate of the registered patients was 7.7 per 1’000, 2.2 for acute and 5.5 for chronic conditions. The amount of prescriptions of diagnostic procedures by GPs is associated with a 7% (IRR=0.93;95% C.I.:0.89-0.97) reduction of the chronic AH rate. Patients registered with GPs adhering to a team resulted in a decrease in hospitalisation rates of 5% (IRR= 0.95;95% C.I.:0.91-0.99) for avoidable acute conditions.
Conclusion: The study showed that the role of GPs in preventing AH for acute conditions may be substantial, particularly when team practice is performed and specifically when additional diagnostics are prescribed. The study provides further evidence in favour of the validity of AH as an outcome measure of quality and accessibility of primary care.
Key words: Avoidable Hospitalisation, Primary care, General Practice, Multilevel Model. Aldo Rosano (1), Walter Ricciardi (2), Jouke van der Zee (3)
(1) Roman Academy of Public Health, Rome, Italy
(2) Department of Public Health, University of the Sacred Heart, Rome, Italy
(3) Department of International Public Health, University of Maastricht, the Netherlands
CORRESPONDING AUTHOR: Aldo Rosano, Roman Academy of Public Health, Via Giovanni Nicotera, 29 - 00195 Rome, Italy, Tel. +39-06-85447195, Fax +39-06-85447358. E-mail: [email protected]
INTRODUCTION
It is presumed that the timely and effective provision of primary care (PC) can prevent hospitalisation for a group of conditions called ambulatory care sensitive conditions (ACSC). Such hospital admission is also named avoidable hospitalisation (AH). However, only a partial and undefined percentage of AH can be avoided through effective PC performance. The extent to which hospitalisations for ACSCs can be prevented, illustrated through the rate of AH, is an indicator that was originally developed in the USA [1] and then widely adopted by international health systems as a measure (result) of the accessibility and overall effectiveness of primary care [2].
Two recent systematic reviews on the issue had supported the hypothesis that additional PC resources are clearly associated with decreased hospitalisation for ACSC [3,4]. However, while the first review – Rosano et al. - essentially confirmed the validity of AH as an outcome measure of quality and accessibility of PC, the latter – Gibson et al. - concluded that “the relationship between PC resourcing and diabetes-related ACSC must still be considered inconclusive”.
PC organisation as well as PC based diagnostic activities and therapeutic interventions may considerably reduce ACSC and may also reduce costs of care [5]. For example, regular diabetes monitoring through HbA1c prescription may reduce hospitalisations of diabetic patients, [6] as well as prescription of spirometry is important for early detection of chronic obstructive pulmonary disease (COPD), reducing exacerbations and hospital admissions [7].
Factors that have demonstrated to influence the relationship between AH and primary care quality are, for example, the population health status, number of hospital beds and the prevalence of ACSCs – linked both to overall hospitalisation rate and use of ambulatory care services - as well as the socioeconomic conditions of the population [8]. In a recent structured review on a possible indicator clarification, clinical experts had cited diagnoses from prior hospitalisations as an important risk adjustment covariate [9].
Different types of data were previously used to investigate AH: data aggregated at different levels (regions or communities), patients’ individual data or data aggregated at care provider level (e.g. prescription behaviour of GPs; general practice organisation). Considering that the mechanisms are supposed to operate mainly at care provider level, this was the approach adopted.
The main aim of this study was to explore the relationships between selected primary care health services delivered by GPs - such as diagnostic and drugs prescriptions - and hospital admissions of their registered patients for ACSCs. A secondary aim was to investigate the relationship between specific diagnostic prescriptions with hospitalisation for the related conditions. The study
also evaluated the association between AH and the role PC organisation in preventing AH.
METHODS
Setting
Lazio is a region of central Italy (including Rome) with a population of 5’342’587 in 2008. Just as all the other Italian regions, a national health care coverage is provided to all its residents. Details of Italy and Lazio’s health care system can be found in the recent report of the European Observatory on Health Systems and Policies [10].
Study design and participants
A retrospective observational study was conducted with 4’837 GPs of the 4’897 GPs that were active in 2008 in the Lazio region, along with their 4’666’037 registered patients aged 18 or over, based on health administrative data that was collected for the year 2008. The average number of GPs per Local Health Unit LHU was 406, those per Health District HD was 88 from a high of 195 in the district of Rome A4 to a low of 9 in the district of Rieti 5.
Data sources
Information on the GPs was collected from the regional health administrative database. This specific database did not contain information on the health status or the access of health services of patients, which is readily available through a record linkage with the regional health information systems data. Details on the data sources are provided in Appendix 1.
Data selection and definitions
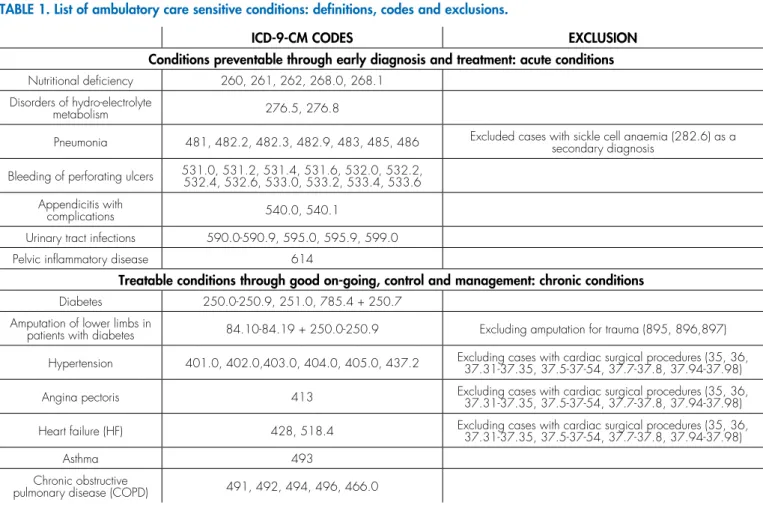
its precursor; the latter through good on-going control and management. The first group was labelled: acute ACSCs; the second group: chronic ACSCs. The list of conditions, along with the ICD9 codes used to identify them by the presence of selected codes in the main diagnosis field, are reported in Table 1. For specific analyses hospitalisation for single conditions, such as asthma, heart failure, diabetes and COPD has also been considered. The health status of registered patients was based on the morbidities reported as inpatient diagnosis - indicated as the average Charlson index score (CIS) [12] of relevant admissions per 100 registered patients.
The CIS was developed in 1987 based on 1-year mortality data from internal medicine patients admitted to a single New York Hospital. The index encompasses 19 medical conditions weighted 1 to 6, according to a relative risk of death within 12 months, with total scores ranging from 0 to 37. The index was calculated on all hospitalisation records of resident population in 2008 using an ad hoc algorithm developed with the Stata software [13]. Although the CIS was developed and validated in hospitalised patients, it has been adapted and validated in primary care and community populations [14]. The average score per 100 residents is than be used as a proxy of population health status, with higher scores indicating worse health status.
A deprivation index calculated at the Health District (HD) level - as a proxy of the socioeconomic level [15] (not available at the individual level), as well as the number of acute hospital beds per 1’000 residents, calculated at the Local Health Unit (LHU) level (that may influence the probability of being hospitalised) were also included in the model.
The deprivation index was calculated from the data collected from the 2001 General Census of Population and Housing. Five variables representing the multidimensionality of the social and material deprivation concept have been selected: low level of education, unemployment, non-home ownership, one parent family and overcrowding. Data were collected at census track level and then aggregate by HD. The index is calculated by summing standardised indicators.
Behaviour of GPs- the exposure factor - was measured through the number and type of prescribed diagnostic services per patient, the drug prescription behaviour [16] - expressed in terms of defined daily dose (DDD) per 100 patients - and the adherence to “team practice” groups, an organisational factor. Team practice is here intended as any modality GPs share clinic premises and clinical experience with their colleagues as provided for by the National Collective Agreements.
A group of experts of the Agency of Public Health
TABLE 1. List of ambulatory care sensitive conditions: definitions, codes and exclusions.
ICD-9-CM CODES EXCLUSION
Conditions preventable through early diagnosis and treatment: acute conditions
Nutritional deficiency 260, 261, 262, 268.0, 268.1
Disorders of hydro-electrolyte
metabolism 276.5, 276.8
Pneumonia 481, 482.2, 482.3, 482.9, 483, 485, 486 Excluded cases with sickle cell anaemia (282.6) as a secondary diagnosis
Bleeding of perforating ulcers 531.0, 531.2, 531.4, 531.6, 532.0, 532.2, 532.4, 532.6, 533.0, 533.2, 533.4, 533.6
Appendicitis with
complications 540.0, 540.1
Urinary tract infections 590.0-590.9, 595.0, 595.9, 599.0
Pelvic inflammatory disease 614
Treatable conditions through good on-going, control and management: chronic conditions
Diabetes 250.0-250.9, 251.0, 785.4 + 250.7
Amputation of lower limbs in
patients with diabetes 84.10-84.19 + 250.0-250.9 Excluding amputation for trauma (895, 896,897)
Hypertension 401.0, 402.0,403.0, 404.0, 405.0, 437.2 Excluding cases with cardiac surgical procedures (35, 36, 37.31-37.35, 37.5-37-54, 37.7-37.8, 37.94-37.98)
Angina pectoris 413 Excluding cases with cardiac surgical procedures (35, 36, 37.31-37.35, 37.5-37-54, 37.7-37.8, 37.94-37.98)
Heart failure (HF) 428, 518.4 Excluding cases with cardiac surgical procedures (35, 36, 37.31-37.35, 37.5-37-54, 37.7-37.8, 37.94-37.98)
Asthma 493
Chronic obstructive
of the Lazio region selected diagnostic services which are specific for diagnosis or monitoring of conditions: glycated haemoglobin (HbA1c) and diabetes; IgE allergy screening/spirometry and asthma [17]; spirometry and COPD [18]; echocardiogram and heart failure (HF) [19].
Statistical analysis
The main outcome of the study was the age-adjusted hospitalisation rate for ACSCs by treating GP (number of hospital admissions over the number of patients treated by GPs) per 1’000 patients. The unit of collection was the patient, while the unit of analysis was the GP. Therefore, all the indicators were calculated grouping by GP the data of registered patients. The analysis was carried out by the use of multilevel Poisson regression models, comprehensively and separately for acute and chronic conditions. The number of prescribed diagnostic prescriptions per 100 patients, the number of DDD per 100 patients, as well as being part of a team practice - as a cofactor -, health status of registered patients (measured through the CIS), deprivation index and the rate of hospital beds per 1’000 residents - as potential confounding factors - were included in each model. Further models were used to analyse the relationship between specific ACSCs and the prescription of related diagnostic ambulatory services: diabetes and glycated haemoglobin; asthma and allergy screening; COPD and spirometry; heart failure and echocardiogram. For each factor, an incidence rate ratio (IRR) had been calculated: values of IRR > 1 indicated an increased risk of hospitalisation, values of IRR < 1 indicated a decreased risk. Explanatory factors were recoded in quartiles before their inclusion into the models and an IRR was estimated for each quartile in comparison to the first quartile. The statistical significance of the results was set at the 5% level.
In order to have the different service-level factors considered a mixed-effects multilevel model was used, with two different cluster levels: LHUs and HDs. The multilevel regression considers that the individual probability (in this case, the GP) is also statistically dependent on the working area of GPs [20]. The median incidence rate ratio (MIRR) – which can be interpreted as the increased risk of AH that (in median) would occur if moved to another area/group of higher risk – had been adopted to test the need to use a multilevel model [21]. The random effects parameters were used to explain the correlation and variation of the latent mean values around the population average values.
RESULTS
The study included data from 4’837 GPs active in the Lazio Region in 2008, with an average number of 829 patients per GP, with a low of 687 in the Rome A LHU to a high of 969 in the LHU of Viterbo. The median
age of patients was 46 years; 52.7% of the patients were women. The number of hospital admissions of patients for ACSCs was 29’774 (7.1% of all admissions).
The hospitalisation rate (HR) for ACSCs, adjusted for age, was 7.73 per 1’000 overall and varied considerably among treating GPs: from 0 to 44.6 per 1’000. (Data not shown). The number of registered patients was 4’660’037, the entire adult population living in the Lazio region. HR for ACS chronic conditions varies substantially among the LHUs, with highest values in the area of Rieti, as well as for ACS acute conditions. The number of diagnostic procedures was quite heterogeneous among LHUs, with highest values in the LHUs of the city of Rome. The average number of prescribed DDD per 100 residents was lower with the LHUs in the province of Rome and higher in the city of Rome. The comorbidity index was slightly lower with the LHUs in the city of Rome and its province and higher with the LHU in Viterbo (Table 2).
Maps 1 and 2 represent respectively the distribution of the hospitalisation rates for ACS acute and chronic conditions by HDs. Clusters of high HRs for acute conditions are apparent in the HDs of Rieti, in the Northern districts of Viterbo and in four districts of the LHU RMH. High HRs for chronic conditions were found in the HDs of Rieti and in various HDs in the South of the region (RMG, Latina and Frosinone).
Patients followed by GPs working within a team practice showed a lower risk of being hospitalised for avoidable acute diseases (IRR= 0.95;95% C.I.:0.91-0.99) but not for avoidable chronic diseases (IRR= 1.00;95% C.I.:0.97-1.04) (Table 3).
The HR for avoidable chronic conditions was negatively associated with the number of prescribed diagnostic services (IRR=0.93;95% C.I.:0.89-0.97), while no association was found for avoidable acute conditions (Table 3).
The adjusting factors played a significant role: AH rates were linearly associated with quartiles both with the health status of registered patients and with the number of prescribed drugs. Significant associations with the outcome were also found with the deprivation, in particular, for chronic conditions.
A multilevel analysis revealed that there were significant changes in the estimation of parameters: the likelihood-ratio test that compares the multilevel Poisson model with the standard (marginal) Poisson regression model was significant (p<0.05). This justified the adoption of the multilevel model. The median incidence rate ratio (MIRR) indicated an average increase in the (overall) AH rate between any two districts of 17% and of 19% between any two LHUs. This showed certain variability among the rates by HD and LHU.
(IRR= 0.92;95% C.I.:0.89-0.95); asthma and allergy screening (IRR= 0.93;95% C.I.:0.83-1.04); asthma and spirometry (IRR= 0.93;95% C.I.:0.82-1.06); COPD and spirometry (IRR= 0.92;95% C.I.:0.89-0.95); heart failure and echocardiogram (IRR= 0.97;95% C.I.:0.96-0.99). (Details are presented in Appendix 2).
DISCUSSION
The study showed that drugs and diagnostic service prescriptions by GPs were associated with AH of their registered patients. The risk of hospitalisation decreased by 7% with patients assisted by GPs who were more likely to prescribe specific diagnostic procedures in order to monitor chronic diseases. On the other hand, a higher level of drug prescription is correlated with higher rates of AH. Therefore, we can argue that drug prescription behaviour has a completely different meaning from prescribing diagnostic procedures in relation to AH. A higher level of drug prescriptions may be related to (worse) population health status [22] or improper prescriptions [23].
The positive effect of the organisation of GPs in collaborative groups was clearly evident with acute avoidable hospitalisations.
A team practice can ensure the availability of GPs for additional hours per day and days per week, and may increase the levels of quality and the range of care. Increasing the daytime access of the practice also allows for a reduction in Emergency Department utilisation, with a consequent and immediate effect on hospital admissions [24].
As expected, the health status of registered patients had played a predominant role. It was strongly associated with the AH for both acute and chronic conditions. Deprivation – as contextual factor – also played a significant role. It was associated with higher rates of hospitalisation for ACSCs, in particular, for chronic conditions, independently of the role of GPs.
The findings on the prescriptions of diagnostic services from GPs are in accordance with the findings of previous studies which found, through the use of aggregated data, higher levels of diagnostic services in regions with lower rates of AH rates for chronic conditions [25]. In addition a considerable amount of resources can be saved from avoidable hospitalisations, thanks to preventative and diagnostic services for patients provided by Community Health Centres [26]. In the present study the strength of the evidence is quite substantial because we have been able to analyse the phenomenon directly from the source of the provision of PC: the GPs.
We found that the more specific diagnostics are prescribed, the lower the hospitalisation rates for related conditions: diabetes (associated with glycated haemoglobin), COPD (associated with spirometry) and heart failure (associated with echocardiograms). Poor control of glycated haemoglobin in diabetic patients is a recognised risk factor for complications and higher hospitalisations. In a previous study, Chen [27] found a correlation between socioeconomic factors and poorer control of serum glucose levels (high HbA1c scores) at inpatient admission. In our study, patients whose GP prescribed fewer HbA1c tests showed higher hospitalisation rates, even after controlling
TABLE 2. Number of assisted patients, age adjusted hospitalisation rates (HospR) for acute and chronic ACSCs per 1’000 people, average number of Charlson index score (CIS), diagnostic procedures (DP), defined daily dose (DDD) per 100 patients by Local Health Unit (LHU).
LHU N. of assisted patients HospR for chronic conditions
HospR for acute conditions
Average Charlson
index score DP DDD
Rome A (city) 423’659 1.93 4.65 0.61 77 52
Rome B (city) 570’002 2.01 4.37 0.62 92 27
Rome C (city) 474’479 1.94 4.25 0.65 87 30
Rome D (city) 472’722 1.78 4.34 0.60 84 26
Rome E (city) 426’391 2.66 5.38 0.58 85 28
Rome F (prov) 236’651 2.27 5.74 0.55 74 24
Rome G (prov) 377’612 1.99 5.93 0.62 68 23
Rome H (prov) 427’338 2.66 5.29 0.67 75 25
Viterbo 254’568 2.81 5.14 0.74 66 23
Rieti 131’801 3.08 8.12 0.63 65 28
Latina 450’198 2.07 6.89 0.56 69 27
Frosinone 414’618 1.87 5.58 0.59 58 25
for deprivation. Glycated haemoglobin (HbA1c) test and echocardiography are considered indicative of the quality of care delivered at primary care level respectively for
diabetes [28] and heart failure [29].
The limitations of the adopted statistical model rests on the fact that, as do all models, multilevel models necessarily
MAP 2. Distribution of the hospitalisation rates for ACS chronic conditions by Health Districts. Lazio region, 2008.
Legend
MAP 1. Distribution of the hospitalisation rates for ACS acute conditions by Health Districts. Lazio region, 2008.
simplify complex processes. The extent to which the group- and individual-level effects can be meaningfully separated depends on the model that hypothetically links them. If group attributes affect health they must get into the body and therefore are necessarily mediated through individual-level processes. Therefore, group-individual-level attributes cannot affect individuals independently of all individual level attributes, but this does not imply that group-level variables are reducible to individual-level variables. In addition, multilevel models generally do not allow for examination of
the full range of complex and reciprocal interrelationships between variables. Another complexity arises from the fact that individuals (GPs) may self-select themselves into some selected groups based on unmeasured individual characteristics are observed, making the interpretation of contextual effect problematic [30].
There is also a critical issue which concerns the registration of personal information in the HIS, which may have substantial implications during the procedures of record-linkage among archives. The Lazio region has at
TABLE 3. Measures of association (Incidence Rate Ratio IRR) among activity indicators of GPs [number of diagnostic procedures prescription (DPP) per 100 patients, drug prescription – measured through DDD per 100 patients - being part of work team practice] and the rates of avoidable acute, chronic and overall conditions, adjusted for registered patients’ health status measured through average case-mix Charlson index (CIS), deprivation - measured at Health District (HD) level - and the number of hospital beds per 1’000 – measured at Local Health Unit (LHU) level, with inferior (inf) and superior (sup) limits of 95% confidence interval and p values (p). Measures of clustering (Median Incidence Rate Ratio MIRR) obtained from multilevel models. Lazio Region, 2008.
ACUTE CONDITIONS CHRONIC CONDITIONS OVERALL
ASSOCIATED FACTORS IRR (inf sup) p IRR (inf sup) p IRR (inf sup) p
Number of DPP per 100 patients
1st quartile
(reference) 1.00 1.00 1.00
2nd quartile 1.04 0.98 1.10 0.29 0.96 0.92 1.00 0.03 0.98 0.95 1.01 0.21 3rd quartile 1.01 0.95 1.08 0.91 0.96 0.93 1.00 0.08 0.98 0.94 1.01 0.16 4th quartile 1.01 0.95 1.08 0.82 0.93 0.89 0.97 <0.01 0.95 0.92 0.99 <0.01
Number of DDD per 100 patients
1st quartile
(reference) 1.00 1.00 1.00
2nd quartile 0.99 0.92 1.06 0.28 1.05 1.02 1.09 <0.01 1.04 1.00 1.08 0.01
3rd quartile 1.08 1.02 1.14 0.01 1.08 1.04 1.13 <0.01 1.06 1.03 1.09 <0.01
4th quartile 1.13 1.06 1.20 <0.01 1.11 1.06 1.15 <0.01 1.11 1.08 1.15 <0.01
Average CIS 1st quartile (reference) 1.00 1.00 1.00
2nd quartile 1.15 1.08 1.23 <0.01 1.23 1.18 1.28 <0.01 1.21 1.16 1.25 <0.01
3rd quartile 1.34 1.26 1.43 <0.01 1.42 1.37 1.48 <0.01 1.40 1.35 1.45 <0.01
4th quartile 1.65 1.54 1.77 <0.01 1.77 1.69 1.85 <0.01 1.73 1.67 1.80 <0.01
Being part of
team practice No 1.00 1.00 1.00
Yes 0.95 0.91 0.99 0.05 1.00 0.97 1.04 0.84 0.99 0.96 1.02 0.51
HD level
Deprivation Not deprived HD 1.00 1.00 1.00
Deprived HD 1.10 1.04 1.16 <0.01 1.19 1.15 1.23 <0.01 1.16 1.13 1.19 <0.01
LHU Level
Number of hospital beds per 1,000 pop
IRR 1.02 1.01 1.03 <0.01 0.99 0.99 1.00 0.04 1.00 1.00 1.01 0.56
Measures of variation or
clustering
MIRR
(HD level) 1.11 1.20 1.17
MIRR
its disposal a large and complete set of data of health information services. Such data has been tested for consistency and can be considered extremely reliable [31].
Using large routinely collected data is subject to a number of potential biases, including those inherent in cross-section designs. Hospital discharge databases are not without problems that may limit their usefulness for research purposes, e.g. they have a relatively limited scope of clinical detail, may have inconsistent coding or inaccuracy of some socio-demographic data fields. Our study did not include data from patients admitted to private hospitals and this may further bias our results by under-counting admissions in more affluent HD. Moreover, data refer to 2008, some aspects of hospitalisations and PC assistance may have changed, even though no dramatic change is expected to be happened.
The validity of AH as outcome indicator of the quality of PC was firstly assessed by the Agency for Healthcare Research and Quality [32] and in Italy by various studies at national and regional level [11,25,33] as well as at HD level [34] by using the list of conditions recommended by AHRQ [33,34], or refinement of that adapted to the Italian context [11,25].
There is contrasting evidence on the effectiveness of work team practice compared to solo practice in regards to chronic disease management [35,36]. In a previous study conducted in six Italian regions, in terms of adherence to recommendations no impact was found with the management of diabetes and heart failure, while a slightly significant impact was observed in ischemic heart disease [37]. Conversely, in France doctors who work in a group practice prescribe the recommended tests for diabetes more often [38]. With our study, when AH as outcome measure was taken into consideration, the relationship between AH and GPs working as a team was, in fact, apparent only for acute conditions.
We found that work team practice seems to be an important predictor of primary care performance in Italy. The new associative forms among GPs should be encouraged, since they promote functional relationships between professionals, facilitate access for patients to services and propose effective and efficient models of comprehensive care for those suffering from chronic disease. The new organisational model of PC recently proposed in Italy (Law 189 dated November 8 2012 promoted by the Minister of Health Renato Balduzzi) followed this direction, allowing GPs to share their expertise, permit a more effective and efficient management of chronic diseases and improve the capacity to take charge of patients. However, its application into the Italian Health Systems is currently encountering numerous obstacles in its path [39].
ACKNOWLEDGEMENTS
The authors thank Dr Maria Balducci, Dr Ester Zantedeschi and Dr Carmelina Guerrera of Agency of
Public Health – Lazio Region for their valuable advice. The views expressed are those of the author(s) and not necessarily those of the Roman Academy of Public Health, or the Departments of Health of the University of the Sacred Heart of Rome or the University of Maastricht.
A preliminary version of this paper became part of a PhD thesis presented at Maastricht University on 22 December 2014 [40].
Conflict of Interest
No one declared.
REFERENCES
1. Weissman JS, Gatsonis C, Epstein AM. Rates of avoidable hospitalization by insurance status in Massachusetts and Maryland. JAMA 1992;268:2388–94.
2. van Loenen T, van den Berg M, Westert GP, Faber MJ. Organizational aspects of primary care related to avoidable hospitalization: a systematic review. Family Practice 2014;31:502. 3. Rosano A, Abo Loha C, Falvo R, et al. The relationship between
avoidable hospitalization and accessibility to primary care: a systematic review. Eur J Public Health 2013;23:356-60.
4. Gibson OR, Segal L, McDermott RA. A systematic review of evidence on the association between hospitalization for chronic disease related ambulatory care sensitive conditions and primary health care resourcing. BMC Health Services Research 2013;13:336. 5. Basu A, Brinson D. The effectiveness of interventions for reducing
ambulatory sensitive hospitalizations: a systematic review. Christchurch: Health Services Assessment Collaboration (HSAC), 2008. HSAC Report 1(6).
6. Smith DM, Weinberger M, Katz BP. A controlled trial to increase office visits and reduce hospitalizations of diabetic patients. J Gen Intern Med 1987:2;232–8.
7. O’Donnell DE, Aaron S, Bourbeau J, et al. Canadian Thoracic Society recommendations for management of chronic obstructive pulmonary disease—2007 update. Canadian Respiratory Journal 2007;14:5B–32B.
8. Saxena S, George J, Barber J, Fitzpatrick J, Majeed A. Association of population and practice factors with potentially avoidable admission rates for chronic diseases in London: cross sectional analysis. J R Soc Med 2006;99:81-9.
9. Davies S, McDonald KM, Schmidt E, Schultz E, Geppert J, Romano PS. Expanding the uses of AHRQ’s prevention quality indicators: validity from the clinician perspective. Med Care 2011;49:679–85. 10. Ferre F, De Belvis AG, Valerio L, et al. Italy: Health System Review.
Health Syst Transit 2014;16(4):1-168.
11. Pirani M, Schifano P, Agabiti N, Davoli M, Caranci N, Perucci CA. [Potentially avoidable hospitalisation in Bologna, 1997-2000: temporal trend and differences by income level] Epidemiol Prev 2006;30(3):169-77.
method of classifying prognostic comorbidity in longitudinal studies: development and validation. J Chronic Dis 1987;40:373–83. 13. Stagg V. CHARLSON: Stata module to calculate Charlson index
of comorbidity. Available from: http://EconPapers.repec.org/ RePEc:boc:bocode:s456719 [Accessed 2015].
14. Huntley AL1, Johnson R, Purdy S, Valderas JM, Salisbury C. Measures of multimorbidity and morbidity burden for use in primary care and community settings: a systematic review and guide. Ann Fam Med 2012;10:134-41.
15. Caranci N, Costa G. [A deprivation index in aggregate to be used on a national scale : justifications and index composition]. In: Costa G, Cislaghi C, Caranci N, editors. Le disuguaglianze sociali di salute. Problemi di definizione e di misura. Salute e Società. Milano: FrancoAngeli, 2009:58-78.
16. Campo K, De Staebel O, Gijsbrechts E, van Waterschoot W. Therapeutic drug prescription behavior: Decision process and marketing mix effects. University of Antwerp, 2002. Working Papers n. 44.
17. de Marco R, Bugiani M, Cazzoletti L, et al. The control of asthma in Italy. A multicentre descriptive study on young adults with doctor diagnosed current asthma. Allergy 2003:58:221–8.
18. Saad N, Sedeno M, Metz K, Bourbeau J. Early COPD Diagnosis in Family Medicine Practice: How to Implement Spirometry? Int J Family Med 2014;962901.
19. Kirkpatrick JN, Vannan MA, Narula J, Lang RM. Echocardiographic Applications in Heart Failure. J Am Coll Cardiol 2007;50:381-96. 20. Merlo J, Chaix B, Ohlsson H, et al. A brief conceptual tutorial
of multilevel analysis in social epidemiology: using measures of clustering in multilevel logistic regression to investigate contextual phenomena. J Epidemiol Community Health 2006;60:290–7. 21. Rabe-Hesketh S, Skrondal A. Multi-level and Longitudinal Modeling
using Stata, 2nd Edition. College Station, TX: Stata Press Publication, 2008.
22. Eggli Y, Desquins B, Seker E, Halfon P. Comparing potentially avoidable hospitalization rates related to ambulatory care sensitive conditions in Switzerland: the need to refine the definition of health conditions and to adjust for population health status. BMC Health Services Research 2014;14:25.
23. Sturmberg JP, Martin C. Handbook of Systems and Complexity in Health. New York: Springer Science & Business Media, 2013:548-9. 24. Lippi Bruni M, Mammi I, Ugolini C. Does the extension of primary
care practice opening hours reduce the use of emergency services? University of Bologna, 2014. Working Paper DSE N.978. 25. Rosano A, Lauria L, Viola G, et al. Hospitalization for ambulatory
care sensitive conditions and the role of primary care in Italian regions. Italian Journal of Public Health 2011;8:75-86.
26. Smith-Campbell B. A state funded community health center: Influence on emergency room use, avoidable hospitalizations and hospital expenses. The 132nd Annual Meeting of American Public Health Association, 2004 November 6-10, Washington DC.
27. Chen B, Eggleston K, Li H, Shah N, Wang J. An observational study of socioeconomic and clinical gradients among diabetes patients hospitalized for avoidable causes: evidence of underlying health disparities in China? International Journal for Equity in Health 2014;13:9.
28. National Institute for Health and Clinical Excellence (NICE). Type
2 diabetes The management of type 2 diabetes. December 2014. NICE clinical guideline 87.
29. National Institute for Health and Clinical Excellence (NICE). Chronic heart failure: Management of chronic heart failure in adults in primary and secondary care. August 2010. NICE clinical guideline 108. 30. Diez Roux AV. Multilevel analysis in public health research. Annual
Review of Public Health 2000;21:171–92.
31. Chini F, Pezzotti P, Orzella L, Borgia P, Guasticchi G. Can we use the pharmacy data to estimate the prevalence of chronic conditions? A comparison of multiple data sources. BMC Public Health 2011;11:688.
32. AHRQ Quality Indicators—Guide to Prevention Quality Indicators: Hospital Admission for Ambulatory Care Sensitive Conditions. Rockville, MD: Agency for Healthcare Research and Quality, 2001. AHRQ Pub No 02-R0203.
33. Rizza P, Bianco A, Pavia M, Angelillo IF. Preventable hospitalization and access to primary health care in an area of Southern Italy. BMC Health Serv Res 2007;7:134.
34. Manzoli L, Flacco ME, De Vito C, et al. AHRQ prevention quality indicators to assess the quality of primary care of local providers: a pilot study from Italy. European Journal of Public Health 2014;5:745–50.
35. Jaakkimainen RL, Barnsley J, Klein-Geltink J, Kopp A, Glazier RH. Did changing primary care delivery models change performance? A population based study using health administrative data. BMC Family Practice 2011;44:1-15.
36. Damiani G, Silvestrini G, Federico B, et al. A systematic review on the effectiveness of group versus single-handed practice. Health Policy 2013;113:180-7.
37. Visca M, Donatini A, Gini R, et al. Group versus single handed primary care: a performance evaluation of the care delivered to chronic patients by Italian GPs. Health Policy 2013;113:188-98. 38. Chauvel N, Le Vaillant M, Pelletier-Fleury N. Variation in HbA1c
prescription for patients with diabetes in French general practice: an observational study prior to the implementation of a P4P programme. Eur J Public Health 2013;23:61-6.
39. Paterlini M. Italy’s health system reforms on hold. The Lancet 2013;9872:1085–6.
40. Rosano A. The relationship between avoidable hospitalization and primary care. [PhD Thesis]. Maastricht: Maastricht University, 2014.
APPENDIX 1
INFORMATION ON DATA SOURCES
and private sector hospitals. The reported information includes patient demographics, sources of referrals to the services, diagnoses and coded procedures according to the clinical modification of the International Classification of Diseases and Related Problems, 9th revision (ICD-9-CM).
Most non-hospital medical care in Italy is provided on a fee for service basis, paid by the national health care insurance model. The data from the Information System of Ambulatory Services (ISAS) was used to measure the number and type of ambulatory services prescribed by GPs, who are considered the gatekeepers in the Italian health care system. For each service claim processed the ISAS indicated the date of service, item number of service, patient’s age, gender, postal zip code, GP name and code, amount charged by the provider and the possible co-payment and information relating to the provider.
The regional health authority subsidises the cost of drugs for most of the medical conditions of the residents. All the drugs provided through a prescription are registered in a regional database. The claims data were used to measure the use of medications and their compliances. Only drugs that qualified for subsidies were included, coded by the ATC code. The data on drugs include date, type of prescription, commercial name of drug (or name of drug substance), identification code of the prescriber (generally a GP) and of the patient, presence and type of payment exemption. A relational database resource has been created by linking
individual anonymised data from the archives of the Regional HIS: each patient’s record was associated with the specific GP treating them. The data linkage was performed according to national and regional norms on health data use by the Agency of Public Health of the Lazio region. The data was linked by deterministic linkage through the use of an encrypted version of the GPs identification code as a linkage key. GPs without any registered activity were excluded from the study.