The Optimization Problem of Product Mix
and Linear Programming Applications: Case
Study in the Apparel Industry
Gera Workie Woubante*
Bahir Dar University, Bahir Dar, Ethiopia
*Corresponding Author: Gera Workie Woubante: [email protected]
Abstract
Citation: Woubante G. W. (2017) The Optimization Problem of Product Mix and Linear
Programming Applications: Case Study in the Apparel Industry. Open Science Journal 2(2).
Received: 6th January, 2017
Accepted: 20th March, 2017
Published: 19th June, 2017
Copyright:© 2017 This is an
open access article under the terms of the Creative Commons
Attribution License, which permits unrestricted use, distribution, and reproduction in any medium, provided the original author and source are credited.
Funding: The author(s) received no specific funding for this work
Competing Interests: The author have declared that no competing interests exists.
Keywords:
Apparel sector, Linear programming, Lingo, Optimal,
Product mix.
Introduction
Companies in the world, including Ethiopia, have faced problems on optimization of production inputs. A company’s endurance in a competitive market closely depends on its ability to produce the highest quality products at the lowest possible cost (Kumar, 2010). Ezema and Amakom (2012) emphasized that organizations in the world are challenged by shortages of production inputs and low capacity utilization that can consequently lead to low production outputs. Companies have to create a management style to guide their performances in processing and resource utilization. Apparel manufacturing firm profit is significantly affected by the cost of resources and resource utilization (Arefayne and Pal, 2014). Linear programming is an operational research technique used to allocate optimally production resources for a firm’s best practices. It is the most widely used tool (Reeb and Leavengood, 1998) to determine optimal resource utilization. Different products require different amount of production resources having different costs and revenues at different stages of production. Thus, the linear programming problem (LPP) technique will be used to determine the product mix that will maximize the total profit at a specified time. It is the best method for determining an optimal solution among alternatives to meet a specified objective function limited by various constraints and restrictions (Shaheen and Ahmad, 2015). As Reeb and Leavengood (1998) stated, it is a planning process that allocates resources—labor, materials, machines, and capital—in the best possible way so that costs are minimized or profits are maximized. The LPP then becomes a problem of allocating scarce resources to products in a manner such that profits are at a maximum and/or costs are at a minimum (Yahya, 2004). However, managers in companies create gaps in adopting the method to allocate scarce resources among operations and providing quantitative analysis for each production period due to lack of awareness.
these customers have to be kept in mind when contemplating changes to the product mix. Finally, the industry probably faces limitations regarding the number of products it is able to offer. By focusing on providing the optimum product mix for its customers, it will be able to weed out slow sellers and make room for more appealing items.
In Ethiopia, the apparel sector is considered as one of the priority areas of the government‘s industrial development strategy (ETIDI, 2014). However, the sector has faced many challenges to determine product mix. It is confronted with inefficient utilization of resources that makes it difficult to ensure the optimal product mix for maximal profit, which would also fulfill customer needs. As noted by Samuel (2012), to modernize the apparel sector, performance was insignificant. Thus, apparel manufacturing companies must adopt operations research techniques to enhance best resource utilization that would result in optimal product mix and total profit. Thus, this paper focuses on product mix determination based on efficient resource utilization for the Ethiopian apparel sector by considering a garment factory in Ethiopia as a case company. The issue addressed here was to determine the product mix for optimal profit with available resources, using the linear programming technique LINGO 16.0, that the case company should produce for men wear: Polo shirt, basic T-shirt, mock neck T-shirt, short pants, and singlet. In line with this, the objective of the study was to suggest linear programming as a decision tool to determine the optimal product mix for maximum profit with available resources in the apparel sector.
Methodology
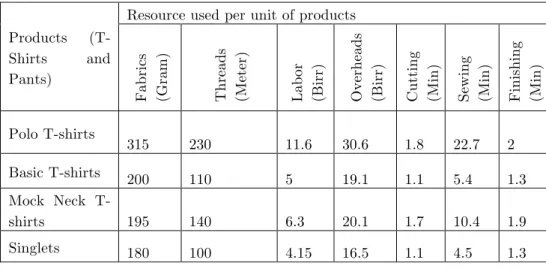
The data collection procedure was quantitative in nature and relied on face-to-face interviews with members of the management and line supervisors in accordance with existing records and merely amended to finalize the concepts relevant to the resources held and consumed and the production volume of each product in the case company. The relevant information on the amount of resources used per unit of each product during the month is summarized in Table 1.
Table 1: Resources needed per unit of product.
Products
(T-Shirts and
Pants)
Resource used per unit of products
Fa br ic s (G ra m ) Th re ad s (M ete r) La bo r (B ir r) Ov er he ad s (B ir r) Cu tti ng (M in ) Se w in g (M in ) Fi ni sh in g (M in ) Polo T-shirts
315 230 11.6 30.6 1.8 22.7 2
Basic T-shirts 200 110 5 19.1 1.1 5.4 1.3
Mock Neck
T-shirts 195 140 6.3 20.1 1.7 10.4 1.9
Source: 2015 Resources used per unit of products of the case apparel company
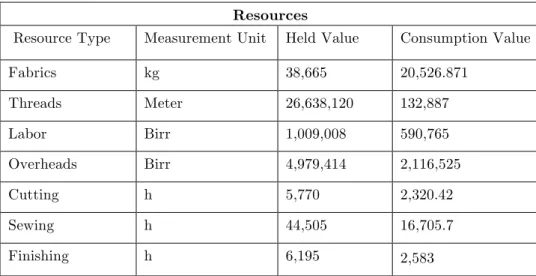
The ability to use resources (resource utilization) was recorded as the major constraints in the case apparel manufacturing unit. Seven constraints (fabrics, thread, labor, overheads, cutting, sewing, and finishing time) and five costumer orders for T-shirt products have been identified. Out of the resources used by the case apparel company, the major items held and consumed are shown in Table 2.
Table 2: Average monthly resources held and consumed in quantity/value terms
in Birr.
The demand and profit earned from each product during the month for the case apparel company are depicted in Table 3.
Table 3: Demand and profit earned.
Model Formulation
In formulating a given decision problem in mathematical form, one should try to comprehensively understand the problem (i.e., formulate a mental model) by carefully reading and re-reading the problem statement. While trying to understand the problem, the decision maker may decide that the model consists of linear relationships representing a firm’s objectives and resource constraints. However, the way we approach the problem is the same for a wide variety of decision making problems, and the size and complexity of the problem may differ. An LPP model consists of the following parameters:
Short Pants 280 200 7.5 37.5 2.6 20.1 2.6
Resources
Resource Type Measurement Unit Held Value Consumption Value
Fabrics kg 38,665 20,526.871
Threads Meter 26,638,120 132,887
Labor Birr 1,009,008 590,765
Overheads Birr 4,979,414 2,116,525
Cutting h 5,770 2,320.42
Sewing h 44,505 16,705.7
Finishing h 6,195 2,583
Po
lo
T
-Shi
rt
s
Ba
si
c
T
-Shi
rt
s
Mo
ck
N
ec
k
T
-sh
ir
ts
Si
ng
le
ts
Sh
or
t
P
an
ts
Demand 15886 23916 13319 25667 12864
Ø Decision variables that are mathematical symbols representing levels of activity of an operation.
Ø The objective function that is a linear mathematical relationship describing an objective of the firm, in terms of decision variables, that is to be maximized or minimized.
Ø Constraints that are restrictions placed on the firm by the operating environment situated in linear relationships with the decision variables.
Ø Parameters/cost coefficients that are numerical coefficients and constants used in the objective function and constraint equations.
Basic Assumptions (Properties) of LPP
Technically, there are five additional requirements of an LPP:
1. We assume that conditions of certainty exist; that is, the numbers in the objective and constraints are known with certainty and do not change during the period being studied.
2. We also assume that proportionality exists in the objective and constraints. This means that if production of 1 unit of a product uses 3 h of a particular scarce resource, then making 10 units of that product uses 30 h of the resource.
3. The third technical assumption deals with additivity, meaning that the total of all activities equals the sum of the individual activities.
4. We make the divisibility assumption that solutions need not be in whole numbers (integers). Instead, they are divisible and may take any fractional value.
5. Finally, we assume that all answers or variables are nonnegative. Negative values of physical quantities are impossible; we simply cannot produce a negative number of textile products.
Linear Programming Model Formulation Steps
In this section, we consider the steps involved in the mathematical formulation of the problem. LPP is a collection of the objective function, the set of constraints, and the set of nonnegative constraints.
Step 1: Clearly define the decision variables of the problem, X = (x
1, x2,…, xn).
Step 2: Write the objective function as a linear combination of the decision variables, Z = f (X).
Step 3: Formulating the constraints of the problem as a linear combination of the decision variables.
General Form of the Linear Programming Model
In general, if C = (c
1, c2,…, cn) is a tuple of real numbers, then the function f of
real variables X = (x
1, x2,…, xn) defined by
f (X) = c
is known as a linear function. If g is a linear function and b = (b
1, b2 ,…, bn) is a
tuple of real numbers, then g(x) = b is called a linear equation, whereas g(x) (≤ ,
≥) b is called a linear inequality. A linear constraint is one that is either a linear equation or a linear inequality. A linear programming problem (LPP) is one which optimizes (maximizes or minimizes) a linear function subject to a finite collection of linear constraints. Formally, any LPP having 𝑛 decision variables can be written in the following form:
Optimize
∑
=
=
n
j
j j
X
C
Z
1
Subject
to
a
X
b
i
m
m
i
i j
ij
(
,
,
)
,
1
,
2
,...,
1=
≥
=
≤
∑
=
X
j≥
0
,
j
=
1
,
2
,...,
n
where
C
j,
a
ij,
b
i are constants.Common terminology for the aforementioned linear programming model can now be summarized as follows. The function, being optimized (maximized or minimized), is referred to as the objective function. The restrictions normally are referred to as constraints. The first
m
constraints (those with a function of all the variables, on the left-hand side) are called functional constraints (or structural constraints). Similarly, theX
j≥
0
,
j
=
1
,
2
,...,
n
restrictions are called non-negativity constraints (or non-negativity conditions) and the aim is to find the values of the variables Xj. Any vector 𝑋! , satisfying the constraint of theLPP is called a feasible solution of the problem (Fogiel, 1996; Schulze, 1998; Chinneck, 2000). In this paper, we use the following terminology for the solution. A feasible solution is a solution for which all the constraints are satisfied. An infeasible solution is a solution for which at least one constraint is violated. The problem is to find the values of the decision variables 𝑋! that maximize the objective function 𝑍 subject to the m constraints and the non-negativity restriction on the 𝑋! variable. The resulting set of decision variables that
maximize the objective function is called the optimal solution.
Results and Discussion
The information collected from the case company in addition to the sales and other operating data was analyzed to provide estimates for LPP model parameters. To set up the model, the first level decision variables on the volume of products to be produced were set.
x3 = number of mock neck T-shirts x4 = number of singlets
x5 = number of short pants
Z = total profit during the month
Now, the linear programming model, maximizing the total profit is:
Maximize Z (Birr Profit) = 5.25 x1 + 4.82x2 + 4.85x3 + 3.2x4 + 6.75x5
Subject to
315x1 + 200x2 + 195x3 + 180x4 + 280x5 ≤ 38,665,000 (Fabric)
230x1 + 110x2 + 140x3 + 100x4 + 200x5 ≤ 26,638,120 (Thread)
12.5x1, +5.5 x2 + 6.3x3 + 4.25x4 + 7.5x5 ≤ 1,009,008 (Labor)
31x1 + 19.1x2 + 20.1x3 + 37.5x4 + 20.1x5 ≤ 4,979,414 (Over heads)
1.8x1 + 1.1x2 + 1.7x3 + 1.1x4 + 2.6x5 ≤ 346,200 (Cutting time)
22.7x1 + 5.4x2 + 10.4x3 + 4.5x4 + 40.1x5 ≤ 2,670,300 (Sewing time)
2x1 + 1.3x2 + 1.9x3 + 1.3x4 + 2.6x5 ≤ 371,700 (Finishing time)
x1≥ 15000; x2 ≥ 35800; x3 ≥ 13500; x4 ≥ 12500; x5 ≥ 16100 (Customer
orders)
Model Solution
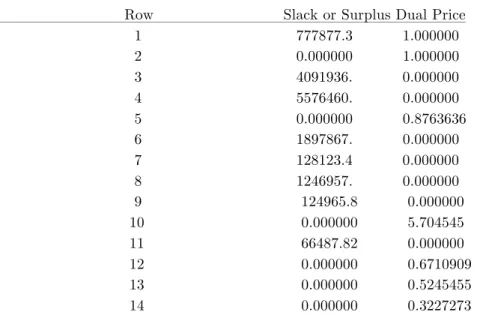
A powerful linear programming problem solving technique is the simplex method. Among the various software packages, LINGO 16.0 software was used to hold the simplex procedures. The global optimal solution report for this model is as follows.
Objective value: 777877.3 Infeasibilities: 0.000000
Total solver iterations: 2
Elapsed run time seconds: 0.03 Model class: LP Total variables: 6
Nonlinear variables: 0
Integer variables: 0
Total constraints: 14
Nonlinear constraints: 0
Total nonzeros: 47
Nonlinear nonzeros: 0
Variable Value Reduced Cost
Z 777877.3 0.000000 x1 15000.00 0.000000
x2 102287.8 0.000000
x3 13500.00 0.000000
x4 12500.00 0.000000
x5 16100.00 0.000000
Row Slack or Surplus Dual Price 1 777877.3 1.000000 2 0.000000 1.000000 3 4091936. 0.000000 4 5576460. 0.000000 5 0.000000 0.8763636 6 1897867. 0.000000 7 128123.4 0.000000 8 1246957. 0.000000 9 124965.8 0.000000 10 0.000000 5.704545 11 66487.82 0.000000 12 0.000000 0.6710909 13 0.000000 0.5245455 14 0.000000 0.3227273
Here, there was a difference between the LPP solutions obtained to satisfy customer orders using LINGO 16.0 and actual production in Table 3. In the former case, the product mix was Polo shirts, basic shirts, Mock neck T-shirts, singlets, and short pants with volumes of 15,000.00, 102,287.8, 13,500.00, 12,500.00, and 16,100.00 respectively, and with a total profit of Birr 777,877.3 per month upon selling. In the latter case, the product mix was Polo T-shirts, basic T-shirts, mock neck T-shirts, singlets, and short pants with optimal volumes of 15,000.00, 35,800.00, 13,500.00, 12500.00, and 16,100.00 respectively, and with a total profit of Birr 465,456 per month. At optimality, resources consumed by the LINGO 16.0 software result were compared with the customer orders during the month. In this case, the profit of the company could be improved by 59.84 %.
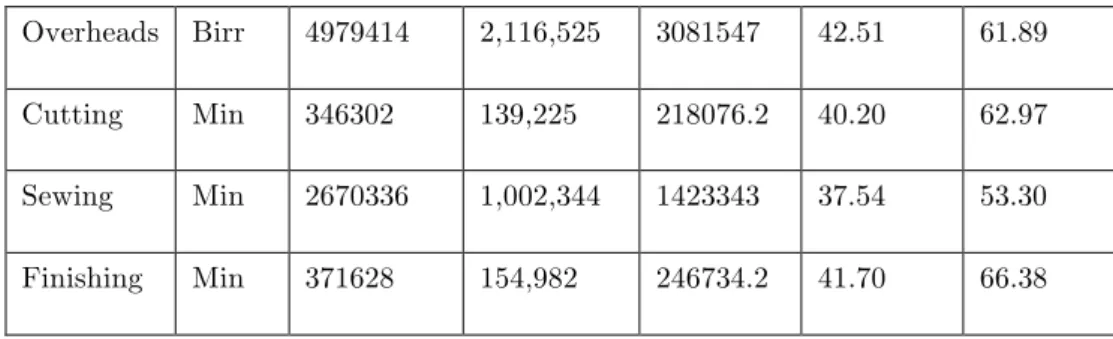
From Table 2, the monthly consumption values of customer orders for each available resource were gathered from the company’s records. These consumption values and LPP consumption values are summarized in Table 4. The ratios of monthly consumption of the resources held were calculated to find the percentage usage by each T-shirt style.
Table 4: Monthly consumption by LPP techniques and customer order
production.
Resources Held per Month Monthly Resources
Consumption
Percentage (%) of
Usage
Customer
order LPP
Customer
order LPP
Type Unit Value
Fabrics Gram 38665000 20,526,871 34573064 53.09 89.42
Threads Meter 26,638,120 13,288,700 21061660 49.89 79.07
Overheads Birr 4979414 2,116,525 3081547 42.51 61.89
Cutting Min 346302 139,225 218076.2 40.20 62.97
Sewing Min 2670336 1,002,344 1423343 37.54 53.30
Finishing Min 371628 154,982 246734.2 41.70 66.38
The study shows that the LPP resource utilization of fabrics, threads, labor, overheads, cutting, sewing, and finishing can be significantly improved to 89.42%, 79.07%, 100%, 61.89%, 62.97%, 53.30%, and 66.38% respectively. Thus, Figure 1 shows that production based on customer orders lead to inefficient resource utilization since most of the resources are idle.
Figure 1: Comparison of customer order and LPP production resources
utilization.
Here, an analysis has been made without considering customer orders to develop an LPP model using monthly consumption of resources. The monthly consumption of each resource values are given under the left-hand side column in Table 2, which can be used as required for the constraints.
Maximize z = 525/100*X1+482/100*X2+485/100*X3 +32/10*X4+675/100*X5;
Subject to
315*X1+ 200*X2 + 195*X3 + 180*X4+ 280*X5≤ 20526871;
230*X1 +110*X2+ 140*X3+ 100*X4+ 200*X5 ≤ 13288700;
125/10*X1+5.5 *X2 + 63/10*X3+ 425/100*X4 + 75/10*X5 ≤ 590765;
31/10*X1+ 191/10*X2+ 201/10 *X3+ 165/10*X4+ 375/10*X5 ≤ 2116525;
18/10*X1+ 11/10*X2+ 17/10 *X3+ 11/10*X4+ 26/10*X5 ≤ 139225;
227/10*X1 + 55/10*X2+ 104/10*X3+ 45/10*X4 + 201/10*X5 ≤ 1002344;
2*X1+ 13/10*X2 + 19/10*X3+ 13/10*X4+ 26/10 *X5 ≤ 154982;
X1≥ 0; X2 ≥ 0; X3 ≥ 0; X4 ≥ 0; X5 ≥ 0.
0!
10!
20!
30!
40!
50!
60!
70!
80!
90!
100!
LPP!
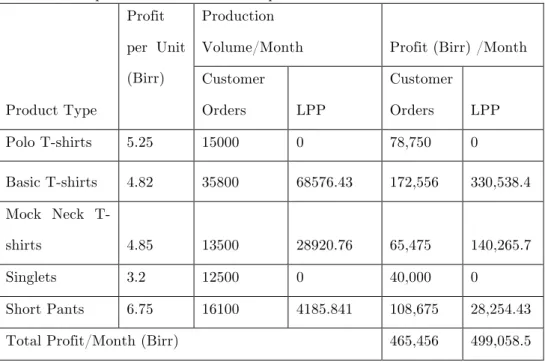
The optimal solution values of the decision variables were obtained using the LINGO 16.0 s software. Table 5 shows the monthly product mix of the actual system obtained from the factory and that suggested by the LPP model. These values have been multiplied by their respective unit profits to obtain the profit per month of each product. In this case where customer orders were not considered, the product mix suggested by the LPP model was Polo, basic T-shirt, Mock neck T-shirts, singlets, and short pants at optimal volumes of 0, 330,538.4, 140,265.7, 0, and 28,254.43 respectively with a total profit of Birr 499,058.5 per month. It can be shown then that with the LPP optimal solution, the profit of the company can be improved by 7.22% (499,058.5 – 465,456/465,456) ×100. Adopting operational research techniques in the production decision help the company to improve its objective.
Table 5: Comparison of customer order production and LPP values.
Product Type
Profit
per Unit
(Birr)
Production
Volume/Month Profit (Birr) /Month
Customer
Orders LPP
Customer
Orders LPP
Polo T-shirts 5.25 15000 0 78,750 0
Basic T-shirts 4.82 35800 68576.43 172,556 330,538.4
Mock Neck
T-shirts 4.85 13500 28920.76 65,475 140,265.7
Singlets 3.2 12500 0 40,000 0
Short Pants 6.75 16100 4185.841 108,675 28,254.43
Total Profit/Month (Birr) 465,456 499,058.5
Conclusion
Ability to use resources (resource utilization) was recorded as the major constraint in the apparel manufacturing industry. The profits comparison between the actual production and production using LPP models show sizeable differences. From this point of view, it can be concluded that the apparel company should use quantitative research methods of linear programming to determine their optimal product mix. Thus, it will be possible to obtain the following results:
Ø The profit of the company can be improved by 59.84% (from Birr 465,456 per month to Birr 777,877.3 per month).
Ø Use of an operational research technique in the production time horizon helps the company to improve its objective.
References
Arefayne, D., & Pal, A. (2014). Productivity Improvement through Lean Manufacturing Tools: A Case Study on Ethiopian Garment Industry. International Journal of Engineering Research & Technology (IJERT), 3 (9), 1037–1045.
ETIDI. (2014). Textile Industry Development in Ethiopia. An Overview of Facts and Opportunities, Addis Ababa, Ethiopia.
Ezema, B.I and Amakoml, U. (2012). Optimizing Profit with the Linear Programming Model: A Focus on Golden Plastic Industry Limited, Enugu, Nigeria. Interdisciplinary Journal of Research in Business, 2 ( 2), 37–49.
Kumar, V. (2010). JIT Based Quality Management: Concepts and Implications in Indian Context. International Journal of Engineering Science and Technology, 2 (1), 40–50.
Reeb, J. and Leavengood, S. (1998). Using the Simplex Method to Solve Linear Programming Maximization Problems. Oregon State University, Extension Service
Samuel, S. (2012). Investigation on the Effect of Supply Chain Integration on Ethiopian Garment Industry’s Performance. A Thesis Submitted to the Department of Management. Addis Ababa University, Addis Ababa, Ethiopia.
Shaheen, S. and Ahmad, T. (2015). Linear Programming Based Optimum Resource Utilization for Manufacturing of Electronic Toys. International Research Journal of Engineering and Technology (IRJET), 2 (1), 261–264