ISSN: 2339-076X (p)
;
2502-2458 (e)
,
Volume 6, Number 1 (October 2018): 1513-1518
DOI:10.15243/jdmlm.2018.061.1513
Research Article
Mining land identification in Wetar Island using remote sensing data
Atriyon Julzarika
*Remote Sensing Applications Center, Indonesian National Institute of Aeronautics and Space (LAPAN)
*
Received 24 July 2018, Accepted 12 September 2018
Abstract:
Wetar Island is one of the 92 outer islands of Indonesia. On this island, there is a variety of geological potential that can be seen from the structure, formation and geological folds including mine geology potential energy and mineral resources. This makes the island having mining activities. Remote sensing data in the form of optical images, Synthetic Aperture Radar, microwave, laser, and others can be used to determine the mining activities in Wetar Island. This research was focused on mining land identification in Wetar Island. This study aimed to identify the mining land in Wetar Island using remote sensing data. The method used was the Vegetation Index Differencing, which calculated difference value of vegetation index temporally. Landsat satellite images of 1975, 1990, 2000 and 2005 were used for mining land identification. First Landsat satellite image must have had a geometric and radiometric correction. The results obtained were in the form of mining land identification and non- mining land area. These results are useful for monitoring the mining activities carried out on Wetar Island. The methods used may also be applied to monitor, identify, and evaluate various mining operations in other parts of Indonesia. Mining region that has been identified can be used for management and planning of maritime space.Keywords:mining land identification, Landsat, Vegetation Index Differencing (VIDN), Wetar Island
To cite this article:Julzarika, A. 2018. Mining land identification in Wetar Island using remote sensing data. J. Degrade. Min. Land Manage. 6(1): 1513-1518, DOI: 10.15243/jdmlm. 2018.061.1513.
Introduction
There are several mining land types, i.e., mining land before exploration, mining land exploration, mining land exploitation, mining land exploitation that has not been reclaimed, and reclamation of mining land. All of the mining land conditions are found in Indonesia. One of the problems for Indonesian government is the difficulty in mining land identification. This condition is because of the need for high cost and much time to cover a large geographical area of Indonesia. One way to facilitate the mining land identification and evaluation is to utilize remote sensing data. Landsat is free and easily accessible for remote sensing imagery. Landsat that belongs to the United States Geological Survey (USGS) has made acquisitions across the earth surface since 1972. Landsat main function is in geology and mining applications. This temporal resolution of
Figure 1. Mining land in Wetar Island
The entire production process of the management is conducted in Wetar. Copper reserves in Wetar have been known since 1990 and exploration was performed in 2004-2005. Having fulfilled all the requirements, cathode copper (copper plate) is now produced in Indonesia. Copperplate produced by this company is in the category of standardization of London Metallic Exchange (LME) as grade A that is sold using international prices.
This study aimed to identify the mining land in Wetar Island using remote sensing data.
Material and Methods
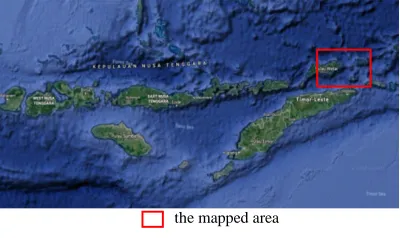
This study used data from Landsat 2 (1975), Landsat 5 (1990, 2000, and 2005) and WorldView image (2015). All the data used were already in Radiometric and geometry correction. The method used for the mining land identification was Vegetation Index Differencing (VIDN). The study area is located at Wetar Island (Figure 2).
the mapped area
Figure 2. Wetar Island
Wetar Island is one of the 92 outer islands of Indonesia that is located in the Banda Sea near Timor Leste borders. Wetar is a tropical island which is a part of the Southwest Maluku Regency, Maluku Province. The island has a maritime border with Timor Leste. On this island, there is a variety of geological potential that can be seen from the structure, formation, and geological folds. This includes mine geology potential energy and mineral resources. This makes the island has mining activities. The island is located
in the north of the Timor Leste with geodetic coordinates 7 ° 56 '50 " South, 126 ° 28' 10" East. It lies east of the Lesser Sunda Islands, which include nearby Alor and Timor, but it is administrative part of the Maluku Islands. To the south, across the Wetar Strait, lies the island of Timor, at its closest it is 50 km away. To the west, across the Ombai Strait, lies the island of Alor. To the southwest is the tiny island of Liran, which is also part of Wetar district and, further southwest, the small Timor Leste’s island of Atauro. To the north is the Banda Sea and to the east lie Romang and Damar Islands, while to the southeast lie the other principal islands of the Barat Daya Islands. Including Liran, Wetar has an area of 2,651.9 km2 (BPS, 2010).
Principal component analysis (PCA) was used to describe the variance-covariance matrix structure of a set of variables through a linear combination of these variables. In general, significant components can be useful for the reduction and variables interpretation (Abrams et al., 1988). PCA procedure is to simplify the observed variables by reducing its dimensions (Noomen et al., 2008). This is done by eliminating the correlation between independent variables through the transformation of the independent variable origin to new variables that are not correlated at all (principal component) (Mielke et al., 2014).
After some components of the PCA results obtained multi colinearity free, then these components became a new independent variable that was regressed or analyzed its effect on the dependent variable (Y) using regression analysis (Harris et al., 2011). On the applications of remote sensing, vegetation index is the level of vegetation greenness that can be used as drought parameter conditions (Boesche et al., 2016). Vegetation indices may change due to the condition of water availability (Dill, 2010). Low vegetation indices conditions resulted in decreased food production, fire, and so forth. Monitoring of vegetation indices needs to be done so that it can be anticipated as the worst result (Chang and Collins, 1983).
blue and reflecting green waves, and human eyes see living plant in green leaf (Clark, 2007). One type of waves indicated plants in the form of the wave near infrared (Cudahy et al., 2009). Normalized Difference Vegetation Index (NDVI) is the calculation of the imagery used to determine the level of greenness. NDVI shows the parameters associated with vegetation parameters, among others, the biomass of green vegetation, green vegetation classification (Taranik and Aslett, 2009).
(a)
( b )
Figure 3. (a). Landsat data and (b). NDVI information
Comparison between two or more bands is a consideration that it is used to reduce the effects of variations in topography (van der Meer et al., 2012). This is variation of the emission compensation and function of elevation of the sun on different areas in the satellite imagery. This comparison does not eliminate the additive effects caused by atmospheric attenuation, but the basic components for NDVI and vegetation interconnected (Thompson et al., 1999). Background land serves as a reflector separate signal from vegetation and interacts with vegetation through the scattering of radiant energy.
NDVI value range is between -1.0 to +1.0. Values greater than 0.1 usually indicates an increase in the degree of intensity of greenery and vegetation. Values between 0 and 0.1 is generally a characteristic of rocks and vacant land and a value less than 0 indicates the possibility of ice clouds, clouds of water vapour and snow. Surface vegetation has NDVI value range of 0.1 to land savanna (grasslands) of up to 0.8 for tropical rainforest areas. NDVI value can be obtained by
comparing the data reduction near infrared band with a red band and divided by the sum of both bands. Here is the NDVI formula:
...(1)
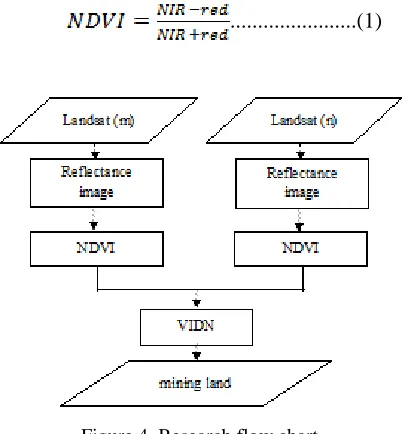
Figure 4. Research flow chart
NDVI value using NIR reflectance values of a band and Red band on the satellite image (Julien et al., 2011). This VIDN method is commonly used for alteration analysis or change detection (van der Meer and de Jong, 2000). Change detection is the process of identifying changes to objects or phenomena through observation of the variety of different times (Thompson et al., 1999). One of the methods used for the change analysis is Image differencing method or image subtraction method (Riaza et al., 2011). Values ranged from VIDN -2 - 2 with negative value stating the reduction in biomass or green vegetation. Reduction of biomass is one indication of the land cover classes changes in open mining land. VIDN manufacture synthetic image derived from NDVI values between two or more different times. VIDN value can be obtained, namely the reduction of the data with the data NDVI year n year m (Ramachandran et al., 2011). VIDN the following formula:
...(2)
where in n> n years. Figure 2 is a flowchart of research
Results and Discussion
2015) were used for the mining land detection (see Figure 6). VIDN value of Wetar mining land can be detected from the reduction NDVI 1990 to NDVI 2005, NDVI 1975 to NDVI 2005, NDVI 1975 to VIDN 2000, NDVI 1975 to NDVI 1990, NDVI 1990 to NDVI 2000 or NDVI 2000 to NDVI 2005 (see Table 1). VIDN is used to identify the mining land in Wetar Island.
Implementation of numerical computing in the form of statistical calculations of VIDN synthetic image data contained in the sample polygon of open pit mining land. The calculation of statistical values is needed to determine the maximum and minimum threshold value of the image pixel values VIDN. This threshold value can then be used for the identification of open pit mining land.
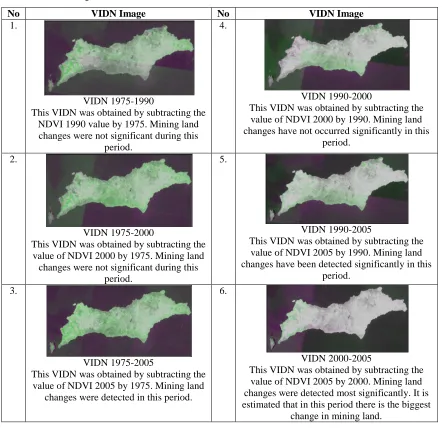
Table 1. VIDN image 1975, 1990, 2000, 2005
No VIDN Image No VIDN Image
1.
VIDN 1975-1990
This VIDN was obtained by subtracting the NDVI 1990 value by 1975. Mining land changes were not significant during this
period.
4.
VIDN 1990-2000
This VIDN was obtained by subtracting the value of NDVI 2000 by 1990. Mining land changes have not occurred significantly in this
period.
2.
VIDN 1975-2000
This VIDN was obtained by subtracting the value of NDVI 2000 by 1975. Mining land changes were not significant during this
period.
5.
VIDN 1990-2005
This VIDN was obtained by subtracting the value of NDVI 2005 by 1990. Mining land changes have been detected significantly in this
period.
3.
VIDN 1975-2005
This VIDN was obtained by subtracting the value of NDVI 2005 by 1975. Mining land
changes were detected in this period.
6.
VIDN 2000-2005
This VIDN was obtained by subtracting the value of NDVI 2005 by 2000. Mining land changes were detected most significantly. It is estimated that in this period there is the biggest
change in mining land.
In its activities, statistical calculations were performed on VIDN synthetic image data contained in the sample polygon open land mines. VIDN synthetic image data used were VIDN 1975, 1990, 2000, and 2005. Implementation of numerical computing was in the form of a synthetic image threshold VIDN for the mining land identification. This threshold used statistical
(Threshold Down) values of each threshold was determined by the pixel values in the sample areas of mining land. Tu value was taken from the maximum value, while the value of Td was taken from the minimum value of calculation results in polygon of VIDN statistical sample. Threshold process was performed by a rule of decision-making as in the following equation.
1, if I (x, y) > Td and if I (x, y) < Tu
I (x, y) = {
0, others
.... (3)
In these rules, Y (x, y) is a pixel value created from the selected index. Making the threshold is done by creating a training area on the synthetic image that has been generated. Threshold results in general still contain noise that looks like nodes often called salt and pepper. To eliminate these errors, low pass filtering used a median filter (see Figure 6. The median filter is one of the non-linear filtering that sort bunch of pixel intensity values, and then replace the pixel values that are processed with a median value. The median filter is a method that focuses on the median or middle value of the total amount of the overall value of pixels around them. Median filter processing is done by finding the middle value of neighbouring pixel values that affect the central pixel. This technique works by filling the value of each pixel
with the median value of a neighbour. The selection process begins with the median first sort neighbouring pixel values and then choose a value centre.
Accuracy test
VIDN image was in the form of the result of mining land detection done by the field test. This test covered three locations. The conditions of test areas are presented in Figures 5 and 6. The results obtained in the form of three locations this point are mining lands. This test used a confidence level of 3σ (90%) as it has not been checked for the boundary mining land at the three locations.
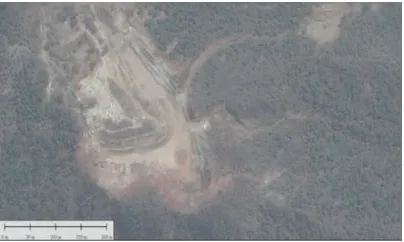
Figure 5. Mining land in Wetar Island in 2015
Figure 6. Mining land identification using VIDN method and median filtering (left), mining land condition in WorldView image 2015 (right)
Conclusion
This study has concluded that Landsat imagery can be used for mining land identification. VIDN method has also been successful in mining land identification with 3σ(90 %) tolerance. Accuracy tests were performed at three locations. The results obtained in the form of three locations were mining lands, but the boundaries of mining lands were not checked. This method can be applied automatically to all parts of Indonesia, to facilitate the mining land identification.
Acknowledgement
The author thanks LAPAN and Gadjah Mada University for supporting this research.
References
Abrams, M.J., Rothery, D.A. and Pontual, A. 1988. A Mapping in the Oman ophiolite using enhanced Landsat Thematic Mapper images.Tectonophysics
151(1-4):387-401.
Rogass, C., Thomson, D., Lundeen, S., Brell, M. and Guanter, L. 2016. EnGeoMAP Test Data: Simulated EnMAP Satellite Data for Mountain Pass, USA and Rodalquilar, Spain. GFZ Data Services. http://doi.org/10.5880/enmap.2016.001, BPS, 2010. Statistik Indonesia. Badan Pusat Statistik.
Jakarta.
Chang, S.H. and William, C. 1983. Confirmation of the airborne biogeophysical mineral exploration technique using laboratory methods. Economic Geology78(4): 723–736.
Clark, R.N. 2007. USGS Digital Spectral Library splib06a, US Geology Survey, Denver.
Cudahy, T., Hewson, R., Caccetta, M., Roache, A., Whitbourn, L., Connor, P., Coward, D., Mason, P., Yang, K., Huntington, J., and Quigley, M. 2009. Drill core logging of plagioclase feldspar composition and other minerals associated with Archean gold mineralization at Kambalda, Western Australia, using a bidirectional thermal infrared reflectance system. Reviews in Economic Geology
16: 223–235.
Dill, H.G. 2010. The “chessboard” classification scheme of mineral deposits - mineralogy and geology from aluminium to zirconium. Earth Science Reviews100(1): 1–420.
Harris, J.R., Wickert, L., Lynds, T., Behnia, P., Rainbird, R., Grunsky, E., McGregor, R. and Schetselaar, E. 2011. Remote predictive mapping 3. Optical remote sensing - a review for remote predictive geological mapping in northern Canada.
Geoscience Canada38(2): 49-83.
Julien, Y., Sobrino, J.A., Mattar, C., Ruescas, A.B., Jimenez-Munoz, J.C., Soria, G., Hidalgo, V., Atitar, M., Franch, B. and Cuenca, J. 2011. Temporal analysis of NDVI and LST parameters to detect changes in the Iberian land cover between 1981 and 2001. International Journal of Remote Sensing
32(7):2057–2068.
Mielke, C., Boesche, N.K., Rogass, C., Kaufmann, H., Gauert, C. and de Wit, M., 2014. Spaceborne mine waste mineralogy monitoring in South Africa, applications for modern push-broom missions: Hyperion/OLI and EnMAP/Sentinel-2. Remote Sensing6(8): 6790–6816.
Noomen, M.F., Smith, K.L., Colls, J.J., Steven, M.D., Skidmore, A.K. and Van der Meer, F.D. 2008. Hyperspectral indices for detecting changes in canopy reflectance as a result of underground natural gas leakage. International Journal of Remote Sensing29(20): 5987–6008.
Rajendran, S., al-Khirbash, S., Pracejus, B., Nasir, S., Al-Abri, A.H., Kusky, T.M. and Ghulam, A. 2012. ASTER detection of chromite bearing mineralized zones in semail ophiolite massifs of the northern Oman Mountains. Exploration strategy. Ore Geology Review44: 121-135.
Randolph, K., Wilson, J., Tedesco, L., Li, L., Lani Pascual, D. and Soyeux, E. 2008. Hyperspectral remote sensing of cyanobacteria in turbid productive water using optically active pigments, chlorophyll a and phycocyanin. Remote Sensing Environment112: 4009–4019.
Ramachandran, B., Justice, C.O. and Abrams, M.J. 2011. Eds.; Remote Sensing and Digital Image Processing 11, Springer Science and Business Media: Berlin, Germany, pp. 807-834.
Riaza, A., Buzzi, J., Garcia-Meléndez, E., Carrère, V. and Müller, A. 2011. A monitoring the extent of contamination from acid mine drainage in the Iberian Pyrite Belt (SW Spain) using hyperspectral imagery.Remote Sensing3(10): 2166-2186. Taranik, J.V. and Aslett, Z.L. 2009. Development of
hyperspectral imaging for mineral exploration.
Reviews in Economic Geology16: 83–95.
Thompson, A.J.B., Hauff, P.L. and Robitaille, A.J. 1999. Alteration mapping in exploration: Application of short-wave infrared (SWIR) Spectroscopy.Society of Economic Geologists, SEG Newsletter39(1): 16–27. Reprinted here as p. 11– 23.
Van der Meer, F. and de Jong, S.M. 2000. Improving the results of spectral unmixing of Landsat Thematic Mapper imagery by enhancing the orthogonality of end-members. International Journal of Remote Sensing21(15): 2781-2797. Van der Meer, F.D., van der Werff, H.M.A., van
Ruitenbeek, F.J.A., Hecker, C.A., Bakker, W.H., Noomen, M.F. and Woldai, T. 2012. Multi- and hyperspectral geologic remote sensing: A review.