ARTIGO ORIGINAL
The Portuguese Version of the European Deprivation Index:
An Instrument to Study Health Inequalities
A versão Portuguesa do
European Deprivation Index
: Um
Instrumento para o Estudo das Desigualdades em Saúde
1. EPIUNIT - Instituto de Saúde Pública. Universidade do Porto. Porto. Portugal. 2. Instituto de Investigação e Inovação em Saúde. Universidade do Porto. Porto. Portugal. 3. Instituto de Engenharia Biomédica. Universidade do Porto. Porto. Portugal.
4. Departamento de Epidemiologia Clínica. Medicina Preditiva e Saúde Pública. Faculdade de Medicina. Universidade do Porto. Porto. Portugal. 5. Registo Oncológico Regional Sul. Lisboa. Portugal.
6. Instituto de Comunicação e Informação Científica e Tecnológica em Saúde. Fundação Oswaldo Cruz. Rio de Janeiro. Brasil. 7. Departamento de Engenharia Cartográfica. Faculdade de Engenharia. Universidade do Estado do Rio de Janeiro. Rio de Janeiro. Brasil.
Autor correspondente: Ana Isabel Ribeiro. [email protected]
Recebido: 13 de janeiro de 2016 - Aceite: 28 de agosto de 2016 | Copyright © Ordem dos Médicos 2017
Ana Isabel RIBEIRO1,2,3,4, Alexandra MAYER5, Ana MIRANDA5, Maria de Fátima de PINA2,3,6,7
Acta Med Port 2017 Jan;30(1):17-25 ▪ http://dx.doi.org/10.20344/amp.7387
RESUMO
Introdução: Combater as desigualdades socioeconómicas em saúde é um grande desafio em saúde pública e os indicadores ecológi-cos de privação socioeconómica são essenciais para as monitorizar e compreender. Não existe nenhum indicador padrão de privação que cubra todo o território nacional, contrariamente ao que acontece noutros países. Este estudo visa descrever a construção da versão portuguesa de um índice de privação transnacional, European Deprivation Index.
Material e Métodos: O European Deprivation Index foi desenvolvido de acordo com a conceptualização de Townsend sobre privação. Usando dados do questionário European Union-Statistics on Income and Living Conditions, obtivemos um indicador de privação indi-vidual. Este tornou-se a variável chave, baseada na qual selecionamos as variáveis ecológicas (censos) a ser incluídas, um total de oito. O European Deprivation Index foi produzido para a menor área geográfica possível (n = 16 094, média/área = 643 habitantes) e resultou da soma ponderada das variáveis anteriores. Foi depois categorizado em quintis.
Resultados: O primeiro quintil do European Deprivation Index (mais favorecido) incluiu 20,5% da população nacional e o quinto (menos favorecido) 18,0%. O European Deprivation Index apresentou um padrão territorial demarcado – as áreas menos favorecidas concentraram-se no Sul e no Interior Norte e Centro e as mais favorecidas no litoral Norte e Centro e no Algarve.
Discussão: A construção do European Deprivation Index assentou numa conceptualização teórica sólida, variáveis individuais e agregadas e num inquérito europeu longitudinal permitindo que seja replicado no tempo e em qualquer país europeu.
Conclusão: Esperamos que o European Deprivation Index venha a ser utilmente empregue por todos aqueles que desejem com-preender melhor as desigualdades em saúde no nosso país e na Europa.
Palavras-chave: Acesso aos Serviços de Saúde; Disparidades nos Níveis de Saúde; Europa; Factores Socioeconómicos; Inquéritos e Questionários; Portugal
ABSTRACT
Introduction: Tackling socioeconomic health inequalities is a big public health challenge and ecological deprivation indexes are essential instruments to monitor and understand them. In Portugal, no standard ecological deprivation index exists, contrasting with other countries. We aimed to describe the construction of the Portuguese version of a transnational deprivation index, European Deprivation Index.
Material and Methods: The European Deprivation Index was developed under the Townsend theorization of deprivation. Using data from the European Union - Statistics on Income and Living Conditions Survey, we obtained an indicator of individual deprivation. This indicator became the gold-standard variable, based on what we selected the variables at aggregate level (census) to be included in the European Deprivation Index, a total of eight. The European Deprivation Index was produced for the smallest area unit possible (n = 16 094, mean/area = 643 inhabitants) and resulted from the weighted sum of the previous variables. It was then classified into quintiles.
Results: The first quintile (least deprived) comprised 20.9% national population and the fifth quintile (most deprived) 18.0%. The European Deprivation Index showed a clear geographic pattern – most deprived areas concentrated in the South and in the inner North and Centre of the country, and the least deprived areas in the coastal areas of North and Centre and in the Algarve.
Discussion: The development of the European Deprivation Index was grounded on a solid theoretical framework, individual and aggregate variables, and on a longitudinal Europe-wide survey allowing its replication over the time and in any European country.
Conclusion: Hopefully, the European Deprivation Index will start being employed by those interested in better understand health inequalities not only in Portugal but across Europe.
Keywords: Europe; Health Services Accessibility; Health Status Disparities; Portugal; Socioeconomic Factors; Surveys and Questionnaires
INTRODUCTION
Socioeconomic deprivation
Health inequalities have been observed all over the world and tackling them has become one of the top priorities for national and international public health authorities.1 Health
inequalities can be defined as differences in health status or in the distribution of health determinants between different population groups.2 And this unequal distribution of health is
ARTIGO ORIGINAL
Table 1 -
Characteristics of the ecological deprivation indexes used in Portugal (2009-2015)
Name of the index
Year
Geographical extent
Unit
No. variables
Variables
Choice of the variables
Studies
Deprivation score
20
2009
Lisbon Metropolitan
Area
Parish
3
- male unemployment - unskilled worker employment - individuals living in shanty households Based on Carstairs & Morris
6
20,27
Multiple Deprivation Index (MDI)
28
2010
Lisbon Metropolitan
Area
Parish
3
- unemployed people - unskilled employed workers - persons living in slum conditions Based on Carstairs & Morris
6
28
Neighborhood socioeconomic latent classes
26
2013
Porto municipality
Census blocks
11
- retired individuals - families with an individual aged ≤ 15 years - aging index - illiterate subjects - subjects with higher education - subjects with lower occupation - unemployment rate - mean expenditure on owned housing - mean expenditure on rented housing - attractiveness - buildings with reparation needs Variables chosen based on expertise and statistical criteria
19,22,24-26
Index of socioeconomic deprivation
13
2013
Lisbon Metropolitan
Area
together with other European urban areas
Parish
5
- unemployment rate - manual workers - young people with primary or lower level of education - young people with university education - foreigners from low-income countries Conceptual statistical choice. Comparable between areas. P-distance method 2 (similar to PCA)
13-15,18
Socio-material deprivation index (Índice de Privação Sociomaterial)
17
2014
Nationwide
Municipality
3
- illiteracy - unemployment - households without a toilet Based on Carstairs & Morris
6
17
Area-based socioeconomic (SE) indicator
23
2015
Nationwide
Parish
6
- people without schooling - people with secondary education - residents employed in industry
, trade and
service occupations - residents employed in industrial and manual occupations - dwellings overcrowded - owner occupied houses Variables chosen based on expertise and statistical criteria
23
Municipality socioeconomic status (SES)
21
2015
Nationwide
Municipality
17
- population by age groups and sex - retired individuals (by sex) - widows - individuals receiving social support - illiteracy - aging and youth dependency indexes - individuals living alone - mean number of rooms per household - mean number of individuals per household - unemployment rate - subjects with higher and basic education - subjects by category of occupation - income - residences and buildings with/without public water supply
, mains, or otherwise
- households with heating and by type of heating Variables chosen based on expertise and statistical criteria (PCA)
21
Material deprivation index
16
2015
Nationwide
Municipality
3
- illiteracy rate - unemployment rate - houses without a toilet Based on Carstairs & Morris
6
ARTIGO ORIGINAL Socioeconomic deprivation is far from
being a consensual concept. But, to date, the most assenting conceptualization seems to be the one proffered by Townsend in 1970s who argued that deprivation is: 1) a relative (“…state of observable and demonstrable disadvantage relative to the local community or the wider society or nation to which an individual, family or group belongs”) and 2) a multidimensional concept (“…the concept of deprivation covers the various conditions, independent of income, experienced by people who are poor”).3,4 Summing up, deprivation is a wider
concept than poverty since it covers more than disposable income; deprivation refers to the lack of fundamental needs, which are context- and time-specific.
Diverse ecological deprivation indexes, also known as area deprivation indexes, have been created to better understand health inequalities. Because they include a wide range of variables, are considered to better reflect the multi-dimensional nature of deprivation. They started being developed in 1970s in the United Kingdom (UK),5 but
currently almost every European country has its own deprivation index, or uses a well-established measure such as Carstairs & Morris6 or Townsend index.7 With these
measures researchers have been able to demonstrate that living in deprived areas is associated with worst health outcomes.8-10 And, as the statistical arsenal became more sophisticated, studies have even showed that this relationship occurs independently of the individual level deprivation.10, 11
Portuguese studies using ecological deprivation indexes
In Portugal studies addressing socio-economic inequalities in health are few, but they have been growing in number since the 2000s. Ecological deprivation has been used as a determinant for a wide variety of outcomes – suicide and injuries,12,13
all-cause,14-16 cause-specific15-17 and avoidable mortality,18 body mass index,19,20 hip fractures,21 infections,22 tobacco
related-diseases,23 and health-related behaviors
such as physical activity,24-26 fruit and vegetable consumption,26,27 among others.28 For such small number of studies (17 studies) the amount of deprivation indexes that is being used is rather large (eight different indicators). Their characteristics are summarized in Table 1.
Table 1 -
Characteristics of the ecological deprivation indexes used in Portugal (2009-2015) (remaining section)
Name of the index
Year
Geographical extent
Unit
No. variables
Variables
Choice of the variables
Studies
Table 1 -
Characteristics of the ecological deprivation indexes used in Portugal (2009-2015)
Name of the index
Year
Geographical extent
Unit
No. variables
Variables
Choice of the variables
Studies Deprivation score 20 2009 Lisbon Metropolitan Area Parish 3
- male unemployment - unskilled worker employment - individuals living in shanty households Based on Carstairs & Morris
6
20,27
Multiple Deprivation Index (MDI)
28 2010 Lisbon Metropolitan Area Parish 3
- unemployed people - unskilled employed workers - persons living in slum conditions Based on Carstairs & Morris
6
28
Neighborhood socioeconomic latent classes
26
2013
Porto municipality
Census blocks
11
- retired individuals - families with an individual aged ≤ 15 years - aging index - illiterate subjects - subjects with higher education - subjects with lower occupation - unemployment rate - mean expenditure on owned housing - mean expenditure on rented housing - attractiveness - buildings with reparation needs Variables chosen based on expertise and statistical criteria
19,22,24-26
Index of socioeconomic deprivation
13
2013
Lisbon Metropolitan
Area
together with other European urban areas
Parish
5
- unemployment rate - manual workers - young people with primary or lower level of education - young people with university education - foreigners from low-income countries Conceptual statistical choice. Comparable between areas. P-distance method 2 (similar to PCA)
13-15,18
Socio-material deprivation index (Índice de Privação Sociomaterial)
17
2014
Nationwide
Municipality
3
- illiteracy - unemployment - households without a toilet Based on Carstairs & Morris
6
17
Area-based socioeconomic (SE) indicator
23
2015
Nationwide
Parish
6
- people without schooling - people with secondary education - residents employed in industry
, trade and
service occupations - residents employed in industrial and manual occupations - dwellings overcrowded - owner occupied houses Variables chosen based on expertise and statistical criteria
23
Municipality socioeconomic status (SES)
21
2015
Nationwide
Municipality
17
- population by age groups and sex - retired individuals (by sex) - widows - individuals receiving social support - illiteracy - aging and youth dependency indexes - individuals living alone - mean number of rooms per household - mean number of individuals per household - unemployment rate - subjects with higher and basic education - subjects by category of occupation - income - residences and buildings with/without public water supply
, mains, or otherwise
- households with heating and by type of heating Variables chosen based on expertise and statistical criteria (PCA)
21
Material deprivation index
16
2015
Nationwide
Municipality
3
- illiteracy rate - unemployment rate - houses without a toilet Based on Carstairs & Morris
6
ARTIGO ORIGINAL This diversity of ecological deprivation indexes reveals growing interest in the topic, but hinders study comparability,
because the variables and the theoretical conceptualization beyond each of those indexes differ substantially. Also, a shortcoming of those measures has to do with the fact they were often produced for large and heterogeneous areas, such as parishes and municipalities, limiting its utility in regional and local planning. In Portugal no standard deprivation measure covering the entire country exists, contrasting with other countries,29-34 where statistical offices and public health institution have been making an effort in this direction.
Recently, a multinational and multidisciplinary team joined efforts to create a cross-national ecological deprivation index for the small areas of England, France, Italy, Portugal, and Spain.35,36 This index was developed using as bedrock
the Townsend theorization of deprivation. With data from a European-wide survey, which provided information on the perceived and objective poverty, a measure of individual deprivation was obtained. This measure became the gold-standard variable, based on what the variables at aggregate level were selected to the ecological deprivation index, called European Deprivation Index (EDI). The variables that compose the individual and ecological deprivation indicators vary by country, as expected, but the fact that they were chosen under the same methodological and theoretical framework makes EDI comparable between countries. The aim of this paper is to describe in detail the construction of the Portuguese version of the European Deprivation Index, as well as its statistical and spatial distribution.
MATERIAL AND METHODS
The construction of the EDI involved three key methodological steps, which will be fully described: (1) constructing an individual deprivation indicator; (2) identifying the variables that were available at individual level (survey) and at aggregate level (census) and (3) constructing an ecological deprivation index, the EDI.
Constructing an individual deprivation indicator
This first step of the construction of EDI relied exclusively on the European Union-Statistics on Income and Living Conditions, EU-SILC.37 This survey is organized
by the European Union (EU), and it is specifically designed
to measure deprivation and its domains (income, social exclusion, housing conditions, labour, education and health). In Portugal, EU-SILC is being implemented annually by INE, Instituto Nacional de Estatística (Statistics Portugal) since its first wave in 2004. We used EU-SILC 2006 cross-sectional survey which covered all 26 EU countries. In Portugal this survey took place between May and July 2006 and included 5416 households, 12 071 individuals, 10 148 of them aged 16 years old. The households were chosen by stratified two-stage sampling, based on the original 2004 sample to guarantee that individuals can be followed longitudinally. All analysis were weighted for non-response and adjusted for sample design to ensure the representativeness of the results.
Identification of fundamental needs: As referred in the introduction, there is no clear-cut definition of individual deprivation. We based our measure of individual deprivation on the concept of fundamental needs purposed by Townsend, which have been the basis of the UK multivariate indexes of deprivation.29-32
Fundamental needs are items which are considered necessary in a specific sociocultural context. If the majority of the population possesses these items, it means that those that cannot afford it are in disadvantage. In the Portuguese EU-SILC survey, several items were not possessed by the majority of households, and so were discharged. Only items possessed by more than 50% of the households were considered fundamental needs. For instance less than 50% of the Portuguese households had a computer, leading to discharge this variable. Items that most individuals could not afford (> 50%) were also disregarded. For example, over 60% of the Portuguese households could not afford taking a week’s annual holiday away from home; this variable was consequently excluded. Table 2 lists the items considered fundamental needs in Portugal.
Identification of fundamental needs associated with
objective and subjective poverty: Poverty and deprivation
are closely related. Poverty has an objective (income) and a subjective dimension (perceived poverty). Thus, to identify the fundamental needs that were associated with poverty, we opted to include only those that were associated with both objective and subjective poverty. These two dimensions of poverty were ascertained in EU-SILC survey.
Objective poverty was determined by income. An individual is considered at-risk-of-poverty whenever his/ Table 2 - Identification of fundamental needs: proportion of Portuguese households that indicated that specific goods and services were not within their means (EU-SILC survey 2006, n = 5416 households)
Type of needs % of households that cannot afford
Keeping your house adequately warm 41.6%
Using your own means to cover a necessary yet unplanned expense 18.2%
Having a personal car 11.6%
Having a phone (including mobile phone) 5.4%
Having a washing machine 4.8%
Eating a meal containing meat, fish, or the vegetarian equivalent once every two days 4.4%
ARTIGO ORIGINAL could not afford two or more (of the five) fundamental needs
was defined as deprived.
Identifying and arranging the variables that were available at individual level (EU-SILC survey) and at ecological level (census)
The second step of the construction of EDI involved the use of ecological data from the Portuguese census. We have used data from 2001 Population and Housing Census made available by Statistics Portugal.40 Portuguese censuses are universal and exhaustive, covering the entire national population. Data was available at census tract level but EDI was built at upper aggregation level, census tract block groups, because a considerable amount of the census tracts had zero counts, not allowing to derivate a deprivation index. In 2001 there were 16 094 census tract block groups, comprising each one an average of 222 households and 643 inhabitants.
Firstly, we assessed which variables from EU-SILC survey were also present in 2001 Census data. A total of eight matching variables were found; these are listed in Table 3.
Secondly, we had to recode variables in both datasets (EU-SILC and Census) so that they become comparable (Appendix 1, available from http://www. actamedicaportuguesa.com/revista/index.php/amp/article/ view/7387/4882).
Because we wanted to calculate proportions at ecological level for each of the eight matching variables, we had to find the best way to dichotomize the variables. Some variables could only assume two possible values (such as being unemployed looking for a job; rooms in the household; household with bath/shower and household with indoor flushing), but others could assume more than two (education, occupation, age/sex and household tenure status).
To dichotomize those variables, we conducted logistic regression models to find the best fit (based on Wald χ2)
between the individual deprivation indicator and the multiple category variables (dichotomized in all possible ways). For instance, three models were run to assess the best dichotomization of the variable occupation sector: ‘primary versus secondary + terciary’; ‘secondary versus primary + terciary’ and ‘terciary versus primary + secondary’; the last her household income is below 60% of the national median
equivalised disposable income. The equivalised disposable income is equal to the net income of the household after social transfers divided by the number of household members.38 In Portugal, the at-risk-of-poverty threshold, in 2006, was 341 euros per month.39 Based on that value, 20.7% of the households were considered poor.
Subjective poverty was determined by the EU-SILC Likert-scale question ‘ability to make ends meet’ (1 - with great difficulty, 2 - with difficulty, 3 - with some difficulty, 4 - fairy easily, 5 - easily and 6 - very easily). To determine the threshold at which a person felt poor we conducted univariable logistic regressions between dependent variable objective poverty (‘poor’/’not poor’ based on the at–risk-of-poverty threshold), and the independent variable subjective poverty, dichotomized so that it covered all combinations of the answers to the question ‘ability to make ends meet’. The Wald chi-square statistic (χ2) of the
different logistic regression models was used to determine the dichotomization with the best fit; the higher the χ2 the
better the fit. In Portugal the answer 1 (‘with great difficulty’) versus the others (2 - 6) showed the best fit. Based on that threshold, 15.7% of the Portuguese households were subjectively poor.
From the previously identified fundamental needs only those significantly associated with both subjective and objective poverty were included to create the individual deprivation index. Univariable and multivariable logistic regression models were run to identify them with a significance level set up at of 5%. As a result, five of the seven items of Table 2 were considered fundamental needs: ‘Eating a meal containing meat, fish, or the vegetarian equivalent once every two days’; ‘Using your own means to cover a necessary yet unplanned expense’; ‘Keeping your house adequately warm’; ‘Having a phone (including mobile phone)’; and ‘Having a personal car’.
Creation of an individual deprivation indicator:
The previously selected five fundamental needs were used to create a binary indicator of individual deprivation. Multivariable logistic regression was run to determine the threshold number of fundamental needs that better explained objective and subjective poverty. Wald χ2 was
used for that assessment. The better fit threshold stayed on two fundamental needs, meaning that an individual that
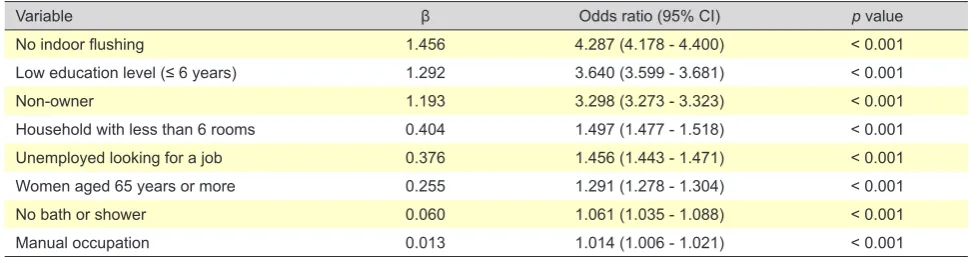
Table 3 - Final model of multivariable logistic regression selecting components of EDI, which were associated with the final individual deprivation indicator, Portuguese EU-SILC (n = 10 148)
Variable β Odds ratio (95% CI) p value
No indoor flushing 1.456 4.287 (4.178 - 4.400) < 0.001
Low education level (≤ 6 years) 1.292 3.640 (3.599 - 3.681) < 0.001
Non-owner 1.193 3.298 (3.273 - 3.323) < 0.001
Household with less than 6 rooms 0.404 1.497 (1.477 - 1.518) < 0.001
Unemployed looking for a job 0.376 1.456 (1.443 - 1.471) < 0.001
Women aged 65 years or more 0.255 1.291 (1.278 - 1.304) < 0.001
No bath or shower 0.060 1.061 (1.035 - 1.088) < 0.001
ARTIGO ORIGINAL dichotomizaton showed the best fit. Proportions of those variables, for each census tract
block group, were calculated based on the previously chosen dichotomizations: percentage of non-owned households; percentage of households without indoor flushing; percentage of individuals with low education level (≤ 6th grade); percentage of households with five rooms or less (pantries, kitchens, corridors, bathrooms and balconies excluded); percentage of unemployed looking for a job; proportion of female residents aged 65 years or more; percentage of households without bath or shower; and percentage of individuals employed in the primary/ secondary sectors (i.e., manual occupations).
Constructing an ecological deprivation index, EDI
To determine which variables were to include in the EDI, a multivariable logistic regression was run and only variables significantly associated with the individual deprivation indicator were kept. We kept all the eight variables. Then, the regression coefficients of that model (Table 3) became the weights that were assigned to each of those variables at ecological level.
Next, each ecological variable was normalized to the Portuguese national mean. The score of the Portuguese EDI for each census tract block group resulted from the following equation:
Score=% non-owned households (z-score) × 1.193 + % households without indoor flushing (z-score) × 1.456
+ % residents with low education level (≤ 6th grade) (z-score) × 1.292
+ % household with 5 rooms or less (z-score) × 0.404 + % unemployed looking for a job (z-score) × 0.376 + % female residents aged 65 years or more (z-score) × 0.255
+ % households without bath/shower (z-score) × 0.060 + % residents employed in manual occupations (z-sco-re) × 0.013
RESULTS
The Portuguese EDI had the following distribution: minimum = -8.155; maximum = 17.249; mean = 0.000 and standard deviation = 2.283. Then, each census block group was classified according to its level of deprivation using the quintiles of the EDI score as cut-offs: 1 (-8.155 to -1.774); 2 (-1.773 to -0.605); 3 (-0.605 to 0.338); 4 (0.338 to 1.581) and 5 (1.582 to 17.249).
The first quintile (least deprived) comprised 2 161 387 inhabitants (20.9% of the national population), the second 2 192 718 inhabitants (21.2%), the third 2 125 503 inhabitants, 20.5%), the fourth 2 014 442 inhabitants (19.5%), and the fifth quintile (most deprived) 1 862 045 inhabitants (18.0%).
Figure 1 - Spatial distribution of the European Deprivation Index in Continental Portugal. (A: Census block groups; B: Parishes; C: Municipalities)
A B C
EDI score (quintiles) 1 - least deprived 2
3 4
5 - most deprived
ARTIGO ORIGINAL Due to scarcity of households/population, a residual number
of 18 census block groups (22 inhabitants) ended up with no EDI score assigned.
The EDI was also computed at higher aggregation level – parish level (n = 4241) and municipality level (n = 308). Fig.s 1 and 2 show the geographical distribution of EDI in Continental Portugal and archipelagos. Portuguese EDI shows a clear geographic pattern, being the most deprived areas generally located in the South and in the Inner North and Centre of the country, whereas the least deprived areas are predominantly located in the coastal areas of North and Centre and in the Algarve.
Maps depicting the spatial distribution of EDI were produced using ArcMap 10.2.1., and statistical analysis was performed using SAS 9.1, SPSS 21 and R 3.1.1.
DISCUSSION
This article describes the methods of construction of an ecological deprivation index, the EDI, which classifies small areas of the entire country, Continental and archipelagos, according to their level of socioeconomic deprivation. To date, no other Portuguese index has covered the entire territory. The development of the EDI was grounded on a solid theoretical framework, used both individual and aggregate variables, and relied on a longitudinal Europe-wide survey that guarantee EDI can be replicated over the time and in any of the 28 EU member states.
Evidence-based, ready-to-use and understandable multivariate measures are highly required by public and political leaders.41 These measures should be developed
with involvement of relevant stakeholders and should use scientifically sound data and appropriate analytical methods.41 The EDI is a multivariate indicator that included
not only material deprivation but other conditions. EDI was grounded on the framework defined by Townsend who defended deprivation is highly dependent on the context and time and, consequently, cannot be measured based solely on material conditions.3,4 In the development of EDI, we
selected fundamental needs associated with both objective (income based) and subjective (perceived) poverty and we have followed the theoretical concept of relative deprivation. Portuguese EDI was developed based on a European-wide survey (EU-SILC), specifically designed to measure and monitor poverty and deprivation across the EU territory, which legitimize our indicator. The variables were chosen based on an individual index of deprivation, meaning we only considered those that were associated with this variable. The weights were attributed according to the role (association) each variable had in predicting individual deprivation. Most of available indicators are simply the unweighted sum of variables pragmatically chosen from the census; weighting is rare and usually justified by statistical criteria only.
Another advantage of the Portuguese EDI has to do with the fact that EU-SILC survey is conducted annually across all the European Member states. That guarantees EDI can be replicated over time, at least every ten years, when the census take place. The survey-based deprivation indexes of UK29-32 follow a similar methodology as EDI but they cannot be replicated in other European countries. Developing comparable and replicable multivariate indexes will generate comparable and replicable study findings, which is indispensable for evidence-based public health decisions.
Moreover, the EDI is currently also available in four other countries from Western Europe, France, Italy,
Figure 2 - Spatial distribution of the European Deprivation Index in Madeira and Azores Archipelagos. (A: Census block groups; B: Parishes; C: Municipalities)
A B C
EDI score (quintiles) 1 - least deprived 2
3 4
5 - most deprived
N 0 10 20 40km
0 10km
0 1530 60km
ARTIGO ORIGINAL Spain and England.
35,36 That will allow integrated studies,
something particularly useful at the present time when scientific research is getting a cross-national extend due to the European financing channels. Hopefully, in the future other countries will follow the same methods and develop their own EDI.
In Portugal, where access to micro data is usually constrained, having a deprivation index that can be recomputed at different geographical aggregation levels is also a plus. For instance, mortality data cannot be disclosed for areas smaller than parishes or municipalities. So, any neighborhood-level index would be pointless. But, when using information from individual datasets (cohort studies, cross-sectional surveys), which allow obtaining the point location of each participant, using a local measure of deprivation is crucial.
Inevitably, the EDI has also a few limitations that deserve further discussion. Firstly, the choice of the variables to include in EDI depended greatly on the information available in the EU-SILC survey and in the census. The Portuguese EDI included a total of eight variables, which is less than the number of variables included, for instance, by our French counterparts (a total of ten).35 This can obviously impact the
quality of the indicator. Another limitation of EDI is related to a widely discussed and controversial topic, the capability of a single deprivation index to discriminate rural and urban deprivation.42,43 The EU-SILC survey does not allow
weighting on urban and rural areas, which could potentially affects its capability of measuring rural deprivation.
CONCLUSIONS
In sum, we propose an alternative deprivation index for Portuguese small areas, grounded on a solid theoretical framework, using both individual and aggregate variables and relying on a longitudinal Europe-wide survey that guarantee EDI can be replicated over the time and space.
We have tried to be as explicit as possible so that any interest party could make the best use of this indicator. Hopefully, EDI will start being employed by social and medical researchers but also by regional planners, with the ultimate goal of better understanding the health inequalities not only in Portugal but also across Europe.
ACKNOWLEDGMENTS
The authors also would like to acknowledge the European Partnership for Action Against Cancer(EPAAC) for funding travelling expenses, and Eurostat and the National Institute of Statistic (INE, Instituto Nacional de Estatística) for providing us with EU-SILC and census data.
PROTECTION OF HUMANS AND ANIMALS
Ethical approval has been granted by the Ethics Committee for Health at Hospital São João / Faculty of Medicine, University of Porto. The authors declare that the procedures were followed according to the Helsinki Declaration of the World Medical Association.
DATA CONFIDENTIALITY
The authors declare having followed the protocols in use at their working center regarding patients’ data publication.
CONFLICTS OF INTEREST
The authors declare that there are no conflicts of interest.
FUNDING SOURCES
This work was supported by Portuguese funds through FCT – Fundação para a Ciência e a Tecnologia in the framework of project UID/BIM/04293/2013. AIR and MFP would also like to thank to FCT – Fundação para a Ciência e a Tecnologia for the grants PTDC/SAU-EPI/113424/2009 and SFRH/BD/82529/2011.
REFERENCES
1. Marmot M, Allen J, Bell R, Bloomer E, Goldblatt P. WHO European review of social determinants of health and the health divide. Lancet. 2012;380:1011-29.
2. World Health Organization. Social determinants of health. [Accessed 2015 Sep 16]. Available from: http://www.who.int/social_determinants/ sdh_definition/en.
3. Townsend P. Poverty in the United Kingdom. London: Allen Lane and Penguin Books; 1979.
4. Townsend P. Deprivation. J Soc Policy. 1987:125-46.
5. Holterman S. Areas of urban deprivation in Great Britain: an analysis of the 1971 census data. Social Trends. London: Office for National Statistics; 1975. p. 33-47.
6. Carstairs V, Morris R. Deprivation: explaining differences in mortality between Scotland and England and Wales. BMJ. 1989;299:886-9. 7. Townsend P, Phillimore P, Beattie A. Health and deprivation. Inequality
and the North Croom Helm. London: Routledge; 1988.
8. Ramsay SE, Morris RW, Whincup PH, Subramanian SV, Papacosta AO, Lennon LT, et al. The influence of neighbourhood-level socioeconomic deprivation on cardiovascular disease mortality in older age: longitudinal multilevel analyses from a cohort of older British men. J Epidemiol Community Health. 2015.
9. Major JM, Doubeni CA, Freedman ND, Park Y, Lian M, Hollenbeck AR, et al. Neighborhood Socioeconomic Deprivation and Mortality: NIH-AARP Diet and Health Study. PLoS ONE. 2010;5:e15538.
10. Diez Roux AV, Mair C. Neighborhoods and health. Ann N Y Acad Sci. 2010;1186:125-45.
11. Pickett K, Pearl M. Multilevel analyses of neighbourhood socioeconomic context and health outcomes: a critical review. J Epidemiol Community Health. 2001;55:111-22.
12. Santana P, Costa C, Cardoso G, Loureiro A, Ferrao J. Suicide in Portugal: spatial determinants in a context of economic crisis. Health Place. 2015;35:85-94.
13. Gotsens M, Mari-Dell’Olmo M, Perez K, Palencia L, Martinez-Beneito MA, Rodriguez-Sanz M, et al. Socioeconomic inequalities in injury mortality in small areas of 15 European cities. Health Place. 2013;24:165-72.
14. Borrell C, Mari-Dell’olmo M, Palencia L, Gotsens M, Burstrom BO, Dominguez-Berjon F, et al. Socioeconomic inequalities in mortality in 16 European cities. Scand J Public Health. 2014;42:245-54.
15. Mari-Dell’Olmo M, Gotsens M, Palencia L, Burstrom B, Corman D, Costa G, et al. Socioeconomic inequalities in cause-specific mortality in 15 European cities. J Epidemiol Community Health. 2015;69:432-41. 16. Santana P, Costa C, Mari-Dell’Olmo M, Gotsens M, Borrell C. Mortality,
material deprivation and urbanization: exploring the social patterns of a metropolitan area. Int J Equity Health. 2015;14:55.
ARTIGO ORIGINAL 18. Hoffmann R, Borsboom G, Saez M, Mari Dell’Olmo M, Burstrom B,
Corman D, et al. Social differences in avoidable mortality between small areas of 15 European cities: an ecological study. Int J Health Geogr. 2014;13:8.
19. Henriques A, Severo M, Alves L, Barros H, Azevedo A. Weight change and its determinants in Portuguese adult women: a longitudinal analysis in the EPIPorto cohort. J Epidemiol Community Health. 2015. 20. Santana P, Santos R, Nogueira H. The link between local environment
and obesity: a multilevel analysis in the Lisbon Metropolitan Area, Portugal. Soc Sci Med. 2009;68:601-9.
21. Oliveira CM, Economou T, Bailey T, Mendonca D, Pina MF. The interactions between municipal socioeconomic status and age on hip fracture risk. Osteoporos Int. 2015;26:489-98.
22. Bastos J, Peleteiro B, Barros R, Alves L, Severo M, de Fatima Pina M, et al. Sociodemographic determinants of prevalence and incidence of Helicobacter pylori infection in Portuguese adults. Helicobacter. 2013;18:413-22.
23. Alves J, Nunes C, Perelman J. Socio-economic inequalities in tobacco-related diseases in Portugal: an ecological approach. Public Health. 2015.
24. Ribeiro AI, Mitchell R, Carvalho MS, de Pina Mde F. Physical activity-friendly neighbourhood among older adults from a medium size urban setting in Southern Europe. Prev Med. 2013;57:664-70.
25. Ribeiro AI, Pires A, Carvalho MS, Pina MF. Distance to parks and non-residential destinations influences physical activity of older people, but crime doesn’t: a cross-sectional study in a southern European city. BMC Public Health. 2015;15:593.
26. Alves L, Silva S, Severo M, Costa D, Pina MF, Barros H, et al. Association between neighborhood deprivation and fruits and vegetables consumption and leisure-time physical activity: a cross-sectional multilevel analysis. BMC Public Health. 2013;13:1103. 27. Ball K, Lamb KE, Costa C, Cutumisu N, Ellaway A, Kamphuis CB, et
al. Neighbourhood socioeconomic disadvantage and fruit and vegetable consumption: a seven countries comparison. Int J Behav Nutr Phys Act. 2015;12:68.
28. Nogueira HG. Deprivation amplification and health promoting resources in the context of a poor country. Soc Sci Med. 2010;70:1391-5. 29. Northern Ireland Multiple Deprivation Measure 2010. Belfast: Northern
Ireland Statistics and Research Agency; 2010.
30. The English Indices of Deprivation 2010. London: Department for
Communities and Local Government; 2011.
31. Welsh Index of Multiple Deprivation 2011. Cardiff: Welsh Government; 2011.
32. Scottish Index of Multiple Deprivation 2012. A National Statistics Publication for Scotland. Edinburgh: Scottish Government; 2012. 33. Atkinson J, Crampton P. NZDep2013 Index of Deprivation. Wellington:
Department of Public Health, University of Otago; 2014.
34. Noble M, Wright G. The South African Index of Multiple Deprivation 2007 at Datazone Level (modelled). Pretoria: Department of Social Development; 2010.
35. Guillaume E, Pornet C, Dejardin O, Launay L, Lillini R, Vercelli M, et al. Development of a cross-cultural deprivation index in five European countries. J Epidemiol Community Health. 2015.
36. Pornet C, Delpierre C, Dejardin O, Grosclaude P, Launay L, Guittet L, et al. Construction of an adaptable European transnational ecological deprivation index: the French version. J Epidemiol Community Health. 2012.
37. EUROSTAT. EU statistics on income and living conditions (EU-SILC) methodology - private households. European Comission. [accessed 2016 Jan 10]. Available from: http://ec.europa.eu/eurostat/statistics-explained/index.php/EU_statistics_on_income_and_living_conditions_ (EU-SILC)_methodology_-_private_households.
38. EUROSTAT. Glossary: Equivalised disposable income European Comission; 2015. [accessed 2015 Nov 29]. Available from: http://ec.europa.eu/eurostat/statistics-explained/index.php/ Glossary:Equivalised_disposable_income.
39. EUROSTAT. At-risk-of-poverty thresholds (source: SILC) (ilc_li01). [accessed 2015 Nov 29]. Available from: http://ec.europa.eu/eurostat/ statistics-explained/index.php/People_at_risk_of_poverty_or_social_ exclusion. European Comission.
40. Instituto Nacional de Estatística. Antecedentes, metodologia e conceitos. Censos 2001: XIV recenseamento geral da população: IV recenseamento geral da habitação. Lisboa: INE; 2003.
41. Corvalán C, Briggs D, Zielhuis G. Decision-making in environmental health - from evidence to action. London: E & FN Spon; 2000. 42. Haynes R, Gale S. Deprivation and poor health in rural areas: inequalities
hidden by averages. Health Place. 2000;6:275-85.