International Journal of Advances in Management, Economics and Entrepreneurship
Available online at:
www.ijamee.info
RESEARCH ARTICLE
A Factor Analysis of Determinants of Human Development in Rural Odisha
Mishra SK*
Dept. of Economics, TITE, Bhubaneswar, Odisha, India.
*Corresponding Author: E-mail: [email protected]
Abstract
The ultimate purpose of the entire exercise of development is to improve the human conditions and to enlarge people’s choices. Human development is a means to higher productivity. A well nourished, healthy, educated, skilled alert labour force is the most productive asset. Improving living conditions and reduced poverty contribute to a healthy civil society and greater social stability. Human development also helps in reducing civil disturbances in the society and in increasing political stability. Human development is friendly to the physical environment also. Deforestation, desertification and soil erosion decline when poverty declines. Thus, efforts have been made in this paper to identify the important determinants of human development in the rural regions of Odisha by using multivariate factor analysis.
Keywords: Human Development, Rural, Urban, Odisha, Composite Index.
Introduction
People are the real wealth of a nation. The basic objective of development is to create an enabling environment for people to enjoy long, healthy and creative lives [1]. Human development covers the economic growth and sharing, all kinds of human needs, hunger and unemployment. In the contemporary era, human development is in greater need of analysis and clarification and the word has come to be extraordinarily widely used in public discourse probably more so than ever before in its history [2]. The concept of human development is as old as the economic thought itself, but its quantitative measurement is of recent origin. The former can be traced back to the oriental societies as their objectives have always been to maintain, improve and provide the basic requirements of nutrition, living space and social harmony [3]. Human development is evidently about enlarging people’s choices on the basis of shared natural resources. Since freedoms and capabilities possess a more expansive notion than basic needs, human development can be adopted as the expansion of people’s freedoms and capabilities to lead lives that they have reason to value. In this sense, the human development approach is consistently concerned with making sense of the world and addressing challenges now and in the future [4].
It has been observed from the extant literature that the human development is a function of the volume and quality of human resources exist in a country, the level and quality of education of its
people, the quality of health, nutrition and sanitation, the level of skill, efficiency and training of its people, rural-urban distribution, deposit of natural resources, size and allocation of financial resources, good governance and institutional indicators. All these aspects have been the subject matter of many research works [5-12]. However, the development literature is largely impaired by sufficient empirical evidence on the determinants of human development at regional levels of low and middle income countries.
It is with this backdrop, this paper proceeds to identify the important determinants of human development in the rural areas of Odisha on the basis of household level data and using exploratory factor analysis. The rest of the paper is organized as follows: Section 2 describes the data and methodology; Section 3 makes the analysis and discusses the results; and Section 4 concludes.
Data and Methodology
have surveyed two sample villages-Rajapur of the Machamara Gram Panchayat of Gajapati district and Gumagarh village of the Gumagarh Gram Panchayat of Kandhamala district of Odisha. And, I gathered ordinal data on 30 socio-economic variables from 615 households-341 from Rajapur and 274 from Gumagarh villages. All these observed socio-economic indicators have been brought to the factor analysis to form the most significant dimensions of human development for the rural region of Odisha.
Analysis and Discussion
In the analysis, I have used the principal component analysis technique of factor analysis as this allows for the extraction of as many significant factors/dimensions as possible from the
observed data set. Prior to performing the factor analysis, suitability of data for such analysis was assessed by calculating KMO statistic, and applying Bartelett’s test of sphericity. The Kaiser-Meyer-Oklin (KMO) value was 0.840, exceeding the recommended value of 0.60 [13,14] and the Bartlett’s test of Sphericity [15] reached statistical significance, supporting the factorability of the 30 observed socio-economic variables of the study. These results are shown in Table-1. Then, the communalities were extracted by Principal Component Analysis, and I found that all the communalities are all above 0.30. This confirms that each variable shares some common variance with other variables, and thus, can be included in the factor analysis. The results are presented in Table-2.
Table-1: KMO and Bartlett's Test
Kaiser-Meyer-Olkin Measure of Sampling Adequacy. 0.840
Bartlett's Test of Sphericity Approx. Chi-Square 15345.760
df 435
Sig. 0.000
Table 2: Communalities
Variables Initial Extraction
Household Monthly Per Capita Income 1.000 .840
Household Monthly Per Capita Consumption Expenditure 1.000 .903
Household Monthly Per Capita Food Expenditure 1.000 .831
Household Monthly Per Capita Health Expenditure 1.000 .838
Household Monthly Per Capita Education Expenditure 1.000 .582
Household Monthly Per Capita Transport and Communication Expenditure 1.000 .817
Household Literacy 1.000 .807
Household Female Literacy 1.000 .938
Household Adult Literacy 1.000 .818
Household Female Adult Literacy 1.000 .868
Household Youth Literacy 1.000 .825
Household Female Youth Literacy 1.000 .786
Enrollment in Primary Education 1.000 .766
Enrollment in Secondary Education 1.000 .659
Enrollment in Tertiary Education 1.000 .702
Gross Enrollment 1.000 .891
Highest Level of Education Attainment 1.000 .759
Female Highest Level of Education Attainment 1.000 .702
Pre-School Child Education 1.000 .887
Pre-School Female Child Education 1.000 .850
Household Employment 1.000 .581
Household Female Employment 1.000 .722
Roof of the House 1.000 .802
Housing Condition 1.000 .652
Household Source for Safe Drinking Water 1.000 .363
Household Kitchen Facility 1.000 .855
Household Provision for Fuel for Cooking 1.000 .445
Household Provision for Lighting 1.000 .781
Physical Access to Healthcare Facility 1.000 .772
Extraction Method: Principal Component Analysis.
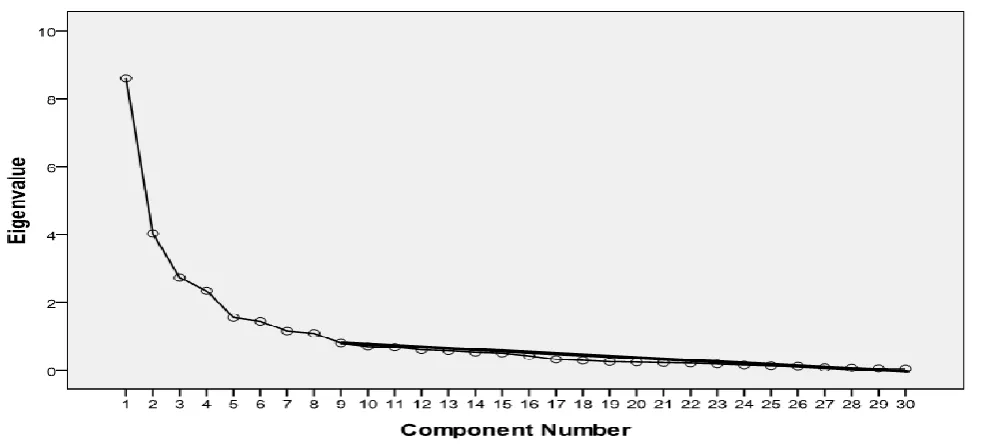
Then I calculated the eigenvalues with the help of principal component analysis to explain the degree of variance in the data, and extract relevant underlying dimensions of human development. The results are presented in Table-3 which shows that all the 30 socio-economic variables explain 100 per cent variance in the data. The application of principal component
analysis for factor extraction revealed the presence of eight components with eigenvalues exceeding 1.0, explaining 28.65 per cent, 13.4 per cent, 9.07 per cent, 7.78 per cent, 5.16 per cent, 4.78 per cent, 3.83 per cent, and 3.6 per cent of the variance respectively. Thus, in total all these eight factors explain 76.31 per cent variance in human development of rural region of Odisha at the household level.
Table 3: Total variance explained
Component
Initial eigenvalues
Extraction sums of squared loadings
Rotation sums of squared loadings
Total % Variance of Cumulative % Total % of Variance Cumulative % Total % Variance of Cumulative %
1 8.597 28.657 28.657 8.597 28.657 28.657 5.961 19.870 19.870 2 4.022 13.406 42.063 4.022 13.406 42.063 3.982 13.274 33.145 3 2.722 9.073 51.135 2.722 9.073 51.135 3.730 12.433 45.578 4 2.335 7.784 58.919 2.335 7.784 58.919 2.406 8.021 53.599 5 1.551 5.169 64.088 1.551 5.169 64.088 2.185 7.283 60.883 6 1.437 4.789 68.877 1.437 4.789 68.877 1.902 6.342 67.224 7 1.149 3.831 72.708 1.149 3.831 72.708 1.370 4.568 71.792 8 1.081 3.602 76.310 1.081 3.602 76.310 1.355 4.517 76.310 9 .801 2.669 78.978
10 .693 2.310 81.288 11 .673 2.245 83.533 12 .596 1.986 85.519 13 .568 1.893 87.412 14 .523 1.744 89.156 15 .497 1.657 90.813 16 .418 1.393 92.206 17 .318 1.060 93.266 18 .288 .959 94.225 19 .248 .828 95.053 20 .236 .787 95.840 21 .221 .737 96.577 22 .209 .696 97.272 23 .183 .612 97.884 24 .152 .508 98.392 25 .130 .435 98.826 26 .121 .403 99.229 27 .079 .263 99.492 28 .064 .215 99.707 29 .047 .155 99.862 30 .041 .138 100.000
Extraction Method: Principal Component Analysis.
In order to confirm the above findings, I have used the Scree Plot technique. The Fig.1 shows the Scree Plot of the extracted components. An
ofhuman development for further investigation. The retaining of these extracted eight factors/dimensions from the original 30 observed
socio-economic variables have been justified by Kaiser’s rule and Scree plot.
Fig. 1: Scree Plot of extracted components
Once the number of factors to be retained is determined, the next step is to try to interpret them. To assist in this process the factors are ‘rotated’. This does not change the underlying solution – rather, it presents the pattern of loadings in a manner that is easier to interpret. The rotation maximizes high item/variable loadings and minimizes low item loadings thereby producing a more interpretable and simplified solution. Thus, to aid the interpretation of the retained eight factors, Orthogonal Varimax rotation has been performed, and the results are presented in Table-4. In the Rotated Component Matrix, I analyze the loadings of each of the variables on the eight factors that have been selected. I look for the highest loading variables on each of the component-these can be used to identify the nature of the underlying dimensions of human development represented by each
component. I have considered only factor loadings with an absolute value greater than 0.50.
It is clear from the Table -4 that seven observed variables are loaded to the component/dimension-1. These variables are monthly per capita income, monthly per capita consumption expenditure, monthly per capita food expenditure, monthly per capita health expenditure, monthly per capita education expenditure, monthly per capita transport and communication expenses, and physical access to healthcare facilities. All these seven indicators reveal the economic condition of households in the rural region of Odisha, and thus, dimension-1 of the human development may be labelled as ‘Economic Attainment Indicators of Human Development’. All these indicators altogether explain 28.65 per cent variation in the data.
Table 4: Rotated component matrix#
Determinants Component
1 2 3 4 5 6 7 8 Household Monthly Per Capita Consumption Expenditure .889
Household Monthly Per Capita Health Expenditure .887 Household Monthly Per Capita Transport and Communication Expenditure .864 Physical Access to Healthcare Facility .864 Household Monthly Per Capita Food Expenditure .827 Household Monthly Per Capita Income .802 Household Monthly Per Capita Education Expenditure .715 Household Provision for Fuel for Cooking
Household Sanitation Facility .819
Roof of the House .791
Household Provision for Lighting .782
Housing Condition .685
Household Source for Safe Drinking Water
Household Female Literacy .954
Household Female Adult Literacy .910
Female Highest Level of Education Attainment .807
Household Adult Literacy .745
Household Literacy .720
Household Youth Literacy .882
Household Female Youth Literacy .874
Enrollment in Tertiary Education .830
Gross Enrollment .898
Enrollment in Primary Education .785
Enrollment in Secondary Education .732
Pre-School Child Education .925
Pre-School Female Child Education .915
Highest Level of Education Attainment .802
Household Employment .631
Household Female Employment -.821
Extraction Method: Principal Component Analysis. Rotation Method: Varimax with Kaiser Normalization. # Rotation converged in 6 iterations.
Similarly, the component-2 consists of five observed variables, viz., kitchen facilities, sanitation, housing condition, roof type, and provision for lighting at the household level. All these five indicators relate to the basic amenities required at the household level to reflect human development. Thus, dimension-2 of the human development in the rural region of Odisha may be labelled as ‘Basic Amenities Attainment Indicators of Human Development’. All these indicators altogether explain 13.4 per cent variation in the data.
It is revealed that component-3 has been loaded by five indicators, viz., overall literacy, adult literacy, female literacy, adult female literacy, and highest level of attainment of education by female members at household level. Further, these indicators relate to the attainment of education that reflects the human development at the household level. Thus, the component-3 may be labelled as ‘Literacy and General Education Attainment Indicators of Human Development’. This dimension explains 9.07 per cent variance in the data.
There are three indicators loaded to the component-4. These are youth literacy, female youth literacy and enrollment in tertiary education. All these relate to the attainment of
higher education and thus, influence human development of the rural region of Odisha. So, this component can be labelled as ‘Higher Education Attainment Indicators of Human Development’ and it explain 7.78 per cent of variance in data. Similarly, three indicators, viz., gross enrolment, enrolment in primary education and enrolment in secondary education are loaded to component-5. All these indicators relate to the enrolment level in education in the rural region of Odisha. Thus, component-5 can be labelled as ‘Enrolment Attainment Indicators of Human Development’. This component explains 5.16 per cent of variance in data.
And, the Cronbach’s Alpha for this component is less than 0.7 thereby making this component not reliable to use in further analysis. So, I drop this component.
The component-8 is loaded with only one indicator, viz., female employment at the household level. But this loading shows negative sign (-0.821). In an orthogonal set of factors, a negative loading for a variable on a component indicates that scores on the component tend to be associated with variable scores of the opposite sign. Thus, there is no doubt that negative loadings are difficult to interpret [16]. Thus, component-8 is problematic to interpret it as an indicator of human development. Here, it means the correlation between the variable ‘female employment’ and component-8 is negative. Furthermore, component-8 is defined by only one item, and so may not be a significant dimension for explaining the human development perspective.
After I determined and interpreted the various dimensions of human development through factor analysis, it is highly essential to go for the Reliability Test to know whether the identified factors are reliable or not. The most common test for reliability is Cronbach’s Alpha. It is an index of reliability associated with the variation accounted for by the true score of the underlying dimensions. The Alpha coefficient ranges in value from 0 to 1. The higher the score, the more reliable the generated scale is. Nunnaly [17] has indicated 0.7 to be an acceptable reliability coefficient, but lower thresholds are sometimes used in the literature [18]. If the Alpha value shows poor reliability, then individual variables constituting the dimension must be re-examined and modified or completely changed as needed. When I performed the reliability test by
calculating Cronbach’s Alpha, I found alpha value 0.937 for the first component, 0.826 for the second component, 0.726 for the third component, 0.805 for the fourth component, 0.773 for the fifth component, 0.863 for the sixth component, and 0.430 for the seventh component. Hence, six out of seven identified dimensions are reliable to interpret for explaining human development in the rural region of Odisha.
Besides the aforementioned components, I found certain other indicators such as household provision for fuel for cooking, and household sources of safe drinking water not explaining human development of rural Odisha significantly, and thus, are not loaded to any of the extracted dimensions.
Conclusion
In this study, the multivariate econometric technique of exploratory factor analysis has been applied to identify the underlying significant dimensions of human development in rural regions of Odisha. It has been found that the dimensions such as economic, basic amenities, literacy and general education, higher education, enrolment level, and child education are important in rural regions of Odisha in influencing the level of human development. It has also been found that certain factors such as household employment status, highest level of education attainment, etc. are not very significant in influencing human development. Thus, if the government of Odisha has to formulate plans and policies to enhance the level of human development in the state, then the aforesaid findings would definitely be helpful to address the problems and perspectives at the bottom of the pyramid.
References
1. UNDP (1995) Human Development Report, The United Nations Development Programme. New York: Oxford University Press.
2. Payne A, Phillips N (2010) Development. Cambridge, UK: Polity Press.
3. Kundu A, Shariff A, Ghosh PK (2002) Indexing Human Development in India: Indicators, Scaling and Composition, Working Paper Series No.83, National Council of Applied economic Research, New Delhi, India.
4. UNDP (2011) Human development report 2011, Sustainability and equity: A better future for all. New York: Palgrave Macmillan.
5. Purohit BC (2008) Health and human development at sub-state level in India”. The Journal of Socio-Economics, 37(6):2248-2260 6. Nayak, Purusottam (2009) “Human Development
Reports on North-East India: A Bird’s Eye View”, MPRA Paper No. 17015.
7. Molina, George Gray and Purser, Mark (2010) “Human Development Trends since 1970s: A Social Convergence Story”, Human Development research Paper 2010/02, UNDP
9. Mayer-Foulkes D (2010) Divergences and Convergences in Human Development, Human Development Research Papers HDRP-2010-20, Human Development Report Office, United Nations Development Programme.
10. Tripathy U (2010) “Estimation of Human Development Index in Orissa: District-Wise Analysis”. The IUP Journal of Managerial Economics, 8(4):54-68
11. Asongu Simplice A (2011) Financial determinants of human development in developing countries, MPRA Paper No. 33949.
12. Purohit Brijesh C (2012) Poverty, Human Development and Health Financing in India”, working paper series No. 66/2012, Madras School Of Economics, India.
13. Kaiser HF (1974) An index of factor simplicity. Psychometrika, 39:31-36.
14. Kaiser HF (1970) A Second Generation Little Jiffy. Psychometrika, 35(4):401-415.
15. Bartlett MS (1954) A note on the multiplying factors for various chi-square approximations”. Journal of the Royal Statistical Society, 16(Series B):296-298.
16. Lawley DN, Maxwell AE (1963) Mathematical Statistics: Factor Analysis, Butterworths, London.
17. Nunnally JC (1978) Psychometric theory (2nd ed.)
New York: McGraw-Hill.