Lucrări ştiinŃifice Zootehnie şi Biotehnologii, vol. 41 (1) (2008), Timişoara
INFLUENCE OF PH ON THE PROPORTION OF UNIONIZED
AMMONIA IN RUMEN
INFLUEN
ł
A PH-ULUI ASUPRA PROPOR
ł
IEI
AMONIACULUI NEIONIZAT DIN RUMEN
CĂPRIłĂ RODICA*, STĂNCULEł JANA*, DRINCEANU D.*, CĂPRIłĂ A.**, BENCSIK I.*
*Faculty of Animal Sciences and Biotechnologies Timişoara, Romania ***Faculty of Food Technology Timişoara, Romania
Protonation and deprotonation of ammonia provides a mechanism for movement of the molecule across membranes and they make ammonia an important intermediate in acid-base regulation as well as N metabolism. Only unionized ammonia molecules are able to penetrate the rumen wall proportional to their concentration. Rising pH dramatically increases the percentage of unionized ammonia. The ratio of the ammonium ion, NH4+, to ammonia, NH3 is inversely related to pH. The study
had in view to establish the content of free and ionized ammonia in the rumen fluid under the influence of nutritional factors (slow release urea, sugar, live yeasts and premix) in five periods. Each increase in pH by 0.5 units further increases free ammonia percentage by the average factor of 3.27. The decrease in pH with 0.5 units from 6.8 to 6.3 induces an increase in the NH4+ proportion from 99.0% to
99.7% while the decrease in pH with 0.5 units from 6.3 to 5.8 induces an increase in NH4+ proportion from 99.7% to 99.9%.
Key words: free ammonia, ionized ammonia, pH
Introduction
Evolution of symbiosis among ruminal microbes and their host, as well as symbiosis among the microbes themselves (Males, 1970), has placed ammonia as a major component of nitrogen metabolism in ruminants (Bach et al., 2005).
Many of the cellulolytic bacteria prefer or require N in the form of ammonia (Russell et al., 1992), thus forming a link between transformation of N different sources (amino acids, proteins, peptides, amines, amides, nitrates, nitrites, urea etc.) to ammonia and fermentation of fiber.
The first step in ammonia uptake is transportation across the cell membrane. Only unionized ammonia molecules are able to penetrate the rumen wall proportional to their concentration (Remond, 1993).
Because physiological pH is usually 2 pH units or more less than the ammonia-ammonium pKa, essentially all ammonia in ruminants or their gastrointestinal tract is in the protonated, NH4
+
form. Protonation and deprotonation of ammonia provides a mechanism for movement of the molecule across membranes, and they make ammonia an important intermediate in acid-base regulation as well as N metabolism (Tan, 2004). For purposes of this discussion, “ammonia” will include both ammonia and ammonium, unless otherwise specified.
Material and Methods
The experiments were carried out at a private dairy farm on a Holstein-Friesian cow fitted with rumen cannula. The content of ammonia in the rumen fluid was established under the influence of nutritional factors in the following periods: Period I - basis diet with 12.46 UFL; 1242 g PDIN, and 1350g PDIE;
Period II - basis diet + 160 g slow release urea (SRU) which ensured 1398 g PDIN and 1392 g PDIE;
Period III- basis diet + 160 g SRU +320 g sugar;
Period IV- basis diet +160 g SRU+320 g sugar +10g live yeasts (Yea Sacc 1026); Period V- basis diet + 160 g SRU +320 g sugar +10g live yeasts + 50 g premix.
After each period of 14 days feeding the same diet and supplement, 8 samples of rumen fluid were collected during 3 days, at: 8 a.m., 9 a.m., 10 a.m., 11 a.m., 14 p.m., 17 p.m., 20 p.m., and 2 a.m. The pH values were measured at 5 minutes after the rumen liquid was drawn with a digital pH-meter. Total ammonia content in the rumen fluid samples was determined in the laboratory of Animal Nutrition Department by steam distillation.
Results and Discussions
Ammonia can be in two states: ionized ammonia also called the ammonium ion (NH4
+
) and non-ionized ammonia (NH3). The two sources of
ammonia (NH4 +
+NH3) are called total ammonia or simply ammonia. The
equilibrium between free ammonia and ammonium ion in aqueous solution is a function of temperature, pH and the ionic strength of the solution.
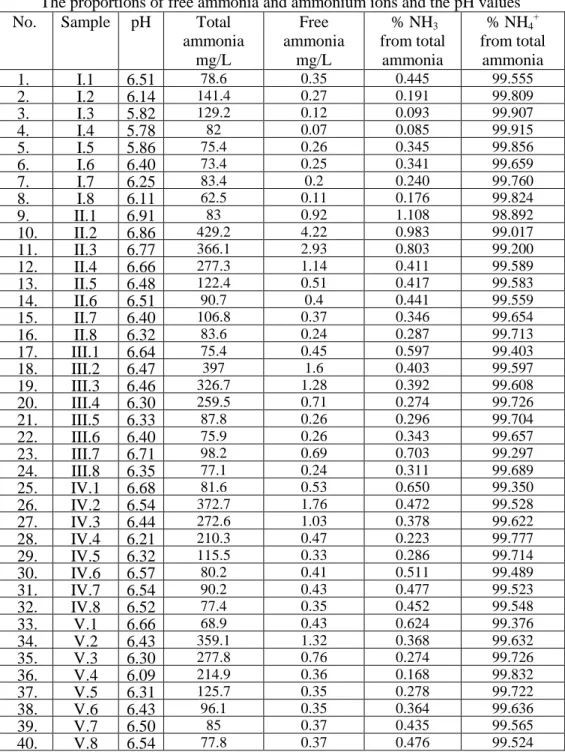
The concentrations of free ammonia and ammonium ions were calculated from pH and total ammonia concentration. The results are presented in Table 1.
In aqueous solution, NH3 exists in equilibrium with NH4 +
, which is a weak acid that reversibly dissociates into ammonia and a proton:
) aq ( ) aq ( 3 )
aq (
4 NH H
NH+ ⇔ + +
Table 1
The proportions of free ammonia and ammonium ions and the pH values
No. Sample pH Total
ammonia mg/L
Free ammonia
mg/L
% NH3
from total ammonia
% NH4 +
from total ammonia
1. I.1 6.51 78.6 0.35 0.445 99.555
2. I.2 6.14 141.4 0.27 0.191 99.809
3. I.3 5.82 129.2 0.12 0.093 99.907
4. I.4 5.78 82 0.07 0.085 99.915
5. I.5 5.86 75.4 0.26 0.345 99.856
6. I.6 6.40 73.4 0.25 0.341 99.659
7. I.7 6.25 83.4 0.2 0.240 99.760
8. I.8 6.11 62.5 0.11 0.176 99.824
9. II.1 6.91 83 0.92 1.108 98.892
10. II.2 6.86 429.2 4.22 0.983 99.017
11. II.3 6.77 366.1 2.93 0.803 99.200
12. II.4 6.66 277.3 1.14 0.411 99.589
13. II.5 6.48 122.4 0.51 0.417 99.583
14. II.6 6.51 90.7 0.4 0.441 99.559
15. II.7 6.40 106.8 0.37 0.346 99.654
16. II.8 6.32 83.6 0.24 0.287 99.713
17. III.1 6.64 75.4 0.45 0.597 99.403
18. III.2 6.47 397 1.6 0.403 99.597
19. III.3 6.46 326.7 1.28 0.392 99.608
20. III.4 6.30 259.5 0.71 0.274 99.726
21. III.5 6.33 87.8 0.26 0.296 99.704
22. III.6 6.40 75.9 0.26 0.343 99.657
23. III.7 6.71 98.2 0.69 0.703 99.297
24. III.8 6.35 77.1 0.24 0.311 99.689
25. IV.1 6.68 81.6 0.53 0.650 99.350
26. IV.2 6.54 372.7 1.76 0.472 99.528
27. IV.3 6.44 272.6 1.03 0.378 99.622
28. IV.4 6.21 210.3 0.47 0.223 99.777
29. IV.5 6.32 115.5 0.33 0.286 99.714
30. IV.6 6.57 80.2 0.41 0.511 99.489
31. IV.7 6.54 90.2 0.43 0.477 99.523
32. IV.8 6.52 77.4 0.35 0.452 99.548
33. V.1 6.66 68.9 0.43 0.624 99.376
34. V.2 6.43 359.1 1.32 0.368 99.632
35. V.3 6.30 277.8 0.76 0.274 99.726
36. V.4 6.09 214.9 0.36 0.168 99.832
37. V.5 6.31 125.7 0.35 0.278 99.722
38. V.6 6.43 96.1 0.35 0.364 99.636
39. V.7 6.50 85 0.37 0.435 99.565
Total ammonium concentration can be used in combination with H+ concentration [H+] and literature values of Ka to calculate the NH3 concentration:
( )
] H [ K
] NH .[ K NH
) aq ( a
aq X a ) aq (
3 +
+ =
The variation in pH by 0.5 units induces a variation in free ammonia percentage of 3.58 times in period I, 3.27 times in period II, 3.19 times in period III, 3.09 times in period IV, and 3.25 times in period V.
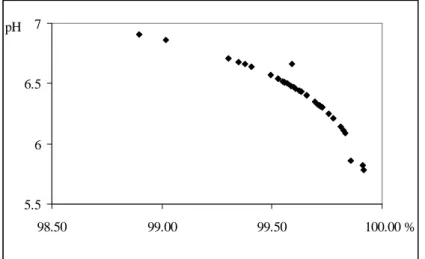
Figure 1 reveals that the variation of NH4 +
proportion as a function of pH is not linear. The decrease in pH with 0.5 unit from 6.8 to 6.3 induces an increase in NH4
+
proportion from 99.0% to 99.7% while the decrease in pH with 0.5 unit from 6.3 to 5.8 induces an increase in NH4
+
proportion from 99.7% to 99.9%.
5.5 6 6.5 7
98.50 99.00 99.50 100.00 %
pH
Figure 1. Variation of NH4 +
proportion as a function of pH
0.0% 20.0% 40.0% 60.0% 80.0% 100.0% 120.0%
1 3 5 7 9 11 13 15 17 19 21 23 25 27 29 31 33 35 37 39 5.2 5.4 5.6 5.8 6 6.2 6.4 6.6 6.8 7
When comparing the five experimental periods (Figure 2), we observe the lowest NH3 percentage in period I and the highest NH3 percentage in period II.
Conclusions
The ratio of the ammonium ion to ammonia is inversely related to pH. By decreasing the pH by 0.73 units in period I, 0.59 in period II, 0.34 units in period III, 0.47 units in period IV, and 0.57 units in period V, the NH3
percentage decreases 5.23 times in period I, 3.86 times in period II, 2.17 times in period III, 2.91 times in period IV, and 3.71 times in period V.
The variation in pH by 0.5 units induces an average variation in free ammonia percentage by 3.27 times.
The decrease in pH with 0.5 units from 6.8 to 6.3 induces an increase in NH4
+
proportion from 99.0% to 99.7% while the decrease in pH with 0.5 units from 6.3 to 5.8 induces an increase in NH4
+
proportion from 99.7% to 99.9%.
Bibliography
1. Bach A., Calsamiglia S., Stern M. D. (2005) - Nitrogen Metabolism in the Rumen, J. Dairy Sci. 88, p.E9-E21
2. Males J. R., Purser D. B. (1970) - Relationship between rumen ammonia levels and the microbial population and volatile fatty acid proportions in faunated and defaunated sheep, Appl Environ Microbiol., 19(3), p. 485-490
3. Remond D., Chaise J. P., Delval E. (1993) – Net transfer of urea and ammonia across the ruminal wall of sheep, J. Anim Sci., 71, p.1263-1270
4. Russell, J. B., O’Connor J. D., Fox D. G., Van Soest P. J., and Sniffen C. J.. (1992) - A net carbohydrate and protein system for evaluating cattle diets: I. Ruminal fermentation. J. Anim. Sci., 70, p.3551–3561
5. Tan, Z., Murphy, M. R. (2004) - Ammonia production, ammonia absorption, and urea recycling in ruminants. A review, Journal of Animal and Feed Sciences, (Vol. 13) (No. 3) p. 389-404