VOLUME 18 ISSUE 3 (2020), Page 241 – 250
EVALUATION OF LEVEL OF SERVICE (LOS) ON ROUTES OF
SMART BUS IN KAJANG, SELANGOR
Nur Shazreena Mat Shukri1, Zakiah Ponrahono2, Yakin Nur Sunoto3, &
Wan Noratikah Wahidah Wan Ghazali4
1,2,3,4 Departmentof Environment
Faculty of Forestry and Environment
UNIVERSITI PUTRA MALAYSIA
Abstract
Level of service (LOS) is a method used for the development of transportation infrastructure designations based on a specific analysis. The concept of LOS lies on the importance of an assessment of roadway operational performance services for the improvement of bus service delivery. A high performance of bus service delivery could relatively influence the satisfaction level of its users. This study assesses the LOS of three main designated routes of SMART buses in Kajang Selangor (KJ01, KJ02, and KJ03). The SMART buses are free buses provided under a free transit programme which aims to encourage people to use public transportation. An on-board survey and inventory observation were employed to collect the data. Findings indicate that KJ01, KJ02, and KJ03 fall under the category of LOS D considering the attributes of service frequency, service hours, passenger load/thresholds, and speed of bus. The discovery may serve as a useful guidance for the development of a comprehensive plan for LOS to be coordinated in improving the service quality of bus transportation.
INTRODUCTION
The concept of free-fare public transportation known as SMART buses was introduced in Kajang by the local authorities in 2016. According to Goodman et
al. (2014), this free bus concept can facilitate passengers’ ability to travel in a
way of their choice and their freedom to practice independently while riding a bus. However, the trend of using a bus as a mode of public transportation has declined throughout the years due to the mode’s less competitive service
performance compared to other motorised modes (Hu, Zhao, & Wang, 2015). As noted by Cats et al. (2017), although the free-fare public transportation has been operated within a large public transportation system, they have yet to undergo rigorous evaluation.
The Selangor state is known for having the highest number of average daily traffic (ADT) of about 412 155 vehicles on road compared to other states in Malaysia (Ministry of Transport Malaysia, 2017). This number indicates that many of the road users in the state have chosen private vehicles over public transportation to commute daily. In response to this scenario, the Selangor state government introduced an initiative to shift the modal split of the state towards public transportation orientation. The SMART bus, also known as Selangorku bus, was introduced to promote free-fair, high-service frequency buses to influence passengers to switch their mode of transportation. Towards achieving this aim, the quality of services provided by the free buses needs to be on certain standards of performance. A service quality assessment is therefore necessary towards achieving a service delivery that portrays a good image of accessibility and mobility of places (Das & Pandit, 2013). According to Bachok, Osman, and Ponrahono (2014) a good service quality is one of the key developments for economic growth; such quality not only contributes to giving less impact to the environment but is also a major factor in supporting the capacity of population growth of places. In addition, the quality of service delivery of public transportation plays an important role in influencing more users to shift their mode of transportation within places. Given these points, the LOS standard assessment can be employed as a main tool for determining the quality of services provided by a facility (Das & Pandit, 2013).
This study focuses on Kajang, Selangor, specifically on the three main routes of
the SMART buses. The LOS measurements were used to measure the buses’
service quality from the perspectives of the actual passengers who ride the buses. Results from the assessment may be used to aspire improvement of the service delivery of the SMART buses for current and future passengers (Ponrahono et al., 2015). This study aimed to determine the service quality performance of SMART buses of selected routes in Kajang, Selangor. The objectives of the study are to examine the level of service (LOS) of the SMART bus service delivery in Kajang, Selangor; and to determine the highest and lowest level of service (LOS) of the SMART bus service delivery in Kajang, Selangor.
RESEARCH METHODOLOGY
Study Area
Spanning 9298 hectares, Kajang is located 14 miles from the southeast of Kuala Lumpur and isdirectly linked to Putrajaya (national administrative centre) and Cyberjaya (national multimedia city). The SMART buses in Kajang operate in five routes: KJ01, KJ02, KJ03, KJ04, and KJ05. This study focuses on three of the main routes (KJ01, KJ02 and KJ03) that have been in operation for more than three years compared to two other routes. Table 1 provides a summary of the routes studied.
Table 1: Information of Bus Routes for KJ01, KJ02 and KJ03
Information KJ01 KJ02 KJ03
Distance 20 km 19.8 km 14 km
Total number of bus 4 diesel buses 2 diesel buses 2 diesel buses Location Bandar Kajang –
Komplek Hentian Kajang
Komuter Bangi –
Bandar Seri Putra
– Bandar Bukit Mahkota
Stesen MRT BTHO – Cheras
Perdana –
Taman Tun Perak
Frequency 20 minutes 30 minutes 30 minutes
Source: Kajang Municipal Council Management (2018)
Level of Service (LOS)
An LOS assessment was made based on the attribute of fixed-route service frequency, fixed-route hours, passenger threshold, and bus speed.
Fixed-route service frequency
Table 2: Fixed-route Service Frequency
LOS Average Headway (min) Remarks
A < 10 Passengers do not need schedule
B 10 - 14 Frequent service, passengers consult schedule
C 15 – 20 Maximum desirable time to wait if bus/train missed
D 21 – 30 Service unattractive to choice riders E 31 – 60 Service available during the hour F > 60 Service unattractive to all riders
Source: Adopted from Haron & Tahir (2018); Ponrahono et al. (2015); Transportation Research Board (2013); Yaakub & Napiah (2011)
Fixed hours of service
Table 3 below summarises the LOS indicator for hours of service.
Table 3: Fixed Hours of Service
LOS Hours of Service Remarks
A 19 – 24 Night “owl” service provided
B 17 – 18 Late evening service provided
C 14 – 16 Early evening service provided
D 12 - 13 Day time service provided
E 4 - 11 Peak hour service only or limited midday service
F 0 - 3 Very limited or no service
Source: Adopted from Haron & Tahir (2018); Ponrahono et al. (2015); Transportation Research Board (2013; Yaakub & Napiah (2011)
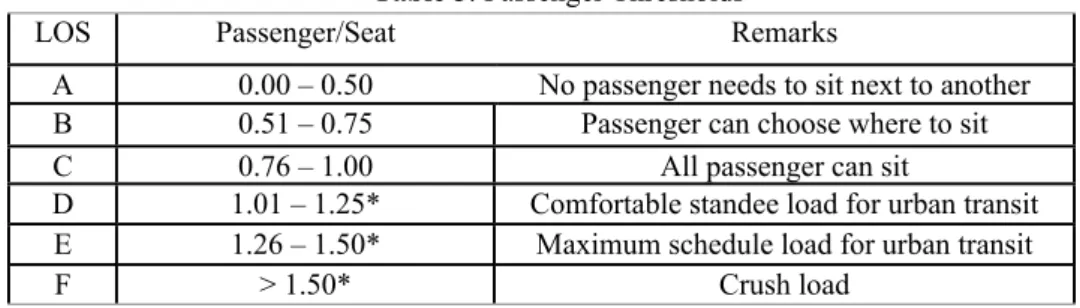
Passenger thresholds
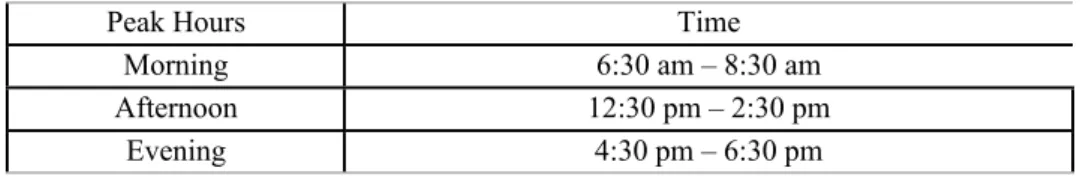
The attribute refers to passengers that have the opportunities to obtain a seat when riding the bus and to identify the overall crowding level on the vehicles (Transportation Research Board, 2013). Passenger load was studied during peak hours on weekdays and weekends (Haron & Tahir, 2018). Table 4 shows the peak hours involved during the data collection and Table 5 summarises the LOS indicator for this attribute. The data were collected for three days on weekdays and one day during a weekend.
Table 4: Peak Hours during Weekdays and Weekend
Peak Hours Time
Morning 6:30 am – 8:30 am
Afternoon 12:30 pm – 2:30 pm
Table 5: Passenger Thresholds
LOS Passenger/Seat Remarks
A 0.00 – 0.50 No passenger needs to sit next to another B 0.51 – 0.75 Passenger can choose where to sit
C 0.76 – 1.00 All passenger can sit
D 1.01 – 1.25* Comfortable standee load for urban transit E 1.26 – 1.50* Maximum schedule load for urban transit
F > 1.50* Crush load
Source: Adopted from Ponrahono et al. (2015); Napiah, Kamaruddin, & Suwardo (2011)
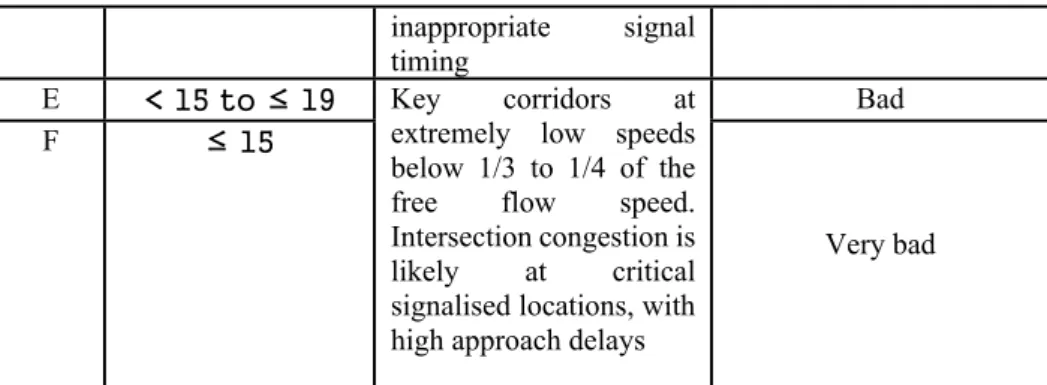
Bus speed
According to Ponrahono et al. (2016), bus speed is known as an acceptable indicator of how a bus deals with the traffic conditions along the designated routes. Table 6 shows the summary of LOS for the bus speed indicator.
Table 6: Bus Speed
LOS Speed (km/h) Adapted from Ministry of Urban Development
India (n.d)
Adapted from Cortes, Gibson, Gschwender, Munizagag & Zuniga,
(2011) A < 30 Primarily free flow
movement at average travel speeds usually about 70% of the free flow speed for the key corridors
Excellent
B < 25 to ≤ 30 Small increase in traffic causing substantial increase in approach delay and hence, decrease in arterial speed
Good
C < 21 to ≤ 25
Fair
D < 19 to ≤ 21 Significant approach
delays and average travel speed of 1/3 the free flow speed or lower. Such conditions causing combination of one or more reasons such as high signal density, extensive queuing at critical intersections and
inappropriate signal timing
E < 15 to ≤ 19 Key corridors at
extremely low speeds below 1/3 to 1/4 of the free flow speed. Intersection congestion is likely at critical signalised locations, with high approach delays
Bad
F ≤ 15
Very bad
Source: Adopted from Ponrahono et al. (2015); Cortés, Gibson, Gschwender, Munizaga, & Zúñiga (2011)
On-board Survey
The on-board survey was considered the most appropriate for studying the trip characteristics of passengers, demographics, and the attitude of passengers related to the service provided to them (CJI Research Corporation, 2016; Ponrahono et al., 2015). In this study, the on-board survey was employed to gain data on the frequency of service, speed of bus, and the arrival and departure time for the buses to arrive at the stop points for the analysis of LOS (Haron & Tahir, 2018; Napiah et al., 2011)
.
RESULTS AND DISCUSSION
Fixed-route Service Frequency
Table 7 summarises the service frequency for the three main routes (KJ01, KJ02, and KJ03). KJ01 was recorded with an LOS D compared to the other two routes. The total operation hours recorded for KJ01 was 720 minutes, which was shorter compared to the hours for KJ02 and KJ03. Even though all three routes recorded a similar average frequency (approximately 30 minutes per trip), KJ01 was found to be allocated with more vehicles by the local authorities to run the operation. KJ01 offers more frequent services hence is able to shorten the passengers’
waiting time.
Table 7: Fixed-route Service Frequency at KJ01, KJ02 and KJ03 in January 2020
Route Total operation hours No. of bus Average frequency LOS
KJ01 720 minutes 4 30 minutes D
KJ02 800 minutes 2 30 minutes E
KJ03 800 minutes 2 30 minutes E
Fixed Hours of Service
Table 8 shows that the LOS for KJ01, KJ02, and KJ03 indicates that the services provide early evening transportation to passengers.
Table 8: Fixed hours of service at KJ01, KJ02 and KJ03 in January 2020
Route First trip Last trip Total service hours LOS
KJ01 7.00 am 9.38 pm 14 hours 38 minutes C
KJ02 6.30 am 9.40 pm 15 hours 10 minutes C
KJ03 6.30 am 9.41 pm 15 hours 11 minutes C
Passenger Thresholds
Table 9 shows that the three routes recorded with LOS F indicate the lowest LOS for the services provided. The number of on-board passengers during peak hours has caused the buses to be crowded, most passengers did not have chances to sit as the number of seats provided is limited (36). Most of them had to stand for a short period despite the proximity of the stop points between destinations.
Table 9: Passenger Thresholds at KJ01, KJ02 and KJ03 in January 2020
Route Seat Passenger thresholds LOS
Weekday Weekend Weekday Weekend
KJ01 36 7.31 4.64 F F
KJ02 36 7.64 3.06 F F
KJ03 36 4.94 2.36 F F
Bus Speed
KJ02 was indicated with LOS C compared to the other two routes (Table 10). This is because the traffic condition in KJ02 was not as poor as that in KJ01 and KJ03. KJ01 faces heavy traffic during peak hours, thus, the speed of buses was slower compared to the speed during normal traffic. Similarly, KJ03 faced poor traffic flow at certain locations with many stops and traffic lights; such obstructions have caused longer travel time and low speed of vehicle movement.
Table 10: Bus Speed at KJ01, KJ02, and KJ03 in January 2020
Route Total trip Travel time Speed (km/h) LOS
KJ01 20 km 63 minutes 19 E
KJ02 19.8 km 52 minutes 23 C
KJ03 14 km 50 minutes 17 E
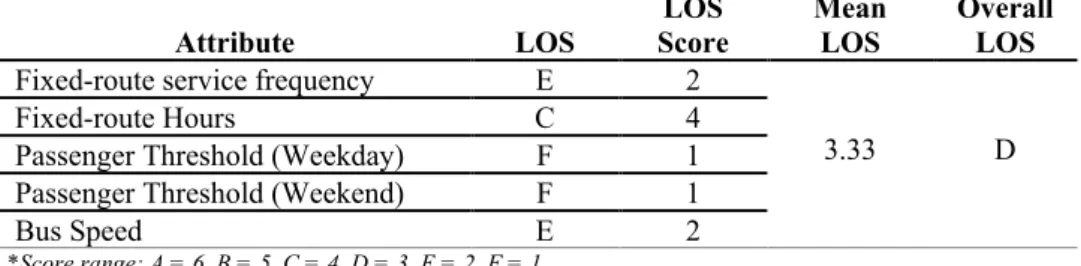
Table 11 below shows the tabulated data that represent the overall LOS for the SMART bus services in Kajang, Selangor. From the analysis, the overall LOS for SMART bus is LOS D. Hence, few improvements should be considered in delivering better services, particularly in the aspect of service frequency. This attribute brings significant impact to the other attributes, such as service hours, passenger threshold, and speed of bus.
Table 11: Summary of LOS for KJ01, KJ02, and KJ03 in January 2020
Attribute LOS Score LOS Mean LOS Overall LOS
Fixed-route service frequency E 2
3.33 D
Fixed-route Hours C 4
Passenger Threshold (Weekday) F 1 Passenger Threshold (Weekend) F 1
Bus Speed E 2
*Score range: A = 6, B = 5, C = 4, D = 3, E = 2, F = 1
CONCLUSION AND RECOMMENDATION
The conclusion of the study can be drawn as follows:
1.
The overall LOS for three main routes (KJ01, KJ02 and KJ03) is categorised under LOS D based on the four main specific attributes (fixed-route service frequency, fixed-route hours, passenger threshold and bus speed).2.
The highest number of passengers during the data collection period was during afternoon peak hours (12.30 p.m. till 2.30 p.m.). The passengers who appeared to use the public bus most frequently were school and college students.3.
The outcomes in terms of service frequency, service hours, passenger thresholds, and bus speed of service quality assessment can serve as important baseline data for improving the performance of SMART bus delivery in the future.4.
Therefore, an assessment for LOS should be imply again at the three main routes (KJ01, KJ02 and KJ03) and with the other two new routes (KJ04 and KJ05) at Kajang after improvement being made by local authorities and bus management.the usage of information technology. Updated SMART bus apps (SITS) are necessary to increase the passengers’ satisfaction level and trust
towards the service delivery.
6. It is recommended that this study be replicated with more extensive scopes. Land use catchment modelling of SMART bus services will help in providing an estimation of trip distribution based on the land use component and the trip distance along the route catchment. More frequent trips, shorter travel time and suitable drop off points can be achieved by reviewing the land use catchment and definitely encouraging the passengers to shift from private vehicle to public transportation as their main mode to reach their destination.
7. As for the implication, cost benefit analysis (CBA) on the routing catchment will bring a huge impact within the changes of operation cost and ensuring the sustainability of the free bus services.
8. Hence, embedded land use catchment modelling and CBA in the LOS assessment of free bus services should become parts of the main parameter in achieving a sustainable public transportation system in Malaysia. Further study using empirical evidence through quantitative approach on embedded land use catchment modelling and cost benefit analysis of routing catchment (CBA) into the LOS assessment is recommended.
ACKNOWLEDGEMENTS
This research was fully supported by Putra Grant UPM – Putra Young Initiative (GP-IPM/2018/9592500).
REFERENCES
Bachok, S., Osman, M. M., & Ponrahono, Z. (2014). Passenger’s Aspiration Towards
Sustainable Public Transportation System: Kerian District, Perak, Malaysia. Procedia - Social and Behavioral Sciences, 153, 553–565. https://doi.org/10.1016/j.sbspro.2014.10.088
Cats, O., Susilo, Y. O., & Reimal, T. (2017). The prospects of fare-free public transport: evidence from Tallinn. Transportation, 44(5), 1083–1104. https://doi.org/10.1007/s11116-016-9695-5
Chen, K. ., & Larry, S. . (2009). Determination of Level of Service ( LOS ) on Different Roads in Kuching Area ( A Case study ). UNIMAS E-Journal of Civil Engineering, 1(1), 1–6.
CJI Research Corporation. (2016). An Onboard Survey Of GoTriangle Passengers. Cortés, C. E., Gibson, J., Gschwender, A., Munizaga, M., & Zúñiga, M. (2011).
Das, S., & Pandit, D. (2013). Methodology to determine level of service for bus transit in a developing country like India. Proceedings of CUPUM 2013: 13th International Conference on Computers in Urban Planning and Urban Management - Planning Support Systems for Sustainable Urban Development, 1–24.
Goodman, A., Jones, A., Roberts, H., Steinbach, R., & Green, J. (2014). “We Can All Just Get on a Bus and Go”: Rethinking Independent Mobility in the Context of the
Universal Provision of Free Bus Travel to Young Londoners. Mobilities, 9(2), 275–293. https://doi.org/10.1080/17450101.2013.782848
Haron, N. F., & Tahir, W. (2018). Assessing Bus Performance Rating in Kajang , Selangor. IOP Conf. Series: Earth and Environmental Science 140, 1–9.
Hu, X., Zhao, L., & Wang, W. (2015). Impact of perceptions of bus service performance on mode choice preference. Advances in Mechanical Engineering, 7(3), 1–11. https://doi.org/10.1177/1687814015573826
Ministry of Transport Malaysia. (2017). Statistik Pengangkutan Malaysia. In Statistik
Pengangkutan Malaysia 2017. Retrieved from
http://www.mot.gov.my/my/Statistik Tahunan Pengangkutan/Statistik Pengangkutan Malaysia 2017.pdf
Napiah, M., Kamaruddin, I., & Suwardo. (2011). Punctuality index and expected average waiting time of stage buses in mixed traffic. WIT Transactions on the Built Environment, 116(September 2014), 215–226. https://doi.org/10.2495/UT110191
Ponrahono, Z., Bachok, S., Ibrahim, M., & Osman, M. M. (2016). Assessing Passengers’
Satisfaction Level on Bus Services in Selected Urban and Rural Centres of Peninsular Malaysia. Procedia - Social and Behavioral Sciences, 222, 837–844. https://doi.org/10.1016/j.sbspro.2016.05.183
Ponrahono, Z., Bachok, S., Mohamaed Osman, M., Ibrahim, M., & Abdullah, M. F. (2017). Public Bus Level of Service Performance in Peninsular. Journal of the Malaysian Institute of Planners, 15(1), 229–234.
Ponrahono, Z., Bachok, S., Osman, M. M., Ibrahim, M., Abdullah, M. F., & Abdullah, A. (2015). Assessing the urban and rural stage bus services disparities in Peninsula
Malaysia. Planning Malaysia, 13, 65–84.
https://doi.org/10.21837/pmjournal.v13.i5.140
Transportation Research Board. (2000). Highway capacity manual.
Transportation Research Board. (2013). Transit Capacity and Quality of Service Manual, Third Edition. In Transit Capacity and Quality of Service Manual, Third Edition. https://doi.org/10.17226/24766
Yaakub, N., & Napiah, M. (2011). Public bus passenger demographic and travel characteristics a study of public bus passenger profile in Kota Bharu, Kelantan. 2011 National Postgraduate Conference - Energy and Sustainability: Exploring
the Innovative Minds, NPC 2011, 1–6.
https://doi.org/10.1109/NatPC.2011.6136379