The Thirty-Third AAAI Conference on Artificial Intelligence (AAAI-19)
Modelling of Bi-Directional Spatio-Temporal Dependence and
Users’ Dynamic Preferences for Missing POI Check-In Identification
Dongbo Xi,
1,2Fuzhen Zhuang,
1,2,∗Yanchi Liu,
3Jingjing Gu,
4Hui Xiong,
5Qing He
1,2 1Key Lab of Intelligent Information Processing of Chinese Academy of Sciences (CAS),Institute of Computing Technology, CAS, Beijing 100190, China 2University of Chinese Academy of Sciences, Beijing 100049, China 3Management Science & Information Systems, Rutgers University, USA
4Nanjing University of Aeronautics and Astronautics, Nanjing, China 5Business Intelligence Lab, Baidu Inc., Beijing, China
{xidongbo17s, zhuangfuzhen, heqing}@ict.ac.cn, [email protected], [email protected], [email protected]
Abstract
Human mobility data accumulated from Point-of-Interest (POI) check-ins provides great opportunity for user behavior understanding. However, data quality issues (e.g., geoloca-tion informageoloca-tion missing, unreal check-ins, data sparsity) in real-life mobility data limit the effectiveness of existing POI-oriented studies, e.g., POI recommendation and location pre-diction, when applied to real applications. To this end, in this paper, we develop a model, named Bi-STDDP, which can in-tegrate bi-directional spatio-temporal dependence and users’ dynamic preferences, to identify the missing POI check-in where a user has visited at a specific time. Specifically, we first utilize bi-directional global spatial and local temporal in-formation of POIs to capture the complex dependence rela-tionships. Then, target temporal pattern in combination with user and POI information are fed into a multi-layer network to capture users’ dynamic preferences. Moreover, the dynamic preferences are transformed into the same space as the de-pendence relationships to form the final model. Finally, the proposed model is evaluated on three large-scale real-world datasets and the results demonstrate significant improvements of our model compared with state-of-the-art methods. Also, it is worth noting that the proposed model can be naturally extended to address POI recommendation and location pre-diction tasks with competitive performances.
Introduction
Recent years have witnessed the rapid development and popularity of location-based social networks (LBSNs) and location-based services (LBS). These services have attracted many users to post their life experiences in the form of a check-in which contains a POI (a physical location, such as museum or restaurant), a timestamp, and sometimes com-ments. Data collected by LBS has been effectively leveraged for POI-oriented applications like POI recommendation and location prediction for potential users to improve user expe-riences and quality of services.
∗
Corresponding author: Fuzhen Zhuang
Copyright c2019, Association for the Advancement of Artificial Intelligence (www.aaai.org). All rights reserved.
In this paper, we focus on missing POI check-in identi-fication, which is to identify where a user has visited at a specific time in the past, while existing POI-oriented studies mainly focus on recommending or predicting a POI where a user may go in the future. This missing POI check-in iden-tification task is non-trivial due to the following reasons. First, geolocation information missing, which causes trou-ble for user understanding, frequently occurs in raw real-life check-ins. For example, if a user visits a location with-out GPS signal, the geolocation information may be miss-ing. And missing POI check-in identification helps to iden-tify where a user has visited at given time. Second, there are many obvious unreal check-ins in raw real-life check-in data. For example, two check-in records of the same users are far apart in geographical distance, but the time interval is very short. The unreal data maybe recorded due to de-vice failure or user cheating. Missing POI check-in identi-fication can give a reference list and preliminarily filter the data. Third, almost all kinds of POI recommendation and location prediction tasks suffer from data sparsity problem, which is much worse than other human activity data such as online purchase and browsing. And missing POI check-in identification is able to alleviate the sparsity problem for user understanding. Moreover, the task can be used for so-cial good, such as identifying traces of criminal activity or missing population analysis.
Moreover, neural networks have been used in the field of POI recommendation and location prediction (Liu et al. 2016; Wang et al. 2017; Yin et al. 2017). A method called Spatial Temporal Recurrent Neural Networks (ST-RNN) (Liu et al. 2016) was proposed to model local temporal and spatial contexts in each layer with time-specific tran-sition matrices for different time intervals and distance-specific transition matrices for different geographical dis-tances. However, these methods are not designed for missing POI check-in identification. They can not model global spa-tial information and spatio-temporal dependence relation-ships, which are very important in check-ins. Besides, these methods utilize past check-in information for future predic-tion or recommendapredic-tion from a single direcpredic-tion perspective, while the missing POI check-in identification task needs to utilize the check-in information before and after the given time, which naturally calls for a bi-directional solution.
Along this line, we propose a novelBi-directionalSpatial andTemporalDependence and users’DynamicPreferences (Bi-STDDP) model for missing POI check-in identification. The bi-directional model can utilize more information than the above recommendation and prediction methods and is more suitable for the proposed task. Moreover, Bi-STDDP integrates local temporal information and global spatial in-formation. Therefore, Bi-STDDP can well model not only the local context relationships but also the global ones. As we know, check-ins have complex spatio-temporal depen-dence relationships. For example, it is impossible that two check-in records of the same user are far apart in geograph-ical distance, but the time interval is very short. This kind of complex spatio-temporal dependence can be modeled by Bi-STDDP and learned automatically by gradient descent performed on the whole model. In addition, target tempo-ral pattern in combination with user and POI information can capture users’ dynamic preferences. Finally, the spatio-temporal dependence together with users’ dynamic prefer-ences provide accurate identification on missing POI check-ins.
The main contributions of this work are listed as follows:
• The proposed model can address the non-trivial missing POI check-in identification task using bi-directional se-quences to model complex global spatial and local tem-poral dependence relationships and users’ dynamic pref-erences.
• The traditional POI recommendation and location predic-tion tasks can be seen as a special case of the missing POI check-in identification task. And the proposed model can be easily extended to address POI recommendation and location prediction tasks by using only forward sequence information.
• Experimental results on real-world datasets show the pro-posed Bi-STDDP model obtains significant improvement compared with existing state-of-the-art approaches.
Related Work
The most related work to missing POI check-in identifi-cation is loidentifi-cation prediction and POI recommendation. In this section, we present the related work in twofold: general
methods on location prediction and POI recommendation, and neural network based methods.
Location Prediction and POI Recommendation
The key difference between location prediction and POI ommendation is that POI recommendation focuses on rec-ommending new locations which do not exist in users’ his-torical check-ins while location prediction can predict re-peated locations. However recent work often does not make a clear distinction between them, we discuss them together here.
Different from traditional recommendation tasks (e.g., product recommendation, movie recommendation), location prediction and POI recommendation are to predict the next location utilizing spatial, temporal information of users’ his-torical check-in sequences rather than user-item rating ma-trix. Therefore, the sequential information plays a crucial role in the successive check-in sequences. Users’ move-ment constraint was taken into account in FPMC-LR (Fac-toring Personalized Markov Chains and Localized Regions) (Cheng et al. 2013) via exploiting the personalized Markov chain in the check-in sequence. Personalized Ranking Met-ric Embedding (PRME) (Feng et al. 2015) integrated geo-graphical influence to improve the recommendation perfor-mance. Similarly, embedding method has also been intro-duced in Graph-based Embedding (GE) (Xie et al. 2016). Besides, information such as temporal effects (Gao et al. 2013), spatial-aware (Yin et al. 2017), behavior patterns (He et al. 2016), category-aware (He, Li, and Liao 2017), various contexts (Yang et al. 2017a) have been studied accordingly.
Neural Network for Location Prediction and POI
Recommendation
Methodology
In this section, we first formulate the problem of miss-ing POI check-in identification, then we present the de-tails of the proposed Bi-STDDP model, which integrates bi-directional spatio-temporal dependence and users’ dynamic preferences.
Problem Statement
Let U = {u1, u2, ..., uN} be a set of N users and P =
{p1, p2, ..., pM} be a set ofM POIs. Each POI pis
asso-ciated with its coordinate{xp, yp}, and each useruis
as-sociated with a list of check-insCu = {pu t1, p
u t2, ..., p
u tT,}, wherepu
ti means useruvisit POIpat timeti. Assume the
tth check-inpu
tt of useruis missing, the task is to identify which POI the useruvisited at a specific timettaccording
to the forward sequence beforett,{put1, p
u t2, ..., p
u
tt−1}, and the backward sequence aftertt,{putt+1, p
u tt+2, ..., p
u tT}.
Bi-directional Spatial and Temporal Dependence
Spatial and temporal information has very complex depen-dence relationships, here we first introduce these two kinds of information separately, global spatial information and lo-cal temporal information. Global spatial information means we consider the relationship between the targeting POI and all the other POIs. While only local temporal information is considered since the missing check-inputtof useruis more related to the POIs which useruvisited at a short temporal interval before and after timett.
We first introduce the extraction of the global spatial in-formation. For POI check-inspu
tt−1andp
u
tt+1, we define the global spatial vectors of POI check-ins pu
tt−1 andp
u tt+1 as follows:
st−1 =
Dpu tt−1
σ(Dpu tt−1)
, (1)
st+1 =
Dpu tt+1
σ(Dpu tt+1)
, (2)
whereσis the standard deviation,D ∈RM×M is the geo-graphical distance matrix of all candidate POIs, which con-tains the global spatial information, andDpu
tt−1 is the geo-graphical distance vector between POIpu
tt−1 and all candi-date POIs. The geographical distance vector can be normal-ized by dividing the standard deviation.
Besides, local temporal interval to the target time tt is
considered as follows:
it−1 = tt−tt−1, (3)
it+1 = tt+1−tt. (4)
Due to the complex dependence relationships between spatial and temporal, for examples, it is impossible to go far away at a short time interval, but it is possible to go to a close POI at a great time interval. So we need take the global spa-tial and local temporal into overall consideration to model the complex dependence relationships, firstly, we transform
the local temporal interval into the same space RM as the global spatial vectors:
it−1 = f(wt−1it−1), (5)
it+1 = f(wt+1it+1), (6)
wherewt−1,wt+1 ∈ RM and the activation functionf(x) is chosen as atanhfunctionf(x) = eexx−+ee−−xx.
Finally, the bi-directional dependence relationships be-tween global spatial and local temporal interval are encoded as follows:
dt−1 = st−1it−1, (7)
dt+1 = st+1it+1, (8)
the dependence relationships are modeled by element-wise product operatorand can be learned automatically by gra-dient descent performed on the whole model.
Users’ Dynamic Preferences
Users’ check-in preferences change with time and the pref-erence variance exists in several scales which is observed in (Gao et al. 2013). For example, users usually visit cof-fee house at afternoon and bars at night; users are usually around the office in weekdays while go shopping on week-ends. Our model captures the specific temporal pattern in two scales: hours of a day, and different days of a week. We split a week into weekday and weekend, and a day into the following five sessions: the morning[8 : 00,11 : 30), the noon[11 : 30,14 : 00), the afternoon[14 : 00,17 : 30), the night[17 : 30,22 : 00)and the rest one. Thus, the target timettis encoded to one7-dim pattern vectorvtby setting
the corresponding bits to 1 and the rests to 0. For example, target time11 : 30AM Aug25 2018on a Saturday can be encoded into a pattern vector as follows (The first two bits correspond to the weekday and weekend, and the rest ones correspond to the five sessions):
vt= [0 1 0 1 0 0 0]>. (9)
Then, we capture user and POI information with embed-ding layers. The embedembed-ding layers can be seen as perform-ing the latent factor modelperform-ing for POI popularity and user preference. It learns two matricesEp andEu, each row of which represents a POI and a user, respectively. If we use one-hot encoded POIpu
tt−k,p
u tt+k ∈R
M and useru∈
RN as input vectors, the outputs of embedding layers can be ex-pressed as
e(putt−k) = Ep>putt−k, (10)
e(putt+k) = Ep>putt+k, (11)
e(u) = Eu>u, (12)
where1≤k≤w, andwis the window width,Ep∈RM×d
andEu ∈ RN×ddenote the embedding matrices for POIs and users,dis the dimension of embedding vectors.
add them up to model users’ dynamic preferences:
h(e(putt−w)) = f( X
1≤k≤w
Wk−e(p
u
tt−k)), (13)
h(e(putt+w)) = f( X
1≤k≤w
Wk+e(putt+k)), (14)
h(e(u)) = f(Wue(u)), (15) h(vt) = f(Wtvt), (16)
cut = h(e(put
t−w)) +h(e(p
u tt+w)) +h(e(u)) +h(vt), (17)
whereWk−,Wk+,Wu ∈ Rh×d andWt ∈ Rh×7 are the parameters of hidden layers,his the number of hidden units andf istanh activation function. And thecu
t are the
dy-namic preferences of useru.
The Final Bi-STDDP Model
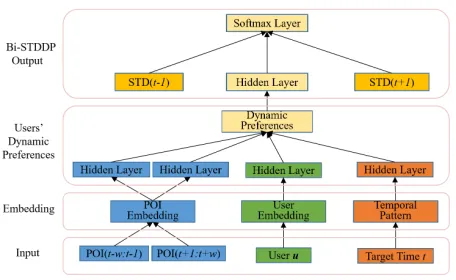
Figure 1: The proposed Bi-STDDP model
We present the final neural network architecture of Bi-STDDP in Figure 1. The bi-directional check-in sequences, user and target time are fed into the embedding layers and users’ dynamic preferences are captured by hidden layer. The output of Bi-STDDP can be yielded via combining bi-directional spatial and temporal dependence and users’ dy-namic preferences in Equation (7), (8) and (17) respectively. The prediction of where has userubeen at timettcan be
computed as:
out =sof tmax(dt−1+dt+1+Wccut), (18)
whereWc ∈ RM×h are the parameters to transform the users’ dynamic preferences to the same space as the depen-dence relationships. Theou
t is a distribution which indicates
different probability of all candidate POIs the userumight visit at timett. And the POIs which k maximum
probabil-ities corresponding to are the top-k identifications for the missing POI check-in.
We need to minimize thecross entropyof predicted dis-tribution and the actual disdis-tribution:
J(θ) =−1 S
S
X
i=1
M
X
j=1
yi,jlog(out,j|xi, θ), (19)
whereSis the number of samples,Mis the number of POIs,
yi ∈ RM is the one-hot label of sample xi and θ is the parameters set.
Training is done through stochastic gradient descent over shuffled mini-batches with the Adam (Kinga and Adam 2015) update rule.
Experiments
In this section, we conduct experiments to evaluate the proposed Bi-STDDP against various baseline methods on three real-world datasets. In the next, we first introduce the datasets, implementation details, baseline methods and eval-uation metrics, followed by our experimental results and dis-cussions.
Datasets
Three real-world LBSN datasets, i.e., NYC, TKY, Gowalla, are used in the experimental study. The statistics of the three datasets are listed in Table 1.
• NYC1 (Yang et al. 2015) is a dataset from Foursquare, it includes long-term (about 10 months) check-in data in New York city collected from April 2012 to February 2013.
• TKY1(Yang et al. 2015) is a dataset similar to NYC ex-cept it is collected from Tokyo.
• Gowalla2 (Cho, Myers, and Leskovec 2011) is a dataset collected from Gowalla, with the time span from February 2009 to October 2010.
Table 1: Statistics of the three datasets.
Dataset #user #POI #check in Sparsity NYC 1,083 38,333 227,428 99.452% TKY 2,293 61,858 573,703 99.596% Gowalla 107,092 1,280,969 6,442,892 99.995%
We eliminate users with fewer than 10 check-ins and POIs visited by fewer than 10 users in these three datasets. Then, we sort each user’s check-in records by time, and take the first80%as the training set, the following10%as the vali-dation set and the remaining10%as the test set.
Implementation Details
For all datasets we use: embedding dimension of 64, hid-den units of 256, window width of 1 (temporal locality and a compromise between performance and efficiency), mini-batch size of 128 and learning rate of 0.001. All these values are chosen via a grid search on the NYC validation set. We initialize all parameters in the neural network from glorot uniform distributions (Glorot and Bengio 2010), and we do not perform any dataset-specific tuning except early stop-ping on validation sets.
1
https://sites.google.com/site/yangdingqi/home/foursquare-dataset
2
Baselines
We compare the proposed method with counting-based methods (Forward, Backward, TOP1, TOP2), traditional POI recommendation algorithms (PRME, PRME-G), neu-ral network based approaches (RNN, LSTM, GRU, STRNN, PACE). Some earlier methods likes PMF (Salakhutdi-nov and Mnih 2007), FPMC (Rendle, Freudenthaler, and Schmidt-Thieme 2010), FPMC-LR (Cheng et al. 2013) have been proved to be not as good as PRME-G (Feng et al. 2015; Liu et al. 2016; He, Li, and Liao 2017), so we don’t compare these methods.
• Forward: The forward transition probability between POIs is taken as prediction for all users.
• Backward: The backward transition probability between POIs is taken as prediction for all users.
• TOP1: The most popular locations in the training set are selected as prediction for all users.
• TOP2: The most popular locations in the training set are selected as prediction for each user.
• PRME(Feng et al. 2015): User and POI are embedded into the same latent space to capture the user transition patterns.
• PRME-G(Feng et al. 2015): It takes distance between destination location and recent visited ones into consid-eration on the basis of PRME.
• RNN(Zhang et al. 2014): This is a neural network method which directly models the dependence on user’s sequen-tial behaviors into the click prediction process through the recurrent structure in RNN.
• LSTM(Hochreiter and Schmidhuber 1997): This is a spe-cial RNN model, which contains a memory cell and three multiplicative gates to learn long-term dependence.
• GRU(Cho et al. 2014): This is another special RNN model, which contains two gates and is simpler than LSTM.
• STRNN(Liu et al. 2016): This is a RNN-based model for next POI recommendation. It incorporates both the time-specific transition matrices and distance-time-specific transi-tion matrices within recurrent architecture.
• PACE(Yang et al. 2017a): This is a deep neural architec-ture that jointly learns the embeddings of users and POIs to predict both user preference over POIs and various con-text associated with users and POIs.
Evaluation Metrics
To evaluate the performance of our proposed Bi-STDDP and the baselines described above, we use three standard metrics following the existing work (Liu et al. 2016): Recall@K,
F1-score@K, and Mean Average Precision (MAP). Note we don’t use Precision@K since it is positively correlated with Recall@K and provides similar results in our settings. Recall@K is 1 if the POI visited appears in the top-K ranked list; otherwise is 0. The final Recall@K is the average value over all test ground truth instances. MAP is a global eval-uation for ranking tasks, and it is usually used to evaluate
the quality of the whole ranked lists. We report Recall@K and F1-score@K with K = 1, 5 and 10 in our experiments. The larger the value, the better the performance for all the evaluation metrics.
Performance Comparison
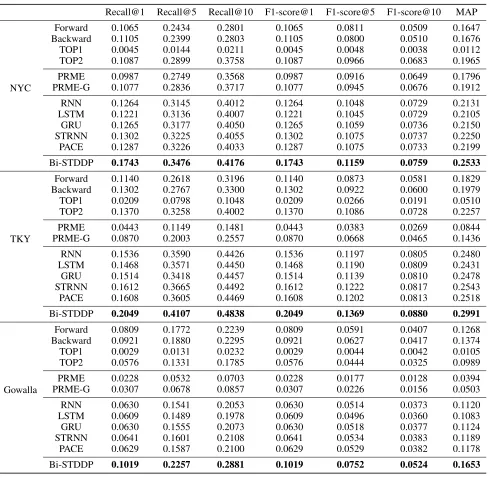
The experimental results evaluated by Recall@K, F1-score@K, and MAP on NYC, TKY and Gowalla are pre-sented in Table 2. Since users’ behavior patterns are regular and follow the long-tailed distribution, we see that counting-based methods Forward and Backward have acceptable performances on all three datasets. And the performances of Forward and Backward are even better than PRME and PRME-G. Similarly, counting-based personalized TOP2 also have an good performance on NYC and TKY, while the non-personalized TOP1 performs worst. PRME-G slightly improves the results comparing with PRME via incorpo-rating distance information. RNN-based methods (RNN, LSTM, GRU) obtain similar performance improvement over PRME-G because of their sequence modeling capability. PACE predicts both user preference over POIs and various context associated with users and POIs to achieves further improvement over RNN-based methods. Another great im-provement is brought by ST-RNN, and it is the best method among the baselines on three datasets. It incorporates both the time-specific transition matrices and distance-specific transition matrices within recurrent architecture. Moreover, Bi-STDDP outperforms the baseline methods over all eval-uation metrics on all three datasets. On NYC dataset, the Recall@1, Recall@5, Recall@10 improvements comparing with best baseline ST-RNN are33.87%,7.78%, and2.98% respectively which indicates that the Bi-STDDP improves even more on higher ranking list, similar results can also be observed on TKY and Gowalla. These improvements indicate that our proposed Bi-STDDP can model the bi-directional dependence of global spatial and local temporal and capture users’ dynamic preferences.
Impact of Different Parts
In this subsection, we firstly investigate the impact of forward and backward sequences. It is intuitive that bi-directional sequences can bring more useful information and performance improvement than a single sequence. As shown in Table 3, Bi-STDDP improves the performance evalu-ated by Recall@K and MAP comparing with F-STDDP and B-STDDP which use forward and backward check-in se-quences, respectively. Note that the performances of our method F-STDDP which only utilizes the forward sequence are still better than all baseline methods which contain POI recommendation and location prediction methods. It shows that the proposed Bi-STDDP model can be naturally applied to POI recommendation and location prediction tasks with competitive performance.
Table 2: Evaluation of missing POI identification in terms of Recall@K, F1-score@K and MAP.
Recall@1 Recall@5 Recall@10 F1-score@1 F1-score@5 F1-score@10 MAP
NYC
Forward 0.1065 0.2434 0.2801 0.1065 0.0811 0.0509 0.1647
Backward 0.1105 0.2399 0.2803 0.1105 0.0800 0.0510 0.1676
TOP1 0.0045 0.0144 0.0211 0.0045 0.0048 0.0038 0.0112
TOP2 0.1087 0.2899 0.3758 0.1087 0.0966 0.0683 0.1965
PRME 0.0987 0.2749 0.3568 0.0987 0.0916 0.0649 0.1796
PRME-G 0.1077 0.2836 0.3717 0.1077 0.0945 0.0676 0.1912
RNN 0.1264 0.3145 0.4012 0.1264 0.1048 0.0729 0.2131
LSTM 0.1221 0.3136 0.4007 0.1221 0.1045 0.0729 0.2105
GRU 0.1265 0.3177 0.4050 0.1265 0.1059 0.0736 0.2150
STRNN 0.1302 0.3225 0.4055 0.1302 0.1075 0.0737 0.2250
PACE 0.1287 0.3226 0.4033 0.1287 0.1075 0.0733 0.2199
Bi-STDDP 0.1743 0.3476 0.4176 0.1743 0.1159 0.0759 0.2533
TKY
Forward 0.1140 0.2618 0.3196 0.1140 0.0873 0.0581 0.1829
Backward 0.1302 0.2767 0.3300 0.1302 0.0922 0.0600 0.1979
TOP1 0.0209 0.0798 0.1048 0.0209 0.0266 0.0191 0.0510
TOP2 0.1370 0.3258 0.4002 0.1370 0.1086 0.0728 0.2257
PRME 0.0443 0.1149 0.1481 0.0443 0.0383 0.0269 0.0844
PRME-G 0.0870 0.2003 0.2557 0.0870 0.0668 0.0465 0.1436
RNN 0.1536 0.3590 0.4426 0.1536 0.1197 0.0805 0.2480
LSTM 0.1468 0.3571 0.4450 0.1468 0.1190 0.0809 0.2431
GRU 0.1514 0.3418 0.4457 0.1514 0.1139 0.0810 0.2478
STRNN 0.1612 0.3665 0.4492 0.1612 0.1222 0.0817 0.2543
PACE 0.1608 0.3605 0.4469 0.1608 0.1202 0.0813 0.2518
Bi-STDDP 0.2049 0.4107 0.4838 0.2049 0.1369 0.0880 0.2991
Gowalla
Forward 0.0809 0.1772 0.2239 0.0809 0.0591 0.0407 0.1268
Backward 0.0921 0.1880 0.2295 0.0921 0.0627 0.0417 0.1374
TOP1 0.0029 0.0131 0.0232 0.0029 0.0044 0.0042 0.0105
TOP2 0.0576 0.1331 0.1785 0.0576 0.0444 0.0325 0.0989
PRME 0.0228 0.0532 0.0703 0.0228 0.0177 0.0128 0.0394
PRME-G 0.0307 0.0678 0.0857 0.0307 0.0226 0.0156 0.0503
RNN 0.0630 0.1541 0.2053 0.0630 0.0514 0.0373 0.1120
LSTM 0.0609 0.1489 0.1978 0.0609 0.0496 0.0360 0.1083
GRU 0.0630 0.1555 0.2073 0.0630 0.0518 0.0377 0.1124
STRNN 0.0641 0.1601 0.2108 0.0641 0.0534 0.0383 0.1189
PACE 0.0629 0.1587 0.2100 0.0629 0.0529 0.0382 0.1178
Bi-STDDP 0.1019 0.2257 0.2881 0.1019 0.0752 0.0524 0.1653
Table 3: Impact of forward and backward sequences on NYC dataset evaluated by Recall@K and MAP.
Recall@1 Recall@5 Recall@10 MAP F-STDDP 0.1586 0.3378 0.4050 0.2405 B-STDDP 0.1580 0.3372 0.4089 0.2405 Bi-STDDP 0.1743 0.3476 0.4176 0.2533
(16) and only the dependence relationships in Equation (7), (8), we construct Bi-A and Bi-B models respectively for contrast experiment. Table 4 illustrates the performance of
Table 4: Impact of temporal pattern and dependence rela-tionships on NYC dataset evaluated by Recall@K and MAP.
Recall@1 Recall@5 Recall@10 MAP Bi-A 0.1435 0.3279 0.4068 0.2284 Bi-B 0.1650 0.3374 0.4128 0.2457 Bi-STDDP 0.1743 0.3476 0.4176 0.2533
dy-(a) Impact of Embedding Dimensiond(h= 256) (b) Impact of Hidden Unitsh(d= 64)
Figure 2: Performance of Bi-STDDP with varying embedding dimension and hidden units on NYC dataset evaluated by Re-call@K and MAP.
namic preferences which indicates the significance of the temporal pattern. And Bi-STDDP achieves further improve-ment via taking the dependence relationships into considera-tion. So we can say that Bi-STDDP can capture dependence relationships between global spatial and local temporal and users’ dynamic check-in preferences for improving the miss-ing POI check-in identification performance.
Impact of Parameters
Figure 2(a) and 2(b) show the results under different set-tings of embedding dimensiondand hidden unitsh. We il-lustrate the Recall@K and MAP performance of Bi-STDDP on NYC test set. Note that the best parameters are selected by grid search on NYC validation set, while the impact of parameters is evaluated on NYC test set. Validation and test performances are similar on different parameters.
Firstly, considering embedding dimension, we vary the embedding dimension as[2,4,6,8,12,16,32,64,128,256]. we can see that as the embedding dimension increases, the performance of the model is gradually improved, and when the embedding dimensiondlarger than16, the performance becomes stabilized. The embedding dimension determines the complexity and capability of the model. Smaller embed-ding dimension may fit the data distribution insufficiently, especially if the numbers of POIs and users are large. While larger embedding dimension increases the complexity of the model and requires more computational cost, a proper em-bedding dimension can help achieve the best performance. Making a compromise between performance and efficiency, we finally selectd= 64as the embedding dimension.
Similar results can also be observed with varying hidden units. We vary the number of hidden units as [2,4,6,8,12,16,32,64,128,256,512,1024]to evaluate the performance on NYC dataset of our proposed Bi-STDDP model. As shown in Figure 2(b), the performance of the model becomes stabilized when the number of hidden units is larger than32. The hidden layer which is closer to the
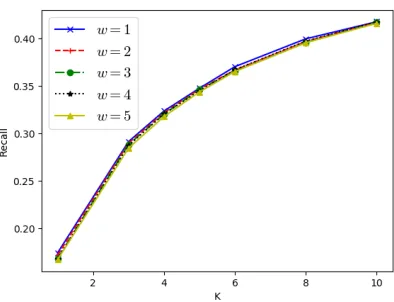
out-Figure 3: Recall@K performance of Bi-STDDP on NYC dataset with varying window widthw.
put requires larger feature dimension than embedding layer which is closer to the input. Soh = 256is a proper num-ber of hidden units. Finally, we can get the best parameters which d = 64 and h = 256 respectively. Even without tuned parameters, Bi-STDDP still outperforms other base-line methods according to Table 2 and Figure 2. Further, we can say that the performance of Bi-STDDP stays stable in a large range of parameters and is not very sensitive to both embedding dimension and hidden units.
We also vary the window widthwof our proposed model on NYC dataset to investigate the impact of the sequence length. Figure 3 shows the detailed Recall@K performance. There is no obvious difference between these results of dif-ferent window width. It makes sense that the missing POI check-inputtof useruis more related to the POIs which user
uvisited at a short temporal interval before and after time
modeled by target temporal pattern in combination with user and POI information which can learn automatically by gra-dient descent performed on the whole model of all training data, so larger window width brings little useful additional information and may even hurt the model performance due to introducing noise information. Therefore, making a bal-ance between performbal-ance and efficiency, we selectw= 1 as the window width.
Conclusion
In this paper, we focused on the missing POI check-in iden-tification task to identify where a user has visited at a spe-cific time in the past, which is different from existing POI-oriented tasks to recommend or predict a POI where a user may go in the future. To address this task, we proposed a novel neural network model called Bi-STDDP. Specifically, in our model the bi-directional global spatial and local tem-poral information are combined together to capture complex dependence relationships. Also, target temporal pattern in combination with user and POI information are integrated to capture users’ dynamic preferences. Finally, extensive ex-perimental results on three large-scale real-world datasets demonstrated the substantial performance improvement of our proposed model over various kinds of state-of-the-art methods.
Acknowledgments
The research work is supported by the National Key Re-search and Development Program of China under Grant No. 2018YFB1004300, the National Natural Science Foun-dation of China under Grant No. 61773361, 61473273, 91546122, Guangdong provincial science and technology plan projects under Grant No. 2015B010109005, the Project of Youth Innovation Promotion Association CAS under Grant No. 2017146.
References
Bao, T.; Cao, H.; Chen, E.; Tian, J.; and Xiong, H. 2012. An un-supervised approach to modeling personalized contexts of mobile users.Knowledge and Information Systems31(2):345–370. Cheng, C.; Yang, H.; Lyu, M. R.; and King, I. 2013. Where you like to go next: Successive point-of-interest recommendation. In
IJCAI, volume 13, 2605–2611.
Cho, K.; Van Merrienboer, B.; Gulcehre, C.; Bahdanau, D.; Bougares, F.; Schwenk, H.; and Bengio, Y. 2014. Learning phrase representations using rnn encoder-decoder for statistical machine translation.Computer Science.
Cho, E.; Myers, S. A.; and Leskovec, J. 2011. Friendship and mo-bility: user movement in location-based social networks. InKDD, 1082–1090.
Feng, S.; Li, X.; Zeng, Y.; Cong, G.; Chee, Y. M.; and Yuan, Q. 2015. Personalized ranking metric embedding for next new poi recommendation. InIJCAI, volume 15, 2069–2075.
Gao, H.; Tang, J.; Hu, X.; and Liu, H. 2013. Exploring tempo-ral effects for location recommendation on location-based social networks. InProceedings of the 7th ACM conference on Recom-mender systems, 93–100.
Glorot, X., and Bengio, Y. 2010. Understanding the difficulty of training deep feedforward neural networks. InProceedings of the
thirteenth international conference on artificial intelligence and statistics, 249–256.
He, J.; Li, X.; Liao, L.; Song, D.; and Cheung, W. K. 2016. Infer-ring a personalized next point-of-interest recommendation model with latent behavior patterns. InAAAI, 137–143.
He, J.; Li, X.; and Liao, L. 2017. Category-aware next point-of-interest recommendation via listwise bayesian personalized rank-ing. InIJCAI, 1837–1843.
Hochreiter, S., and Schmidhuber, J. 1997. Long short-term mem-ory. Neural computation9(8):1735–1780.
Kinga, D., and Adam, J. B. 2015. A method for stochastic opti-mization. InICLR, volume 5.
Liu, Q.; Wu, S.; Wang, L.; and Tan, T. 2016. Predicting the next location: A recurrent model with spatial and temporal contexts. In
AAAI, 194–200.
Rendle, S.; Freudenthaler, C.; and Schmidt-Thieme, L. 2010. Fac-torizing personalized markov chains for next-basket recommenda-tion. InWWW, 811–820.
Salakhutdinov, R., and Mnih, A. 2007. Probabilistic matrix factor-ization. InNIPS, 1257–1264.
Wang, F.; Qu, Y.; Zheng, L.; Lu, C.-T.; and Philip, S. Y. 2017. Deep and broad learning on content-aware poi recommendation. InCollaboration and Internet Computing (CIC), 2017 IEEE 3rd International Conference on, 369–378.
Xie, M.; Yin, H.; Wang, H.; Xu, F.; Chen, W.; and Wang, S. 2016. Learning graph-based poi embedding for location-based recom-mendation. InCIKM, 15–24.
Yang, D.; Zhang, D.; Zheng, V. W.; and Yu, Z. 2015. Modeling user activity preference by leveraging user spatial temporal charac-teristics in lbsns.IEEE Transactions on Systems, Man, and Cyber-netics: Systems45(1):129–142.
Yang, C.; Bai, L.; Zhang, C.; Yuan, Q.; and Han, J. 2017a. Bridg-ing collaborative filterBridg-ing and semi-supervised learnBridg-ing: a neural approach for poi recommendation. InKDD, 1245–1254.
Yang, C.; Sun, M.; Zhao, W. X.; Liu, Z.; and Chang, E. Y. 2017b. A neural network approach to jointly modeling social networks and mobile trajectories. ACM Transactions on Information Sys-tems (TOIS)35(4):36.
Yin, H.; Wang, W.; Wang, H.; Chen, L.; and Zhou, X. 2017. Spatial-aware hierarchical collaborative deep learning for poi rec-ommendation. IEEE Transactions on Knowledge and Data Engi-neering29(11):2537–2551.
Zhang, Y.; Dai, H.; Xu, C.; Feng, J.; Wang, T.; Bian, J.; Wang, B.; and Liu, T.-Y. 2014. Sequential click prediction for sponsored search with recurrent neural networks. InAAAI, volume 14, 1369– 1375.
Zhang, Z.; Li, C.; Wu, Z.; Sun, A.; Ye, D.; and Luo, X. 2017. Next: a neural network framework for next poi recommendation. arXiv preprint arXiv:1704.04576.
Zhao, P.; Zhu, H.; Liu, Y.; Li, Z.; Xu, J.; and Sheng, V. S. 2018. Where to go next: A spatio-temporal lstm model for next poi rec-ommendation.arXiv preprint arXiv:1806.06671.
Zhu, Y.; Li, H.; Liao, Y.; Wang, B.; Guan, Z.; Liu, H.; and Cai, D. 2017. What to do next: Modeling user behaviors by time-lstm. In